Article Text

Abstract
BACKGROUND Pulmonary arterial hypertension (PAH) in patients with sleep apnoea syndrome (SAS) is classically ascribed to associated chronic obstructive pulmonary disease (COPD). The aim of this retrospective study was to evaluate the possible occurrence of PAH as a complication of SAS in patients without COPD.
METHODS Right heart catheterisation was performed in 44 patients with SAS and without COPD confirmed by polysomnography (apnoea index >5/h) admitted for the administration of nasal continuous positive airway pressure (CPAP).
RESULTS Precapillary PAH, defined as mean pulmonary arterial pressure of >20 mm Hg with pulmonary capillary wedge pressure <15 mm Hg, was observed in 12/44 (27%) patients with SAS. There were no significant differences in apnoea index between patients with (PAH+) and those without PAH (PAH–) (42.6 (26.3) versus 35.8 (21.7) apnoeas/h). The PAH+ group differed significantly from the PAH– group in the following respects: lower daytime arterial oxygen tension (Pao 2) (9.6 (1.1) versus 11.3 (1.5) kPa, p=0.0006); higher daytime arterial carbon dioxide tension (Paco 2) (5.8 (0.5) versus 5.3 (0.5) kPa, p=0.002); more severe nocturnal hypoxaemia with a higher percentage of total sleep time spent at Sao 2<80% (32.2 (28.5)% versus 10.7 (18.8)%, p=0.005); and higher body mass index (BMI) (37.4 (6) versus 30.3 (6.7) kg/m2, p=0.002). The PAH+ patients had significantly lower values of vital capacity (VC) (87 (14)% predicted versus 105 (20)% predicted, p=0.005), forced expiratory volume in one second (FEV1) (82 (14)% predicted versus 101 (17)% predicted, p=0.001), expiratory reserve volume (40 (16)% predicted versus 77 (41)% predicted, p=0.003), and total lung capacity (87 (13)% predicted versus 98 (18)% predicted, p=0.04). Stepwise multiple regression analysis showed that mean pulmonary artery pressure (PAPm) was positively correlated with BMI and negatively with Pao 2.
CONCLUSION Pulmonary arterial hypertension is frequently observed in patients with SAS, even when COPD is absent, and appears to be related to the severity of obesity and its respiratory mechanical consequences.
- sleep apnoea syndrome
- pulmonary arterial hypertension
- obesity
Statistics from Altmetric.com
It has been shown that sleep apnoeas may induce acute pulmonary hypertension, the main mechanism being hypoxia related pulmonary vasoconstriction.1 ,2 Other contributing factors are hypercapnia induced pulmonary vasoconstriction and exaggerated negative intrathoracic pressure during obstructive apnoeas.3However, the prevalence of sustained precapillary pulmonary arterial hypertension (PAH) in patients presenting with sleep apnoea syndrome (SAS) varies from 10% to 79%.4-7 Most authors claim that nocturnal apnoea cannot induce permanent PAH and that PAH in patients with SAS is related to an associated obstructive ventilatory defect. However, a few recent studies have produced different results which suggest a direct link between nocturnal apnoea and daytime PAH.
These discrepancies can be interpreted in many ways. Firstly, the methods for assessing PAH vary between studies, ranging from right heart catheterisation to echocardiography or simple clinical evaluation.5-8 In some studies pulmonary capillary wedge pressure was not measured when right heart catheterisation was performed, and this could lead to an overestimation of the prevalence of precapillary PAH.9 The other causes of precapillary PAH such as thromboembolic disease and the use of appetite suppressants have not necessarily been excluded. Most of the published studies did not exclude patients with chronic obstructive pulmonary disease (COPD), a major cause of PAH. Only three studies assessing the prevalence of PAH in SAS have excluded patients with associated COPD.6 ,10 ,11 Weber et al 10 reported a 10% prevalence of PAH in 89 patients with SAS without COPD using right heart catheterisation for diagnosis of PAH. Sanner et al 11 reported a prevalence of 20% using right heart catheterisation, but almost half of the patients with PAH had simultaneously increased pulmonary capillary wedge pressure. Sajkovet al 6 observed a PAH prevalence of 41% in patients with SAS without obstructive ventilatory defect, but the patient numbers were very small (n=27) and the diagnosis of PAH was based on echocardiography Döppler measurements which are known to be limited in the diagnosis of moderate PAH.
This study was undertaken to evaluate the prevalence of precapillary pulmonary hypertension using haemodynamic measurements in patients with SAS without COPD, and to clarify the mechanisms of PAH in such patients.
Methods
STUDY GROUP
Sixty nine patients with SAS consecutively admitted for the administration of nasal continuous positive airway pressure (nCPAP) were considered for inclusion in the study.
Inclusion criteria
The study patients were recruited from a patient population with SAS confirmed by prior polysomnographic evaluation with an apnoea index (AI) of >5 apnoeas/h. The indications for nCPAP were as follows: AI >20/h and/or apnoea-hypopnoea index (AHI) of >30/h and/or profound nocturnal desaturation and/or severe daytime sleepiness. In these patients arterial blood gas analysis, lung function tests, and right heart catheterisation were performed to assess cardiorespiratory complications of SAS.
Exclusion criteria
The following exclusion criteria were applied: obstructive ventilatory defect defined as forced expiratory volume in one second (FEV1) of <70% predicted and an FEV1/vital capacity (VC) ratio of <60%; any restrictive ventilatory defect other than those related to obesity (pulmonary fibrosis, sequelae of pulmonary tuberculosis, or chest wall defect disease); associated disease potentially responsible for PAH such as the use of appetite suppressants or a clinical history of venous thromboembolic disease; bronchopulmonary infection or cardiac or respiratory failure in the previous two months; and mixed or postcapillary PAH identified by haemodynamic measurements (pulmonary capillary wedge pressure ⩾15 mm Hg).
A total of 25 patients were excluded from the study (eight with COPD, three with prior use of anorexigens, four with prior venous thromboembolism, three who refused catheterisation, one in whom catheterisation was unsuccessful, and six with postcapillary PAH), leaving 44 patients for inclusion in the study.
POLYSOMNOGRAPHY
An overnight polygraphic sleep study was carried out in the sleep laboratory using standard recording techniques with the Alvar polygraphic recorder (Medical Equipment International, Lyon, France) and Nightingale software (Deltamed, Paris, France). Sleep was monitored by electroencephalography, electro-oculography, and chin electromyography.
Air flow was recorded with an oronasal thermistor. Apnoeas were defined as cessation of air flow for at least 10 seconds. AI was calculated as the number of apnoeas per hour of sleep. The type of apnoea (obstructive, central or mixed) was defined by analysis of thoracoabdominal movements which were recorded by respiratory inductive plethysmography using a mercury strain gauge (Volucapt). The transducers were placed around the chest and abdomen. Arterial oxyhaemoglobin saturation (Sao 2) was recorded with a pulse oximeter (Oxyshuttle, Sensor Medics).
The following oxyhaemoglobin desaturation parameters were measured: (1) minimal Sao 2; (2) percentage of total sleep time (TST) spent at Sao 2 <90% (TST-Sao 2 <90%); (3) percentage of TST spent at Sao 2 <80% (TST-Sao 2 <80%).
RIGHT HEART CATHETERISATION
Right heart catheterisation was carried out in all patients through the basilic vein under fluoroscopic control. The venous puncture was made by means of an 18 gauge needle according to the Seldinger's technique, followed by local anaesthesia and skin incision in order to facilitate insertion of the introducer. An introducer with an 8 French gauge was used for a 7 French gauge Swan-Ganz catheter (Baxter model 131 F7). The catheter was pushed forward under control of the pressure curve until it reached the right ventricle. The balloon was then inflated and the catheter pushed into the pulmonary artery under fluoroscopy.
The patients rested for 30 minutes after placement of the catheter in the pulmonary artery before the measurements were taken. After checking the baseline values the pressure curves were recorded using a Sirecust 1281 Siemens monitor under constant electrocardiographic monitoring. End expiratory pressures were recorded and occlusion pulmonary artery pressure was obtained after fully inflating the distal balloon.
Cardiac output was measured using the thermodilution technique with the balloon deflated and the tip of the catheter positioned in the pulmonary artery. The measurements were taken at room temperature by manually injecting 10 ml of 5% dextrose in water for less than four seconds using a Baxter American Edwards type COM-1 cardiac output monitor. The average of three recorded values with a variability of less than 10% was recorded.
The following parameters were measured: mean right atrial pressure (RAP), systolic pulmonary artery pressure (PAPs), diastolic pulmonary artery pressure (PAPd), mean pulmonary artery pressure (PAPm), mean pulmonary capillary wedge pressure (PCP), and cardiac output (CO). PAPm was measured by electronic averaging. Cardiac index (CI) and pulmonary vascular resistances (PVR) were calculated using standard equations:
CI (l/mn/m2) = CO/total body surface
PVR (IU/m2) = PAPm—PCP/CI
Pulmonary arterial hypertension was defined as PAPm of >20 mm Hg. This cut off value was chosen because it has been used in previous studies to evaluate the presence of chronic PAH in patients with SAS.7 ,9 ,11 ,12 Precapillary pulmonary hypertension was defined as PAPm >20 mm Hg associated with a PCP of <15 mm Hg.
ARTERIAL BLOOD GAS ANALYSIS
An arterial blood sample was taken during daytime wakefulness with the patient in a semi-recumbent position. The sample was analysed by means of IL 1306 or BG (Instrumentation Laboratory, Milano, Italy).
LUNG FUNCTION TESTS
Pulmonary volumes and flows were measured using a wet spirometer (Pulmonet III; Sensormedics Inc, Anheim, CA, USA) and the results were expressed as percentages of reference values.13
ANTHROPOMETRIC MEASUREMENTS
Body weight (kg) and height (m) were measured and body mass index (BMI) was calculated as body weight/height2(kg/m2).
STATISTICAL ANALYSIS
The results are presented as mean (SD) values and as percentages. Mean values were compared in patients with PAH (PAH+) and those without PAH (PAH–) using the Student's t test and percentages were compared in the two groups using the χ2test. Univariate analyses were performed to observe correlations between PAPm and all the anthropometric parameters, lung function data, arterial blood gas tensions, and polysomnographic parameters. Finally, multivariate stepwise analysis was made using Statview 4.2 software.
Results
Pulmonary arterial hypertension was present in 12 of the 44 patients (27%) with SAS. The overall PAPm was 20 (6.6) mm Hg; in the PAH+ group it was 28.5 (6.2) mm Hg. The results of the haemodynamic study are given in table 1.
Haemodynamic data
There was no significant difference between the PAH+ and PAH– groups with regard to age, sex ratio, height and smoking history (table 2). However, patients in the PAH+ group were significantly heavier than those in the PAH– group (113.6 (20.4) kg versus 87.6 (18.3) kg). Body mass index was also significantly higher in the PAH+ than in the PAH– group (37.4 (6.0) kg/m2 versus 30.3 (6.7) kg/m2).
General characteristics of the study patients
Arterial blood gas tensions are shown in table 3. Pao 2 was significantly lower in patients in the PAH+ group than in those in the PAH– group (9.6 (1.1) kPa versus 11.3 (1.5) kPa). The PAH+ group also had a significantly higher Paco 2 than the PAH– group (5.8 (0.5) kPa versus 5.3 (0.5) kPa). The percentage of patients with hypoxaemia (Pao 2 <9.3 kPa) was significantly higher in the PAH+ group (33.3% versus 3.1%). It is noteworthy that none of the patients in this series had severe hypoxaemia (Pao 2 <8 kPa). No significant difference was seen in the percentage of patients with hypercapnia (Paco 2 ⩾6 kPa) between the two groups and no patient had Paco 2 of >6.6 kPa. In the PAH+ group all the patients with hypoxaemia and/or hypercapnia had a body mass index exceeding 30 kg/m2 and an FEV1/VC ratio of over 70%.
Arterial blood gas data
Table 4 shows the results of the lung function tests. Significantly lower values of VC, FEV1, expiratory reserve volume (ERV), and total lung capacity (TLC) were observed in the PAH+ group than in the PAH– group. The two groups showed no significant difference in FEV1/VC ratio (73 (7)% versus 75 (7)%). A mild decrease in FEV1/VC (ranging from 60% to 75%) was observed in three patients in the PAH+ group and in five patients in the PAH– group, without any significant difference. The lowest FEV1/VC ratio was 68% in the PAH+ group and 66% in the PAH– group. The residual volume (RV) did not differ significantly between the two groups.
Lung function data
Polysomnographic data are presented in table 5. No significant difference was seen between the two groups in the apnoea index (42.6 (26.3) in the PAH+ group and 35.8 (21.7) in the PAH– group) or in the apnoea-hypopnoea index (53.4 (25) in the PAH+ group and 43.3 (22.9) in the PAH– group). Minimal oxyhaemoglobin saturation was significantly lower in the PAH+ group and the percentages of TST spent at Sao 2 <90% and <80% were significantly higher in the PAH+ group than in the PAH– group. The maximal Sao 2 at the beginning of the night was significantly lower in the PAH+ group than in the PAH– group.
Polysomnographic data
Table 6 shows the results of the significant correlations found in univariate analysis between PAPm and each of the anthropometric, lung function, and polysomnographic parameters. Significant positive correlations were observed between PAPm and body weight, BMI, % TST-Sao 2 <90%, % TST-Sao 2 <80%, and Paco 2 (fig 1). Significant negative correlations were observed between PAPm and minimal nocturnal Sao 2, maximal nocturnal Sao 2, VC, FEV1, ERV, and Pao 2 (fig 2). No correlation was found between PAPm and apnoea index or apnoea-hypopnoea index (fig3).
Significant linear correlations between mean pulmonary artery pressure and anthropometric, sleep, and respiratory parameters
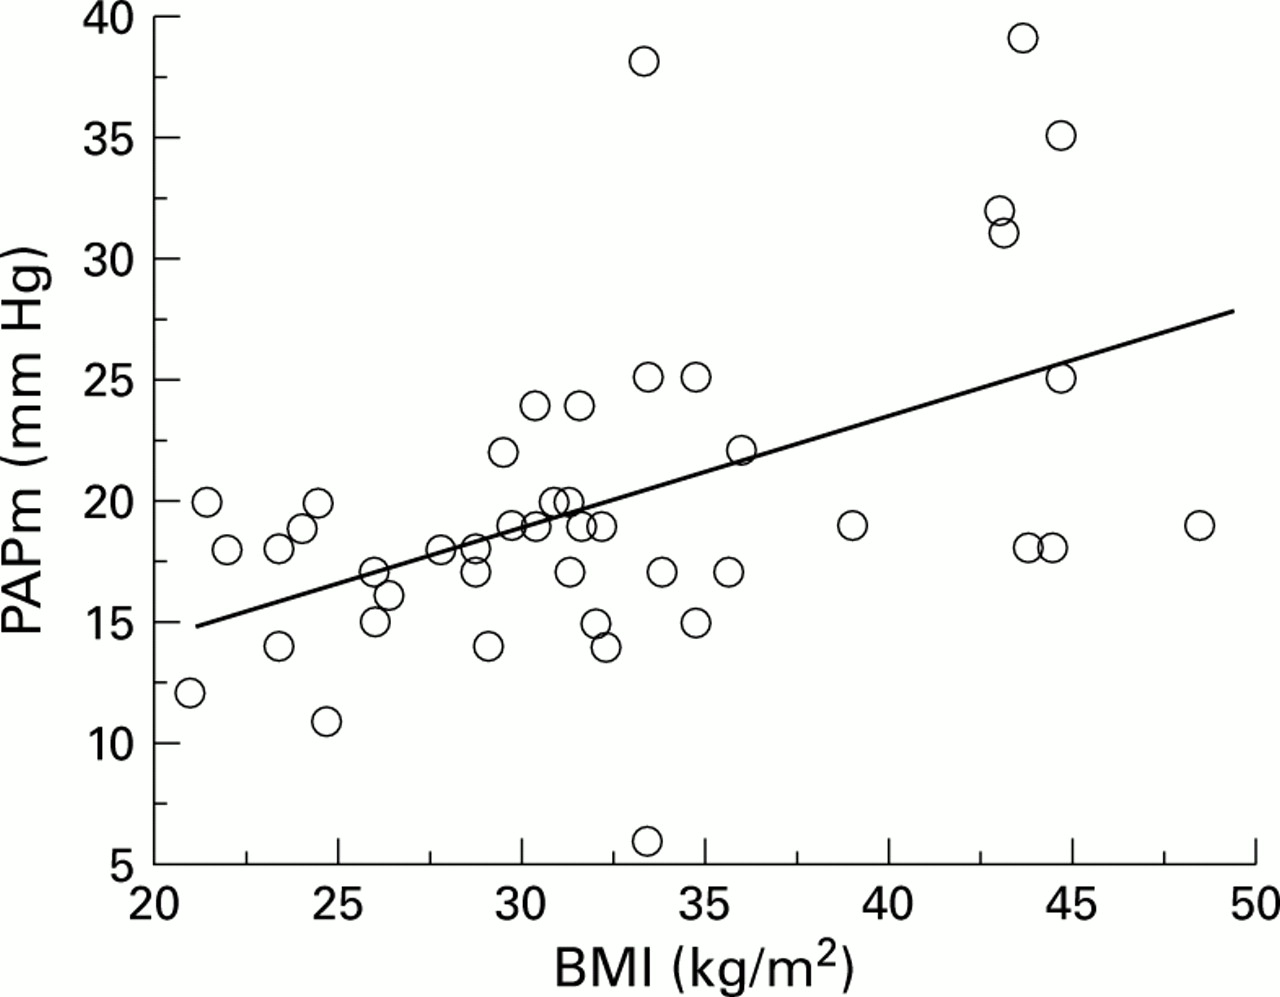
Correlation between mean pulmonary artery pressure (PAPm) and body mass index (BMI); r = 0.50, p = 0.0006.

Correlation between mean pulmonary artery pressure (PAPm) and expiratory reserve volume (ERV); r = –0.40, p = 0.007.

Absence of significant correlation between mean pulmonary artery pressure (PAPm) and apnoea-hypopnoea index (AHI).
Multivariate analysis showed that PAPm correlated positively with BMI and negatively with Pao 2 with the following correlation equations:
PAPm = 0.46 × BMI + 5.06
(r = 0.50, p = 0.0006, 95% CI of slope 0.21 to 0.71)
PAPm = –0.3 × Pao 2 + 44.81
(r = –0.55, p = 0.0002, 95% CI of slope –0.45 to –0.16)
Discussion
The results of this study show that precapillary PAH was present in 27% of a group of 44 patients without COPD presenting with severe SAS requiring nCPAP. The FEV1/VC ratio was in the normal range and did not differ between patients with or without PAH, which suggests that an obstructive ventilatory defect involving the large airways is probably not a major contributing factor in the pathogenesis of PAH. Pulmonary arterial hypertension in our patients is not explained by a moderate obstructive ventilatory defect, unlike the patients studied by Weitzenblum et al 5 and Chaouat et al 7 in whom a moderate obstructive ventilatory defect was present which may have contributed to the development of PAH.
Our patients had moderate pulmonary hypertension with PAPm of 28.5 (6.2) mm Hg which is commonly reported by other authors. According to the literature, the PAPm of patients presenting with SAS and PAH ranges between 25 and 30 mm Hg.7 ,9 ,10
The prevalence of PAH in our series was 27%, which is markedly lower than that of about 60% reported in earlier publications.4This difference is probably explained by the large number of patients with overlap syndrome in those series. Weitzenblumet al 5 found a prevalence of PAH of 20% measured by right heart catheterisation in a study of 46 patients presenting with SAS and a moderate obstructive ventilatory defect (FEV1 = 2510 (780) ml). Only Sajkovet al,6 Weberet al,10 and Sanneret al 11 excluded patients with COPD and the prevalence of PAH in their SAS patients was 41%, 10%, and 20%, respectively. The study by Weber et al 10 is only published as an abstract so details of the methodology are not available. Sajkov et al 6 measured PAP by Döppler echocardiography which is not a very reliable method for diagnosing moderate pulmonary hypertension, and Sanner et al 11 did not differentiate between precapillary and postcapillary pulmonary arterial hypertension.
Our results are more valid as PAP was measured by right heart catheterisation, precapillary PAH was confirmed by excluding increased PCP and because, unlike the other studies, subjects with other causes of precapillary PAH such as thromboembolic disease, the use of appetite suppressants, and coexisting COPD were also excluded. However, our study population is not representative of all patients with sleep apnoea as it included patients with severe SAS requiring nCPAP. Our results cannot be extended to patients with less severe SAS.
As in most studies, we did not find any link between the severity of SAS, expressed as the AI or AHI, and the presence of pulmonary hypertension.
Similar to other studies, we found the daytime Pao 2 to be significantly lower in the PAH+ than in the PAH– group. Such hypoxaemia was mostly related to associated moderate COPD in the other studies. Daytime hypoxaemia in our study was observed in the absence of even moderate COPD. Daytime hypoxaemia in our PAH+ group was moderate (9.6 (1.1) kPa) and none of our patients had a Pao 2 of <8 kPa. Daytime hypoxaemia was not sufficiently severe in our patients solely to explain the development of PAH. Thus, in patients with COPD, PAH usually develops only in those with a severe obstructive ventilatory defect (FEV1 <1000 ml) and marked daytime hypoxaemia (Pao 2 <8 kPa). The cause of daytime hypoxaemia in our patients was obviously obesity which was more severe in the PAH+ group. Moreover, all the patients with PAH and hypoxaemia were obese.
Nocturnal hypoxaemia was more severe in the PAH+ group than in the PAH– group, although the AI and AHI did not differ between the two groups. Obesity and its ventilatory consequences (decreased ERV, VC, and TLC) were significantly more severe in the PAH+ group than in the PAH– group and this presumably accounts for the more severe nocturnal desaturation observed in the former group. It has been shown that the severity of desaturation during nocturnal apnoeas correlates well with the degree of obesity14 and with the resulting changes in pulmonary function, especially the decrease in ERV.15
The lower values of maximal Sao 2 at the beginning of the night in the PAH+ group may also account for the more severe nocturnal hypoxaemia in the PAH+ group. Indeed, lying supine has been shown to result in a sharp decrease in ERV in obese patients and a worsening of ventilation-perfusion mismatch.14
The role of obesity as an aetiological factor in the pathogenesis of pulmonary hypertension in SAS has been much debated. Weitzenblumet al 5 and Kriegeret al 16 did not find any significant difference in body weight in patients with and without PAH. In two more recent studies Laks et al 9 and Chaouat et al 7 found that PAH+ patients had a higher BMI than PAH– patients. This difference was statistically significant only in the study by Chaouat et al, but the suggested predictive equation of PAP took no account of BMI.
The main mechanism of PAH in our patients is probably the greater severity of nocturnal hypoxaemia during apnoeas which induces vasoconstriction in small size pulmonary arteries, resulting in transitory peaks of PAH concomitant with apnoeas.17 The severity and duration of nocturnal desaturations probably leads to remodelling and restructuring of the walls of the pulmonary arterioles resulting in permanent daytime pulmonary hypertension. This has been demonstrated in rats submitted to intermittent hypoxia for 4–8 hours per day.18 In a necropsy study on 20 obese subjects, half of whom had presented with SAS, Ahmed et al 19 found muscularisation of arterioles with a diameter of <100 μm and moderate hypertrophy of muscle cells of the pulmonary arterial media. Our hypothesis is that more severe and prolonged nocturnal desaturation may result in remodelling of pulmonary arterial walls which ultimately leads to permanent PAH.
It has been shown that inter-individual differences in the magnitude of the pulmonary vascular response to hypoxia may account for the variable development of chronic pulmonary hypertension in subjects exposed to high altitude.20 Marked inter-subject differences in the pulmonary pressure responses have been also reported in normal subjects, in patients with COPD, and in patients with SAS.21 ,22 In a recent study Sajkov et al 23 showed that the occurrence of PAH in patients with SAS was associated with an increased pulmonary vascular response to hypoxia. One may therefore speculate that repeated increases in PAP during sleep apnoea may lead to pulmonary vascular remodelling and chronic PAH in patients with a genetically determined exaggerated pressor response to hypoxia.
This study shows that SAS may be complicated by PAH in the absence of COPD and severe daytime hypoxaemia. Our data do not support the hypothesis that sleep apnoea is an independent risk factor in the development of PAH. We have also shown that the severity of obesity and the associated changes in lung function play an important part in the pathogenesis of PAH in patients with SAS.