Article Text

Abstract
Background It has been debated, but not yet established, whether increased airway responsiveness can predict COPD. Recognising this link may help in identifying subjects at risk.
Objective We studied prospectively whether airway responsiveness is associated with the risk of developing COPD.
Methods We pooled data from two multicentre cohort studies that collected data from three time points using similar methods (European Community Respiratory Health Survey and Swiss Cohort Study on Air Pollution and Lung and Heart Diseases in Adults). We classified subjects (median age 37 years, 1st–3rd quartiles: 29–44) by their level of airway responsiveness using quintiles of methacholine dose–response slope at the first examination (1991–1994). Then, we excluded subjects with airflow obstruction at the second examination (1999–2003) and analysed incidence of COPD (postbronchodilator FEV1/FVC below the lower limit of normal) at the third examination (2010–2014) as a function of responsiveness, adjusting for sex, age, education, body mass index, history of asthma, smoking, occupational exposures and indicators of airway calibre.
Results We observed 108 new cases of COPD among 4205 subjects during a median time of 9 years. Compared with the least responsive group (incidence rate 0.6 per 1000/year), adjusted incidence rate ratios for COPD ranged from 1.79 (95% CI 0.52 to 6.13) to 8.91 (95% CI 3.67 to 21.66) for increasing airway responsiveness. Similar dose–response associations were observed between smokers and non-smokers, and stronger associations were found among subjects without a history of asthma or asthma-like symptoms.
Conclusions Our study suggests that increased airway responsiveness is an independent risk factor for COPD. Further research should clarify whether early treatment in patients with high responsiveness can slow down disease progression.
- copd epidemiology
- clinical epidemiology
- asthma
This is an open access article distributed in accordance with the Creative Commons Attribution Non Commercial (CC BY-NC 4.0) license, which permits others to distribute, remix, adapt, build upon this work non-commercially, and license their derivative works on different terms, provided the original work is properly cited and the use is non-commercial. See: http://creativecommons.org/licenses/by-nc/4.0/
Statistics from Altmetric.com
Key messages
What is the key question?
Is airway responsiveness an independent risk factor for the development of COPD in the general population?
What is the bottom line?
Young adults with high airway responsiveness are at greater risk for developing COPD in later life.
Why read on?
This study analysed COPD incidence, defined using postbronchodilator lung function data, in large population samples followed up prospectively over 20 years.
Introduction
Airway responsiveness is the ability of the airways to narrow when challenged with cold temperatures, aeroallergens or other noxious stimuli.1 2 In clinical practice, it is frequently assessed by measuring the relative decrease of FEV1 after the administration of a constrictor agent, such as methacholine.3 Measurements of airway responsiveness are useful in diagnosing asthma since most patients have an abnormal reaction to airways irritants. High responsiveness is also a common trait among patients with COPD.4 It is associated with accelerated lung function decline in smokers with early COPD,5 and it predicts disease progression, worse prognosis and mortality for COPD even among lifetime non-smokers.6 7 Nonetheless, the contribution of the presence and severity of airway responsiveness to the aetiology of COPD is still unclear.4 8 9
Recognising the direction of the association between airway responsiveness and COPD may help in better understanding the pathophysiology of the disease and eventually in identifying a clinical marker of disease risk or progression. It is accepted that, as the airway narrows, it becomes more responsive to irritants and bronchoconstrictors, and that this is at least in part due to the changing geometry of the airways. For this reason, it has long been assumed that, in subjects with COPD, airway responsiveness is a consequence of the structural and functional changes related to the disease.8 10 Later evidence suggested that high responsiveness may precede lung function decline and airflow obstruction, and that it reflects the underlying inflammatory process.8 11–14 To our knowledge, only one population-based study15 has evaluated the relationship between airway responsiveness and COPD incidence prospectively using postbronchodilator (BD) spirometry, as recommended for the diagnosis in clinical guidelines.16
In this prospective cohort study, carried out within the Ageing Lungs in European Cohorts project (https://www.alecstudy.org/), we aimed to assess whether increased airway responsiveness is a risk factor for COPD. We exploited the data collected in two large multicentre population-based studies, which share similar methods and a common longitudinal design with information collected at three time points: the European Community Respiratory Health Survey (ECRHS) and the Swiss Cohort Study on Air Pollution and Lung and Heart Diseases in Adults (SAPALDIA).
Methods
Study population
ECRHS is an international cohort study on subjects from the general population aged 20–44 years at enrolment in 1991–1993.17 At the first examination, a 20% random sample of participants in a postal screening took part in a clinical assessment. Subjects were followed up in 1999–2002 (second examination)18 and 2010–2013 (third examination) (www.ecrhs.org). SAPALDIA is a Swiss multicentre population-based cohort study. At the first examination in 1991, random samples of subjects aged 18–60 years were examined.19 Subjects were followed up in 2001–2003 (second examination)20 and 2010–2011 (third examination) (http://www.sapaldia.ch/en/). Ethical approval was obtained by all centres in both studies from the appropriate ethics committees and written consent was obtained from the participants. Only the centres that took part in all the three examinations were considered for the analyses.
Clinical measurements
At each time point, information on health and lifestyle was collected through detailed personal interviews, and pre-BD spirometry was performed. Subjects were advised to avoid using a β2-agonist or anticholinergic inhaler for 4 hours or oral medication (β2-agonist, theophylline or antimuscarinic) for 8 hours before the test. The maximum FEV1 and FVC, from at least two technically satisfactory manoeuvres, were measured according to the American Thoracic Society criteria for repeatability.21 At the third examination, post-BD lung function using 200 µg salbutamol was also measured in all the centres, except for Verona and Torino (ECRHS centres). Biomedin or SensorMedics spirometers were used in most centres at the first and second examinations, whereas NDD EasyOne was used in almost all centres at the third examination (online supplementary Table E1). In SAPALDIA, which used SensorMedics at the first and second examinations and NDD EasyOne at the third examination, lung function data corrected for change in spirometer were used.22 The lower limit of normal (LLN) for the FEV1/FVC ratio was calculated using the reference equations by Quanjer et al.23
Supplementary file 1
At the second examination, serum levels of total and specific IgE for house dust mite, cat and grass pollen were measured. Allergen sensitisation was considered present when specific IgE for at least one allergen were above 0.35 kU/L.
Airway challenge tests
Methacholine challenge tests were performed in both studies at the first and second examinations according to a similar protocol, which included standardised training for fieldworkers and monthly calibrations of the nebulisers.2 19 Briefly, subjects with an FEV1 greater than 70% of predicted and greater than 1.5 L were invited to undergo challenge tests, unless they reported they had heart disease, epilepsy, were pregnant, breast feeding or taking a beta blocker. After a control FEV1 manoeuvre following inhalation of saline diluent, methacholine chloride was administered by a Mefar aerosol dosimeter at progressing levels. FEV1 was recorded 2 min after each inhalation and, in the absence of a 20% fall in FEV1 from control value, the next dose was given up to a cumulative dose of 2 mg (8.37 µmol), except for the ECRHS centres of Barcelona, Albacete, Oviedo, Huelva (Spain), Ipswich and Norwich (UK), where the maximum dose was 1 mg.2 In order to obtain comparable indicators of responsiveness across centres, we excluded these centres from the analyses.
At each time point (first and second examinations), we derived a dose–response slope for each subject, which is called slope hereafter, following the ‘two-point’ method by O’Connor et al.24 The two-point slope was already available for SAPALDIA, and we used the same method in ECRHS for consistency. The slope was defined as the ratio between the percentage decline in FEV1 from the control value and the total cumulative dose of methacholine (% × µmol−1). As previously done in order to avoid negative slopes, the control value was replaced with the maximum FEV1 over all levels tested when control FEV1 did not correspond to maximum FEV1 25.
Design of the analysis
In the main analysis, we used the slope measured at the first examination, categorised by quintiles of the distribution as done previously,14 as the main indicator of airway responsiveness, excluded subjects with a pre-BD FEV1/FVC ratio below the LLN at the second examination and then assessed the outcomes during the time between the second and third examinations (the follow-up period) (figure 1). We adopted this design in order to minimise reverse causation (ie, airflow obstruction causing an increase in airway responsiveness) by removing, at the beginning of the follow-up period, the subjects with airflow obstruction, who may have had an early form of COPD that was still not evident at the time of challenge tests.

Number of subjects included in the analyses by study. BD, bronchodilator; EC, European Community Respiratory Health Survey; LLN, lower limit of normal; SAP, Swiss Cohort Study on Air Pollution and Lung and Heart Diseases in Adults.
Outcome definitions
The main outcome of the analysis was the incidence of COPDLLN, defined spirometrically as a post-BD FEV1/FVC <LLN at the third examination (after excluding those with a pre-BD FEV1/FVC <LLN at the second examination). Further outcomes were absolute FEV1 decline (ΔFEV1) and percent change in FEV1 relative to baseline value (ΔFEV1%) between the second and third examinations, calculated using pre-BD lung function (post-BD spirometry was not available at the second examination) as follows:
ΔFEV1 (mL/year) = (FEV1 at 2nd exam − FEV1 at 3rd exam)/time;
ΔFEV1% (%/year)=100 × [(FEV1 at 2nd exam − FEV1 at 3rd exam)/FEV1 at 2nd exam]/time.
Potential confounders
The multivariable analyses were adjusted for sex; education level (low if completed before age 16); FEV1 predicted at the time of the challenge test (to account for differential deposition of methacholine in the lungs according to the airway calibre)26; age and body mass index (BMI, calculated as weight (kg) divided by squared height (m)) at the second examination (mean centred); history of asthma/asthma-like symptoms (reporting asthma in lifetime; or reporting wheezing/whistling without a cold or having been woken by an attack of shortness of breath in the last 12 months) at the second or third examinations; history of active smoking over lifetime (coded as non-smoker at both examinations, ex-smoker at both examinations, smoker at the last examination with <28 pack-years (the median), smoker at the last examination with ≥28 pack-years, quitter); history of second-hand smoking, and occupational exposure to vapours, dust, gas or fumes at the second or third examination (both coded as never exposed, exposed only at one examination, exposed at both examinations). BMI2 at the second examination and ΔBMI (change in BMI between the second and third examination divided by time) were also included in the analysis of FEV1 decline.27
Statistical analysis
The statistical analyses were performed using STATA software, V.14.2 (StataCorp, College Station, Texas, USA). We conducted pooled analyses of the ECRHS and SAPALDIA data since the number of cases of COPDLLN was small and there was no heterogeneity between studies (which was tested using Wald tests on interaction terms between slope and study). All the pooled analyses were adjusted for study (ECRHS vs SAPALDIA). We also reported the results of the main analysis stratified by study. Incidence of COPD was analysed using Poisson regression models with log person-years at risk as the offset. Centre was considered as a clustering factor and cluster-robust standard errors were used (multilevel modelling was not feasible because of data sparseness). ΔFEV1 and ΔFEV1% were analysed through two-level linear regression models, with a random intercept for centre (which significantly improved model fitting according to likelihood ratio tests). Missing data were deleted listwise.
We assessed effect modification by history of active smoking (lifetime never smokers: n=1839 vs ever smokers: n=2216), history of asthma/asthma-like symptoms (absent: n=3223 vs present: n=969) and sex, using stratified analyses and testing interaction terms by Wald tests.
Sensitivity analyses
1. Outcomes
We analysed the incidence of:
1.1. COPDclinical, defined as a combination of a post-BD FEV1/FVC <LLN with at least one key indicator for COPD identified by the GOLD guidelines16: (a) history of symptoms (dyspnoea, chronic cough/sputum production); (b) history of smoking (≥10 pack-years) or occupational exposures; (c) family history of COPD or early life risk factors (see online supplement);
1.2. COPD0.70, defined spirometrically as a post-BD FEV1/FVC ratio <0.70 at the third examination (after excluding those with pre-BD FEV1/FVC ratio <0.70 at the second examination).15
We replicated the main analysis on COPDLLN:
2. Airway responsiveness
2.1. Analysing the mean slope between the first and second examinations;
2.2. Analysing the ‘least-squares’ slope at the first examination, available for ECRHS2 (see online supplement).
3. Medication
3.1. Excluding the subjects who had used inhalers in the 12 hours before any examination (41 in ECRHS and 42 in SAPALDIA);
3.2. Further adjusting for current use of inhaled/oral medication for asthma at the first examination (inhalers, aerosols or tablets for asthma) in the analysis on subjects with asthma/asthma-like symptoms.
4. Adjustment variables
4.1. Adjusting for measured FEV1 (which replaced predicted FEV1 as an indicator of airway calibre);
4.2. Further adjusting, in separate models, for second-hand smoking in childhood, serious respiratory infections before the age of 5 (early-life risk factors for COPD), high total serum IgE (>100 kU/L) and allergen sensitisation (indicators of atopy).
Results
Overall, data on subjects from 25 centres in 10 countries were available. Among 14 089 subjects who had the slope available at the first examination (median age 37; 1st, 3rd quartiles (Q1, Q3): 29, 44 years), 10 825 subjects participated in the second examination (figure 1). Participants had an older median age (38 vs 34 years, P<0.001), were more likely to be women (49.4 vs 46.4%, P=0.002) and less likely to be a current smoker (32.4 vs 41.7%, P<0.001) and to have asthma (7.2 vs 8.7%, P=0.004). Of these, 2326 were excluded because they had no lung function data, and 733 subjects (median slope 1.88, Q1–Q3: 1.11–5.78) were excluded because they had airflow obstruction (pre-BD FEV1/FVC ratio <LLN) at the second examination.
Of the remaining 7766 eligible subjects, 5756 (74%) took part in the third examination, and 4716 had lung function measured and were included in the analysis of FEV1 decline (figure 1). The median follow-up time was 9 (Q1, Q3: 8, 11) years. The slope distribution was similar between ECRHS and SAPALDIA: medians (Q1–Q3) were 0.9 (0.5–1.7) and 0.9 (0.5–1.5)% × µmol−1, respectively (P=0.27). At the second examination, subjects from ECRHS (n=2042) and SAPALDIA (n=2674) had a median age of 44 (Q1, Q3: 37, 49) years and 50 (Q1, Q3: 41, 58) years, respectively. Compared with the subjects excluded from the analysis, the subjects included were younger and were less likely to have a low education, be a current smoker, report occupational exposures and have asthma (table 1).
Characteristics of the subjects excluded and included in the analyses*
Airway responsiveness and FEV1 decline
FEV1 at baseline ranged between 3.77 L and 3.22 L for subjects with the lowest to the highest airway responsiveness, respectively (P<0.001) (table 2). ΔFEV1 did not vary as a function of the slope (P=0.20), whereas the mean ΔFEV1% ranged from 1.04 to 1.17 %/year (P<0.001), indicating an accelerated FEV1 decline for increasing responsiveness relative to the baseline value, but not in absolute terms. The adjusted analyses showed consistent results (online supplementary table E2).
Mean absolute FEV1 (at the second examination), mean lung function decline and incidence rates of COPD (between the second and third examinations) for increasing airway responsiveness, with 95% CIs, adjusted only for study
Airway responsiveness and COPD
After excluding the centres where post-BD spirometry was not carried out (Verona and Torino), 4205 subjects were included in the analysis of the incidence of COPDLLN (figure 1). The mean±SD BD response was 88±128 mL for FEV1 and −3±172 for FVC. Incident cases of COPDLLN at the third examination were 108 (49 in ECRHS and 59 in SAPALDIA).
The analyses showed clear dose–response associations between airway responsiveness and the risk of developing COPDLLN. The incidence rates ranged between 0.6 and 5.3 per 1000/year for increasing levels of responsiveness (P<0.001) (table 2). With respect to the least responsive group, incidence rate ratios (IRRs) adjusted for the potential confounders ranged from 1.79 (95% CI 0.52 to 6.13) to 8.91 (95% CI 3.67 to 21.66) for increasing responsiveness (figure 2). There was no heterogeneity of associations between studies (P interaction 0.27) (online supplementary table E3).

Incidence rate ratios (IRRs) with 95% CIs for the association between increasing airway responsiveness and the development of COPDLLN (Airway responsiveness according to the slope at the first examination, with slope <0.44% × µmol−1 as the reference category. Adjusted for study, sex, education, FEV1 predicted, age, body mass index, history of asthma/asthma-like symptoms, history of active smoking, second-hand smoking and occupational exposures to vapours, gas, dusts or fumes. Number of subjects: 3747. The y-axis is on log2 scale).
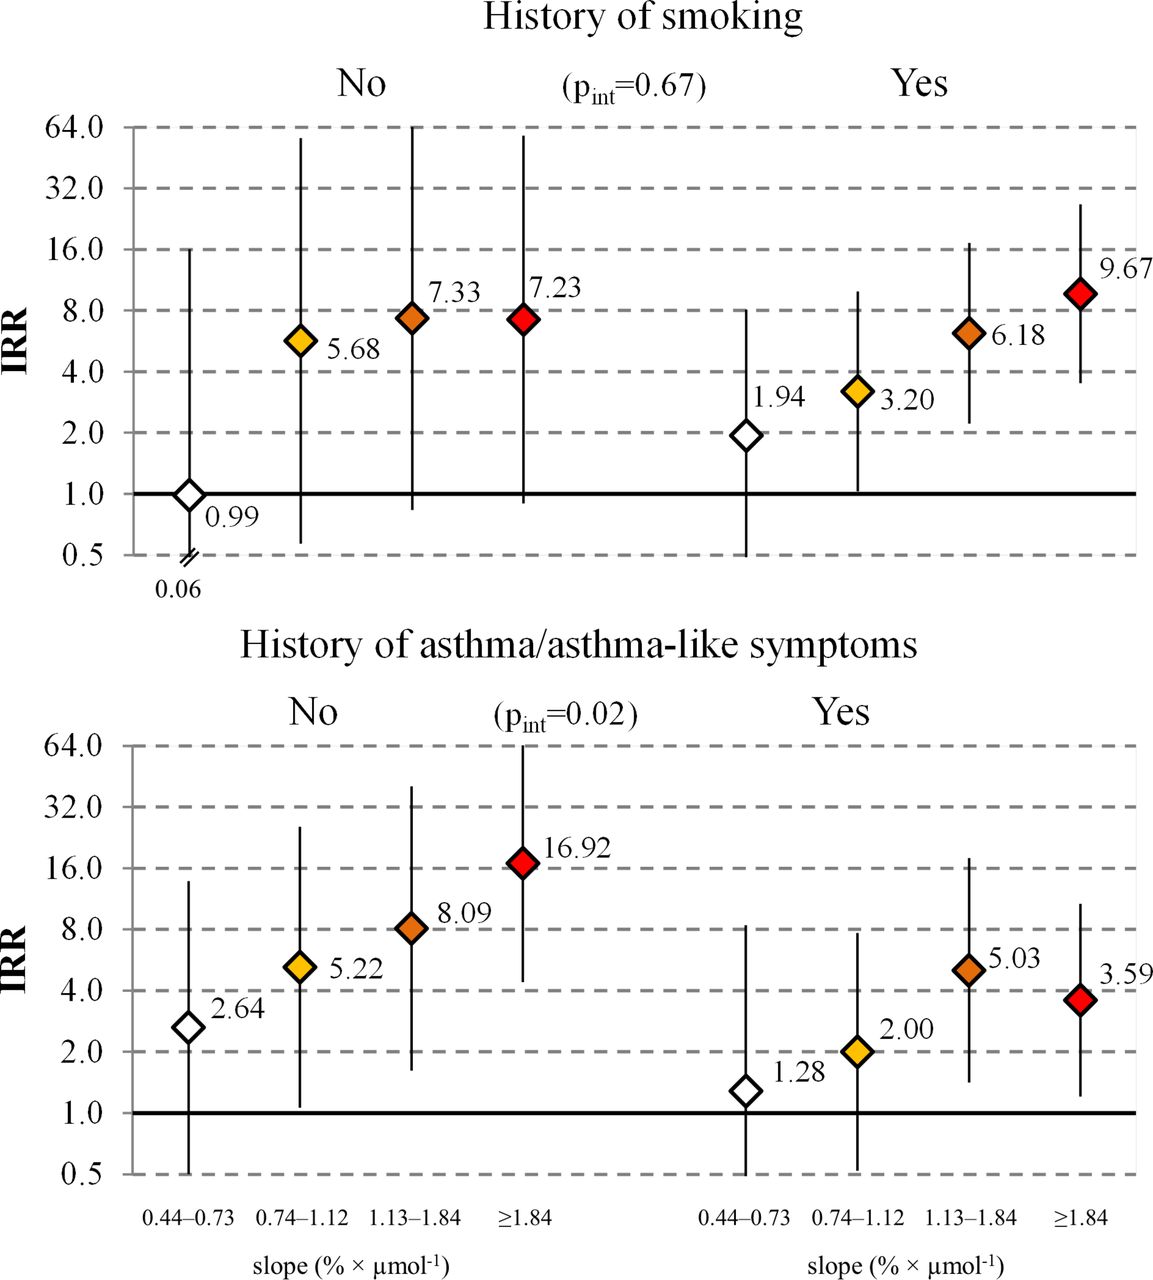
We found no significant interaction between history of smoking and airway responsiveness on COPDLLN (P for interaction 0.67). Subjects without and with asthma/asthma-like symptoms had a median slope of 0.9 (Q1–Q3: 0.5–1.4) and 1.2 (Q1–Q3: 0.7–2.7)% × µmol−1, respectively (P<0.001). Associations between slope and COPDLLN risk were stronger among the former compared with the latter groups (P for interaction 0.02) (figure 3). IRRs were similar for men and women (P for interaction 0.84).
Incidence rate ratios (IRRs) with 95% CIs for the association between increasing airway responsiveness and the development of COPDLLN, stratified by history of smoking (top panels), and history of asthma/asthma-like symptoms (bottom panels) (Airway responsiveness according to the slope at the first examination, with slope <0.44% × µmol-1 as the reference category. Adjusted for study, sex, education, FEV1 predicted, age, body mass index, second-hand smoking and occupational exposures to vapours, gas, dusts or fumes. Also adjusted for history of asthma/asthma-like symptoms, history of active smoking (when these are not used for stratification) and for lifetime pack-years (only analysis on smokers, top right panel; data on pack-years not available for 133 subjects). Number of subjects: never smokers, 1670; smokers, 1944; without asthma/asthma-like symptoms, 2890; with asthma/asthma-like symptoms, 852. Pint is the P value for the interaction between slope group and stratification variable. The y-axis is on log2 scale).
All the sensitivity analyses confirmed a dose–response relationship between airway responsiveness and COPD risk. Association estimates for COPDclinical and COPD0.70 (incident cases: 93 and 242, respectively) are reported in table 3. Results from the analyses using alternative indicators of responsiveness are shown in online supplementary table E4. When adjusting for measured FEV1, IRRs for COPDLLN ranged from 1.42 (95% CI 0.45 to 4.44) for subjects with a slope at the first examination of 0.44–0.73% × µmol−1, to 5.77 (95% CI 2.95 to 11.26) for subjects with a slope ≥1.84% × µmol−1. Use of asthma medication at the first examination was more frequent for subjects with slope ≥1.84% × µmol−1 (10%) compared with the other groups (between 1% and 2%). Associations were consistent when further adjusting for use of asthma medication (online supplementary table E5) and when using alternative sets of adjustment variables (data not shown).
Incidence rate ratios (IRRs) with 95% CIs for the association between increasing airway responsiveness and the development of COPD: sensitivity analyses on the outcome definition*
Discussion
We analysed data from two multicentre population-based cohort studies with similar designs and study protocols. The analyses showed that higher airway responsiveness measured during young adult life was prospectively associated with an increased risk of COPD 20 years later.
Compared with previous literature,11 14 28 29 our study adds stronger prospective evidence that increased responsiveness can precede the development of COPD. In fact, we derived indicators of responsiveness in young adulthood (1991–1994), excluded subjects who had airflow obstruction a decade after (1999–2003) and then assessed the outcomes during the last available follow-up period (up to 2010–2013). This design makes it less likely that an early, slowly progressing or undetected form of COPD can be the main explanation for high responsiveness observed at the first examination. COPD was defined using post-BD spirometry, and similar conclusions were obtained when using the LLN cut-off for the FEV1/FVC ratio, as advocated by the European Respiratory Society,30 or when using the fixed cut-off of 0.70, as recommended by clinical guidelines.16 Also, conclusions were similar when using a definition of COPD that combined post-BD airflow obstruction with key indicators for diagnosis in clinical practice.16 A strength of this study is the use of continuous indicators of airway responsiveness. Unlike the PD20 or similar censored indicators, the slope can be derived for all individuals, entailing the concept of responsiveness as a continuous trait, and it is able to recognise lower levels of responsiveness.14
The slope at the first examination was prospectively associated both with a lower lung function (pre-BD spirometry) at the second examination and with a higher incidence of COPD (post-BD spirometry) at the third examination, suggesting that a high responsiveness is associated with increased bronchospasm and also with the development of fixed obstruction.31 Subjects with a higher slope did not have a steeper absolute FEV1 decline (mL/year) compared with less responsive individuals, suggesting that an impairment in lung function must have occurred earlier in these individuals, possibly due to lower attained lung function, an early loss at young ages or both.4 32–34
Some previous studies using pre-BD spirometry reported that smoking may modify the association of airway responsiveness with lung function decline28 and COPD risk.11 In our study, associations were not significantly different for smokers compared with non-smokers. Since we had a low number of COPD cases, our analysis may have been underpowered to test effect modification (indeed we were only able to test interactions using a binary indicator of smoking that did not take pack-years into account). It is also possible that other factors, such as reduced participation among smokers, can explain the lack of a significant interaction, or that findings from previous studies were due to the lack of post-BD lung function measurements. Regardless of the existence of a ‘true’ interaction between smoking and responsiveness, it is reasonable to think that (since smoking is a modifiable risk factor that adds to the baseline risk in subjects with a high responsiveness) smokers with high responsiveness may particularly benefit from smoking cessation advice.
A higher responsiveness at the first examination was a risk factor for COPD both in subjects who reported asthma and in subjects who reported neither asthma nor asthma-like symptoms (which may have indicated undiagnosed asthma) for the 20 years following challenge testing. A different strength of the associations between the two groups (P for interaction 0.02) may be related to a different pathophysiological role of airway responsiveness. In subjects with asthma, responsiveness may be an indicator of asthma activity, severity of inflammation and airway remodelling. In subjects without asthma, responsiveness may affect the risk of COPD through pathways that are unrelated (not mediated) by the development of asthma.
One limitation of our study is that different types of spirometers were used at different time points. This may have introduced some bias if any systematic measurement error was differential across slope groups. However, we found consistent associations in the analysis restricted to SAPALDIA, where lung function measurements were corrected for change in spirometer.22 Due to the challenges of following up individuals over 20 years, our study had substantial attrition, especially among smokers and subjects with asthma. Selection bias can especially distort estimates of disease frequency; however, it is less likely to strongly bias association estimates.35 We used pre-BD lung function to exclude prevalent cases of COPD, which seems adequate for epidemiological purposes as only one out of 100 subjects without pre-BD obstruction has COPD (negative predictive value of 99%).36 Finally, we used the two-point slope because it is easier to interpret compared with the least-squares slope, which was developed in ECRHS to account for systematic differences in the dose delivered by different Mefar nebulizers, and could be more suitable in multicentre settings.1 2 Nonetheless, the results were consistent when using the least-squares slope.
Conclusions
Our study suggests that increased airway responsiveness precedes and is an independent risk factor for COPD. An increased risk of COPD was also evident for intermediate levels of the slope corresponding to a moderate responsiveness. In clinical practice, it would be desirable to intervene in the early stages of COPD before the level of airflow obstruction contraindicates airway challenge tests. Our findings suggest that measuring airway responsiveness could help in identifying subjects at risk for COPD, and they prompt further research on whether early treatment of patients with high responsiveness can slow down disease progression.37
References
Footnotes
Contributors AM and SA conceived the study. AM designed the study and drafted the analysis plan and the first version of the manuscript. FL and AM performed the statistical analysis. All the authors contributed in the collection of data in/from the original studies, discussion of the statistical analysis plan and interpretation of study results. All the authors critically reviewed and approved the final version of the manuscript. The corresponding author had full access to all the data and had final responsibility for the decision to submit for publication.
Funding The ALEC Study is funded by the European Union’s Horizon 2020 Research and Innovation programme under grant agreement no. 633212. ISGlobal is a member of the CERCA Programme, Generalitat de Catalunya. The SAPALDIA cohort has been funded since 1991 primarily by the Swiss National Science Foundation (grants no 33CS30-148470/1&2, 33CSCO-134276/1, 33CSCO-108796, 324730_135673, 3247BO-104283, 3247BO-104288, 3247BO-104284, 3247-065896, 3100-059302, 3200-052720, 3200-042532, 4026-028099, PMPDP3_129021/1, PMPDP3_141671/1). Other national funders who supported data collection in the original studies are listed in the supplement.
Disclaimer The funders had no role in the writing of the manuscript or the decision to submit it for publication.
Competing interests DJ has received support from the European Union, the Medical Research Council and Asthma UK. Other authors have no competing interests to declare.
Patient consent Obtained.
Provenance and peer review Not commissioned; externally peer reviewed.
Collaborators The Ageing Lungs in European Cohorts (ALEC) study: The study leader is Deborah Jarvis. The manuscript was done under ALEC Workpackage 4 led by Judith Garcia-Aymerich. Other Workpackage leaders in ALEC are Cecilie Svanes, John Henderson (Department of Community Based Medicine, University of Bristol, Bristol, UK), Nicole Probst-Hensch and Cosetta Minelli (National Heart and Lung Institute, Imperial College London, London, UK). The principal investigators and team members of the original studies are reported in the supplement. The ALEC International Scientific Advisory Board is Marike Boezen (University Medical Center Groningen, University of Groningen, Groningen, The Netherlands), Bernice Elger (Institute for Biomedical Ethics, University of Basel, Basel, Switzerland), Bo Alexander Gleditsch (The Norwegian Asthma and Allergy Association, Norway), Bas Heijmans (Department of Medical Statistics and Bioinformatics, Leiden University Medical Center, Leiden, The Netherlands), Isabelle Romieu (National Institute of Public Health, Cuernavaca, Mexico; and Emory University, Atlanta, GA, USA) and John Thompson (Department of Health Sciences, University of Leicester, Leicester, UK).