Article Text

Abstract
Background: The forced oscillation technique (FOT) requires minimal patient cooperation and is feasible in preschool children. Few data exist on respiratory function changes measured using FOT following inhaled bronchodilators (BD) in healthy young children, limiting the clinical applications of BD testing in this age group. A study was undertaken to determine the most appropriate method of quantifying BD responses using FOT in healthy young children and those with common respiratory conditions including cystic fibrosis, neonatal chronic lung disease and asthma and/or current wheeze.
Methods: A pseudorandom FOT signal (4–48 Hz) was used to examine respiratory resistance and reactance at 6, 8 and 10 Hz; 3–5 acceptable measurements were made before and 15 min after the administration of salbutamol. The post-BD response was expressed in absolute and relative (percentage of baseline) terms.
Results: Significant BD responses were seen in all groups. Absolute changes in BD responses were related to baseline lung function within each group. Relative changes in BD responses were less dependent on baseline lung function and were independent of height in healthy children. Those with neonatal chronic lung disease showed a strong baseline dependence in their responses. The BD response in children with cystic fibrosis, asthma or wheeze (based on both group mean data and number of responders) was not greater than in healthy children.
Conclusions: The BD response assessed by the FOT in preschool children should be expressed as a relative change to account for the effect of baseline lung function. The limits for a positive BD response of −40% and 65% for respiratory resistance and reactance, respectively, are recommended.
- BD, bronchodilator
- CF, cystic fibrosis
- FOT, forced oscillation technique
- nCLD, neonatal chronic lung disease
- Rrs, respiratory resistance
- Xrs, respiratory reactance
- Zrs, respiratory input impedance
Statistics from Altmetric.com
- BD, bronchodilator
- CF, cystic fibrosis
- FOT, forced oscillation technique
- nCLD, neonatal chronic lung disease
- Rrs, respiratory resistance
- Xrs, respiratory reactance
- Zrs, respiratory input impedance
The forced oscillation technique (FOT) is increasingly used in preschool children to measure respiratory function owing to its low requirement for patient cooperation and ease of measurement.1 The technique allows measurement of the respiratory input impedance (Zrs) under tidal breathing conditions. From this, resistance (Rrs) and reactance (Xrs) of the respiratory system can be obtained as a function of frequency. Response in respiratory function to a bronchodilator (BD) is routinely used as part of the clinical assessment of children with lung disease, but little information exists on the BD response in preschool children with lung disease compared with healthy children as quantified by FOT variables.
Other lung function methods have been used to assess BD responses in children of this age group, both with and without lung disease, with mixed results. Spirometric parameters such as the forced expiratory volume in 1 s are variably dependent on airway diameter and compliance, both of which are potentially altered by BD inhalation but have opposite effects on maximal flow.2 The interrupter technique3–7 has been shown to underestimate resistance, particularly in children with high baseline resistance.8 Specific airway resistance obtained by whole body plethysmography9,10 has also been used in this age group.
There are a number of FOT studies using impulse oscillometry9,11,12 but, because of the constraints of the technique, Rrs and Xrs are only reported at multiples of 5 Hz, thus missing out on information from other frequencies. Studies in patients with cystic fibrosis (CF) have been made using pseudorandom FOT which have no such frequency constraints, but unfortunately they had no healthy group for comparison.2 Children of school age with neonatal chronic lung disease (nCLD) have been assessed using both impulse oscillometry13 and pseudorandom FOT,14 but preschool children were not included and the assessment did not include their BD response. Mazurek and colleagues15 used the head generator technique to perform pseudorandom FOT on patients with asthma and CF, but only reported Rrs and Xrs data from 10 and 20 Hz whereas Delacourt and coworkers8 used the extrapolated parameter R0 as an outcome variable. More recent studies assessing BD responses using FOT in healthy children and children with asthma9,11,16 and in those with asthma only17,18 have used impulse oscillometry.
The aim of this study was to characterise the BD response as assessed by pseudorandom FOT in healthy preschool children, and to compare this with children from different disease groups: CF, nCLD, and asthma and/or wheeze. The analysis was performed retrospectively from data collected as part of other ongoing studies. Using our findings, we aim to determine how BD responses in FOT parameters should be expressed and what constitutes a significant BD response.
METHODS
Subjects
Healthy children were defined as those with no history of asthma or wheeze ever and who had not been diagnosed with CF or nCLD. They were studied at a time when they were well and had had no respiratory infections in the 2 weeks before the date of study. As part of a separate study, they also underwent skin prick testing to locally relevant aeroallergens (house dust mite, cat, grass mix, mould mix) and their parents answered a questionnaire which yielded information on respiratory history and environmental tobacco smoke exposure. Atopy was defined as a positive skin prick test to one or more allergens where a positive result was determined by a weal diameter of at least 3 mm after 15 min.
Children with CF and nCLD were measured as part of clinical follow-up programmes at the Princess Margaret Hospital for Children. Children with CF were identified through neonatal screening or from clinical criteria and confirmed by sweat electrolyte analysis. Children with nCLD were those who required use of supplemental oxygen for more than 28 days at 36 weeks postmenstrual age for infants with gestational age at birth of <32 weeks and the use of supplemental oxygen at 28 days of life for individuals with gestational age at birth of ⩾32 weeks.19 Current wheeze was defined by the occurrence of episodes of wheezing in the past 12 months. Children with asthma were those with current wheeze who also had a doctor diagnosis of asthma.
Measurements were made in children when neither a long-acting BD had been administered for at least 24 h nor a short-acting BD for at least 4 h before the testing session.
Forced oscillation technique
The FOT methods used in this study have been previously described and validated.20 Respiratory impedance spectra (Zrs), yielding Rrs and Xrs as a function of frequency, were obtained using commercially available equipment (I2M, Chess Medical, Belgium) based on the specifications of Lándsér and co-workers,21 in accordance with European Respiratory Society guidelines.1 The forced oscillatory signal was a pseudorandom signal consisting of frequency components between 4 and 48 Hz with a measurement period of 8 s.
Protocol
During measurement the child was seated comfortably upright with the neck in the neutral position and the arms resting comfortably by the side. The child’s cheeks were supported by an investigator. Measurements were made with the child wearing a nose clip during quiet breathing through a mouthpiece and filter (Suregard, BirdHealthcare, Australia).
Three to five technically acceptable measurements were obtained at baseline. Individual measurements were considered technically unacceptable if coherence was <0.95 at three or more frequencies or if Zrs showed obvious artifacts.
Salbutamol (600 μg) was administered via a pressurised metered dose inhaler (Ventolin, GlaxoSmithKline) and spacer device (Volumatic, GlaxoSmithKline). Respiratory function measurements were repeated (as above) 15 min after BD inhalation. All protocols used in this study were approved by the ethics committee at the Princess Margaret Hospital for Children and parental consent was obtained.
Data analysis
All technically acceptable Zrs measurements were averaged and mean Rrs and Xrs at 6, 8, and 10 Hz (Rrs6, Rrs8, Rrs10, Xrs6, Xrs8 and Xrs10) were calculated. Both absolute and relative BD responses were studied, where the relative BD response was the absolute BD response expressed as a percentage of baseline respiratory function.
With the BD response assessed by each FOT variable as the outcome, multiple linear regression analysis was performed, stratified by disease group, to determine the individual effects of the following factors on absolute and relative BD responses within each group: age, sex, height, weight, baseline lung function. These covariates were then also adjusted for in a multiple linear regression model used to compare the BD response in each disease group with the healthy group. All statistical analyses were performed at α = 0.95 using customised software (Intercooled Stata 8.1 for Windows, Stata Corporation, Texas, USA). Significance was defined as p<0.05.
RESULTS
Baseline and BD responses
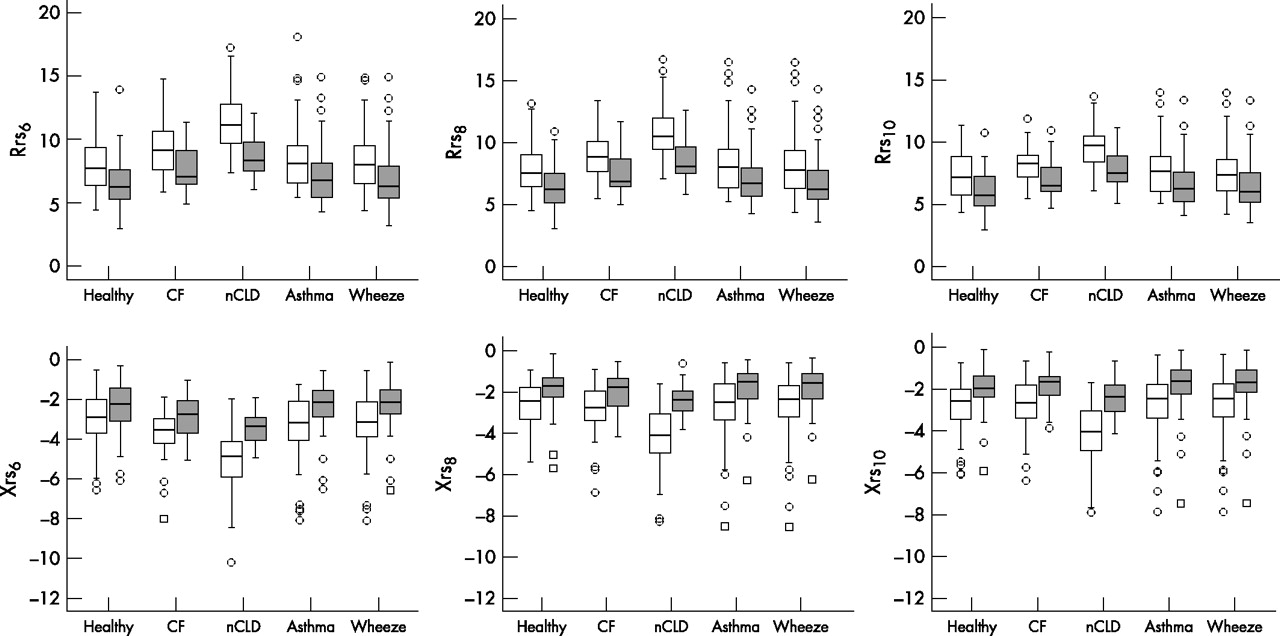
Anthropometric data and baseline respiratory function are shown in table 1. Children with nCLD were shorter and lighter than other children, most likely explaining the higher resistance and lower reactance at all frequencies compared with healthy children. Children with CF also had higher resistance (all frequencies) and lower reactance (at 6 Hz) (table 1). There were no differences in baseline respiratory function between the children with asthma or wheeze and the healthy children (table 1). In all groups, post-BD lung function significantly improved compared with baseline, that is, the resistance parameters decreased while the reactance parameters increased (fig 1, p<0.05 for all variables, Wilcoxon signed rank test).
Anthropometric data and baseline lung function of study subjects

Pre- and post-bronchodilator responses in all groups measured by resistance (Rrs) and reactance (Xrs) at 6, 8 and 10 Hz. Open circles and squares indicate outliers and extreme values, respectively. Post-bronchodilator responses (shaded boxplots) were significantly different from pre-bronchodilator responses (clear boxplots) for all parameters in all groups (p<0.05, Wilcoxon signed rank test). CF, cystic fibrosis; nCLD, neonatal chronic lung disease.
Approximately one-third (24/78) of the healthy group were atopic and 17.9% (14/78) had been exposed to tobacco smoke. Neither atopy nor passive smoke exposure influenced baseline lung function, absolute or relative BD responses measured by any of the FOT variables (p>0.05 for all tests, Mann-Whitney test).
Dependence of BD responses on anthropometric factors and baseline lung function
Stratified for disease group, the absolute response measured by all FOT variables was found to be strongly dependent on baseline lung function (p<0.001). The absolute response was not dependent on any of the other factors in any of the groups studied, with the exception of Rrs6 vs age in the healthy group (coefficient = −0.058, p = 0.017), Xrs6 vs age and sex in the CF group (regression slope coefficient = −0.046, p = 0.010 and coefficient = 0.520, p = 0.039, respectively), Xrs8 vs weight in the nCLD group (coefficient = −0.150, p = 0.027), and Xrs10 vs height in the wheeze group (coefficient = 0.072, p = 0.026). Scatter graphs for Rrs8 and Xrs8 plotted against baseline (fig 2) were representative of the relationships between FOT variables and baseline in general.

Absolute bronchodilator response plotted against baseline for resistance (Rrs) and reactance (Xrs) at 8 Hz. Different symbols indicate different groups (circles, healthy; squares, cystic fibrosis; up triangles, neonatal chronic lung disease; down triangles (solid), asthma; down triangles (open), wheeze only.
Stratified for disease group, the relative response measured by all FOT variables was less significantly dependent on baseline lung function (significant p values ranging from <0.001 to 0.45), with no relationship between baseline and Rrs8, Rrs10 or Xrs6 in the healthy group and Rrs10 in the CF group. In addition, Xrs6 vs age in the CF group (coefficient = −1.14, p = 0.036), Xrs8 vs weight in the nCLD group (coefficient = 4.11, p = 0.020) and Xrs10 in the wheeze group (coefficient = 2.67, p = 0.018) were found to be significant.
Comparison of relative BD responses between healthy and disease groups
Results from comparisons between healthy and disease groups, adjusted for age, sex, height, weight and baseline, were similar for the absolute (table 2) and relative (table 3) BD responses. For the sake of simplicity, only the relative responses are described here.
Absolute bronchodilator responses
Relative (% baseline) bronchodilator responses
As a group, children with CF tended to have smaller relative BD responses than healthy children. Adjusted for covariates, Rrs8 and Rrs10 were found to be significantly different from the healthy group (adjusted p = 0.031 and 0.021, respectively). There were no significant differences in relative BD assessed by any of the FOT parameters between children with CF who did (53%) or did not have (47%) respiratory symptoms (parental reported cough, cold or sputum production or clinician reported wheeze, crackles or respiratory tract infection) at the time of the study.
Children with nCLD as a group tended to have larger relative BD responses than healthy children, with a weakly significant difference in Rrs8 and Rrs10 from the healthy group (adjusted p = 0.045 and 0.042, respectively). In this group, baseline remained a significant covariate in the multiple linear regression model for all FOT variables.
Children with a doctor diagnosis of asthma showed significant differences from the healthy group in BD responses assessed by Rrs6, Rrs8 and Rrs10 (adjusted p = 0.008, 0.004 and 0.002, respectively) but not by any of the Xrs variables. Similar results with weaker significance were seen in children with wheeze (adjusted p = 0.049, 0.010 and 0.004, respectively for Rrs6, Rrs8 and Rrs10). In this group, Rrs responses tended to be smaller than in healthy children while Xrs responses tended to be larger, although again the latter were not significant.
Significant relative BD response
The characteristics of the healthy group were used to determine what constitutes a significant BD response. As the BD response was significantly dependent on baseline lung function, these analyses were only undertaken using relative BD responses. To the nearest percentage change, the limits of agreement for relative BD responses in the healthy group were set to be −42%, −37% and −39% for Rrs6, Rrs8 and Rrs10, respectively (taken from the 5th percentiles), and 61%, 67% and 63% for Xrs6, Xrs8, and Xrs10, respectively (taken from the 95th percentiles).
Using these criteria, the number of subjects who responded significantly to BD (ie, who had a response greater than these limits) was counted within each of the disease groups (table 4). While the number of responders in each disease group did not differ significantly in comparison with the healthy group (p>0.05, Fisher exact test), the reactance parameters tended to yield more responders than the resistance parameters.
Number of subjects in each group showing a significant relative bronchodilator response as determined by the limits of the healthy group for resistance (Rrs) and reactance (Xrs) at 6, 8 and 10 Hz
DISCUSSION
The results of this study show that the magnitude of the change in lung function following BD inhalation measured with pseudorandom FOT in preschool children is strongly related to baseline lung function. This is true for healthy children and those with lung disease. Reporting BD responses relative to baseline lung function (ie, as a percentage of baseline) accounts for this effect to some extent.
Characterisation of BD responses
The magnitude of the BD responses presented in this study at 6 and 10 Hz (−21% for Rrs6, 27% for Xrs6, −19% for Rrs10 and 29% for Xrs10) compare well with data measured using impulse oscillometry at 5 and 10 Hz by Malmberg and coworkers (−19.2% for Rrs5 and −19% for Rrs10).12 They also reported a change of 0.64 and 0.60 hPa.s/l for Xrs5 and Xrs10, respectively (relative changes not provided), similar to the 0.57 and 0.73 hPa.s/l for Xrs6 and Xrs10, respectively, seen in our study. In contrast, Hellinckx and colleagues11 (−13% for Rrs5 and 15% for Xrs5) and Nielsen and Bisgaard9 (−10% for Rrs5 and 14% for Xrs5) both reported smaller changes in lung function following BD inhalation. There was a large spread of BD responses in our groups, as was the case in the other previously published studies.
Our finding that the BD response as assessed by FOT parameters at 6, 8 and 10 Hz is related to its corresponding value at baseline is consistent with that of Hellinckx and coworkers11 who also found a correlation between absolute BD response and baseline lung function in total Rrs and Xrs.16,22,23
While baseline lung function is generally known to be dependent on height, we found that the BD response as measured by FOT variables was height-independent (with the exception of Xrs10 in wheeze), irrespective of whether it is expressed as an absolute or a relative response.
The children were generally studied at times when they were clinically stable and asymptomatic. One reason for including children from the various disease groups was to determine whether the underlying disease increased the short-term variability of FOT. In general, our data show that the criteria for determining the BD response in healthy children are also valid for children with CF, nCLD, asthma and current wheeze. There is a suggestion from our data that FOT parameters at 6 Hz (specifically Xrs6) may be the most appropriate for expressing the BD response in preschool children. Reactance has been shown to be a more sensitive indicator of airway obstruction.22,23 It is plausible that this applies to reversibility of airway obstruction as well.
Based on the results from our healthy group, the criteria for defining a significant BD response are similar for both Rrs and Xrs at 6, 8 and 10 Hz (table 4). A fall in Rrs of 40% and an increase in Xrs of 65% appear to be suitable criteria for defining a BD response. Our data do show that the 6 Hz data point was more often unavailable due to low coherence (55/252, 21.8%) than either the 8 Hz (40/252, 15.9%) or the 10 Hz (39/252, 15.5%) data point. Thus, Rrs8 and Xrs8 may offer the best balance between sensitivity and reliability for assessing BD responses in preschool children. The BD criteria proposed here are similar to those previous suggested in studies using impulse oscillometry. Hellinckx and coworkers11 set the cut-off for Rrs5 at −41%. Similarly, Malmberg and coworkers12 proposed −37% and −34% as cut-off points for Rrs5 and Rrs10, respectively. Nielsen and Bisgaard9 found the 5th percentile for BD response in Rrs5 to be much lower at −28%. The corresponding cut-off point for Xrs5 was −42%.
Cystic fibrosis
As a group, the children with CF in this study did not exhibit a greater BD response in resistance and showed no difference in the BD response in reactance compared with healthy children. We also found that there were no significant differences in the number of responders between health and CF, irrespective of symptomatic status. This compares well with a longitudinal study by Nielsen and coworkers10 in which no differences in BD responsiveness were found between healthy children and children with CF as measured by specific airway resistance. The authors also looked at impulse oscillometry and found Xrs5 to yield a statistically significant greater BD response in CF but dismissed this as a type I error. Note that when using the Z-score for Xrs5 as a criterion, the authors found 20% of children with CF exhibited a positive BD response on their first visit and 16% on their second visit. However, none of the FOT results were expressed as relative changes (the FOT results were expressed as an absolute change in Z-score), so any effects of baseline magnitude were not adjusted for. In another study Hellinckx and coworkers2 looked at Rrs6 and determined that 13 of 20 patients with CF had a favourable response to BD but used a cut-off of −12% obtained from the within-subject variability of the CF group itself, which was much smaller than the limits of the BD response used in this study.
Neonatal chronic lung disease
To our knowledge, no FOT data on the BD response in preschool children with nCLD have been published. Our data show that, even when expressed as a percentage of the higher baseline values, BD responses in nCLD tend to be larger than those in healthy children and still showed a significant dependence on baseline respiratory function. Baseline was found to be a particularly strong covariate in this disease group, and was also largely responsible for any apparent differences in the BD response. This is perhaps not surprising given the difference in height and weight between the children with nCLD and the healthy group. In effect, we conclude that there were no differences in BD response between the healthy children and those with nCLD in our study. A previous study24 found that children of school age with nCLD had significantly higher BD responsiveness than controls, as assessed using spirometry. We are unaware of equivalent studies in preschool children to enable us to compare any differences that may be revealed between spirometry and FOT.
Asthma/wheeze
On grouped data, the BD response assessed by the Rrs variables was not larger in the asthma or wheeze groups than in healthy children and, in fact, tended to be smaller when adjusted for covariates. There were no significant differences in the BD response assessed by the Xrs variables. Hellinckx and co-workers11 found no differences in BD responses at Rrs5 and Rrs10 between healthy children and children with stable asthma who had normal baseline lung function. When considered as individuals, more children with wheeze in our study had a BD response outside the limits of the healthy group when this response was assessed using Xrs6. Only 11 of the 66 children in the wheeze group did not have persistent wheeze (defined in this case by wheeze before the past 12 months in addition to within the past 12 months), indicating that these children probably had asthma despite a lack of diagnosis from a doctor. However, all children were asymptomatic at the time of the lung function studies. The absence of differences in baseline lung function and in BD responses between these children and the healthy group is therefore not surprising. One study using the interrupter technique has shown increased BD responses in wheezy preschool children compared with past wheezers,25 but this study involved children who had had a recent exacerbation and were likely to have more severe asthma than the children in our asthma group. Another interrupter study found a great degree of overlap between healthy preschool children and those with asthma, although the dosage used was much lower than that used in our study.6 There is also a possibility that the higher dosage used in our study, which is normally used for BD testing in our laboratory, contributed to the differences in these and other previous studies. Furthermore, it should be pointed out that some of the children in our asthma or wheeze group would have been on inhaled corticosteroids. Characterisations of the BD response in symptomatic and asymptomatic asthma, or in children from whom inhaled corticosteroids are withheld, are beyond the scope of the present study.
In summary, the data from the present study show that the magnitude of the BD responses in preschool children measured using pseudorandom FOT is strongly influenced by baseline lung function. Changes in lung function should therefore be reported as a percentage of baseline to alleviate this effect. The best balance between responsiveness and reliability appears to be provided by Rrs8 and Xrs8. A fall in Rrs of 40% or an increase in Xrs of 65% are indicative of significant changes in respiratory function following BD inhalation. Further systematic studies are required to determine the clinical significance of post-BD changes in lung function in preschool children with lung disease.
REFERENCES
Footnotes
-
Published Online First 13 March 2007
-
This work is supported by grants from the National Health and Medical Research Committee, Australia, the National Institutes of Health, USA and the Asthma Foundation of Western Australia. KU was supported by a grant from the Siriraj Hospital, Thailand.
-
Competing interests: None.
Linked Articles
- Airwaves