Article Text

Abstract
Aims: To assess any relationship between the levels of ambient air pollutants and hospital admissions for chronic obstructive pulmonary disease (COPD) in Hong Kong.
Methods: A retrospective ecological study was undertaken. Data of daily emergency hospital admissions to 15 major hospitals in Hong Kong for COPD and indices of air pollutants (sulphur dioxide (SO2), nitrogen dioxide (NO2), ozone (O3), particulates with an aerodynamic diameter of <10 μm (PM10) and 2.5 μm (PM2.5)) and meteorological variables from January 2000 to December 2004 were obtained from several government departments. Analysis was performed using generalised additive models with Poisson distribution, adjusted for the effects of time trend, season, other cyclical factors, temperature and humidity. Autocorrelation and overdispersion were corrected.
Results: Significant associations were found between hospital admissions for COPD with all five air pollutants. Relative risks for admission for every 10 μg/m3 increase in SO2, NO2, O3, PM10 and PM2.5 were 1.007, 1.026, 1.034, 1.024 and 1.031, respectively, at a lag day ranging from lag 0 to cumulative lag 0–5. In a multipollutant model, O3, SO2 and PM2.5 were significantly associated with increased admissions for COPD. SO2, NO2 and O3 had a greater effect on COPD admissions in the cold season (December to March) than during the warm season.
Conclusion: Ambient concentrations of air pollutants have an adverse effect on hospital admissions for COPD in Hong Kong, especially during the winter season. This might be due to indoor exposure to outdoor pollution through open windows as central heating is not required in the mild winter. Measures to improve air quality are urgently needed.
- APHEA2, Air Pollution and Health: A European Approach 2
- COPD, chronic obstructive pulmonary disease
- NMMAPS, National Morbidity, Mortality, and Air Pollution Study
- NO2, nitrogen dioxide
- O3, ozone
- PM10, particulates with an aerodynamic diameter <10 μm
- PM2.5, particulates with an aerodynamic diameter <2.5 μm
- SARS, severe acute respiratory syndrome
- SO2, sulphur dioxide
Statistics from Altmetric.com
- APHEA2, Air Pollution and Health: A European Approach 2
- COPD, chronic obstructive pulmonary disease
- NMMAPS, National Morbidity, Mortality, and Air Pollution Study
- NO2, nitrogen dioxide
- O3, ozone
- PM10, particulates with an aerodynamic diameter <10 μm
- PM2.5, particulates with an aerodynamic diameter <2.5 μm
- SARS, severe acute respiratory syndrome
- SO2, sulphur dioxide
Air pollution is a major public health problem resulting from emissions of air pollutants from both motor vehicles and industrial plants. Previous studies have shown that air pollution is associated with excessive respiratory and cardiovascular morbidity1–8 as well as mortality.9–13
Hong Kong is a small but densely populated city. The total population was 6.88 million in mid 2004 with a population density of 6380 people per km2.14 Over the past 10 years the air quality in Hong Kong has worsened substantially. The concentrations of particulates with an aerodynamic diameter <10 μm (PM10) and ozone (O3) recorded at the general air monitoring stations in Hong Kong increased by 15% and 26%, respectively, from 1999 to 2004.15 The level of nitrogen dioxide (NO2) also increased by 26% between 1991 and 2002.16 Because of the increase in particulate pollution, impairment in visibility in Hong Kong has also worsened over time. The percentage of time in a year with visibility <8 km (with relative humidity ⩽80%) increased from 4% in 1991 to 18% in 2004.15 The major source of air pollutants in Hong Kong is air pollutant emissions from road traffic.5 In addition, with increased industrialisation in the southern part of China, pollutants generated by motor vehicles, power plants and various industries in the Pearl River Delta region also contributed to the increasing air pollution in Hong Kong.16
Chronic obstructive pulmonary disease (COPD) is an important disease worldwide and acute exacerbations are associated with significant morbidity such as hospitalisations and mortality.17 COPD was the fifth leading cause of death in Hong Kong and accounted for at least 4% of all public hospital acute admissions in 2003. Previous studies have shown that pulmonary function and quality of life are adversely affected by frequent exacerbations, particularly in active smokers.18,19 A study conducted in Hong Kong a decade ago showed that air pollution was associated with a significantly increased risk of hospitalisation for patients with respiratory diseases including acute exacerbations of COPD.5 With increasing air pollution, the effect of air pollutants on acute exacerbations of COPD may be enhanced.
As over 90% of the citizens of Hong Kong are dependent on the public hospital healthcare resources, data on COPD admissions can be retrieved from the central computer system of the Hospital Authority Head Office (HAHO). We assessed the effect of air pollutants—including NO2, sulphur dioxide (SO2), O3, PM10 and particulates with an aerodynamic diameter <2.5 μm (PM2.5)—over a period of 5 years (from January 2000 to December 2004) on emergency admission rates of COPD. Data were collected from 15 major hospitals and 14 air quality monitoring stations in Hong Kong over the same period.
METHODS
This is a retrospective ecological study. Data on emergency hospital admissions for COPD to 15 major hospitals from January 2000 to December 2005 inclusive were obtained from the HAHO in Hong Kong. The daily number of hospital admissions with the codes 491, 492 and 496, based on the Ninth Revision of the International Classification of Diseases (ICD-9)20 as the primary diagnosis, was recorded.
Air quality and weather data
Hourly concentrations of NO2, SO2, O3, PM10 and PM2.5 between January 2000 and December 2004 were obtained from the Environmental Protection Department.21 The 14 air quality monitoring stations were located in eight districts interspersed in different districts throughout Hong Kong. All the monitoring stations measured levels of NO2, SO2, O3 and PM10. However, PM2.5 was measured by three stations only. SO2 was measured by ultraviolet florescence, NO2 by chemiluminescence and O3 by ultraviolet absorption. Both PM10 and PM2.5 were measured by the tapered element oscillating microbalance method. The 24 h mean concentrations of NO2, SO2, PM10 and PM2.5 were calculated. Since the formation of O3 is dependent on sunlight, a daytime (09:00 to 17:00 h) mean concentration was used for analysis. The mean daily temperatures and relative humidity for the same period were obtained from the Hong Kong Observatory.
Statistical modelling
The statistical model developed from the Air Pollution and Health: A European Approach 2 (APHEA2) protocol for the time series analyses of mortality and hospital admissions in Europe22 was used in this study. A generalised additive model23 using a Poisson distribution with log-link function was used to construct a core model. This regressed the daily numbers of COPD admissions on the time variable (day), day of the week variable, daily mean temperature and humidity, and holiday indicator. Smoothing of the time variable was used to control for the long-term seasonal patterns of COPD visits and smoothing splines were used as smoothers. The quasi-likelihood method was used to correct for overdispersion. Each core model was chosen based on the degree of freedom that gave the minimum Akaike’s information criterion (AIC) value.24 Autocorrelation was adjusted by adding autoregressive terms to the model. After controlling for the confounding effects of seasonality, days of the week and climatic variables, daily concentrations of PM10, NO2, SO2, O3 and PM2.5 were added to the core model to determine the relative risk (RR) of COPD admissions for a 10 μg/m3 increase in each of these air pollutants. Concentrations of all the air pollutants for the same day (lag 0) up to lag days (lag 5) and cumulative lags by 2 (average of lag 0 and 1), 3 (average of lag 0, 1 and 2) to 6 days (average of lag 0–5) were tested in each model. The lag day with the air pollutant concentration that yielded the largest χ2 value obtained from the change in deviances23 was chosen.
Multipollutant models were run for air pollutants that were significant in the single pollutant analysis, and the lag with the strongest univariate effect was tested. The correlation coefficients of the individual air pollutants were examined and only those with r<0.7 were entered into the model. Pairwise analyses were performed by entering each pollutant, cold season indicator and their interaction term into the core model. December to March was considered to be the cold season in Hong Kong with a mean daily temperature below 20°C.5 The standard errors of the estimates were computed using the supplementary program used in the re-analysis of the National Morbidity, Mortality, and Air Pollution Study (NMMAPS).25 All calculations were performed with the software S-plus 4.0 using a more stringent convergence criteria in the gam(.) function to prevent the convergence problem.26
RESULTS
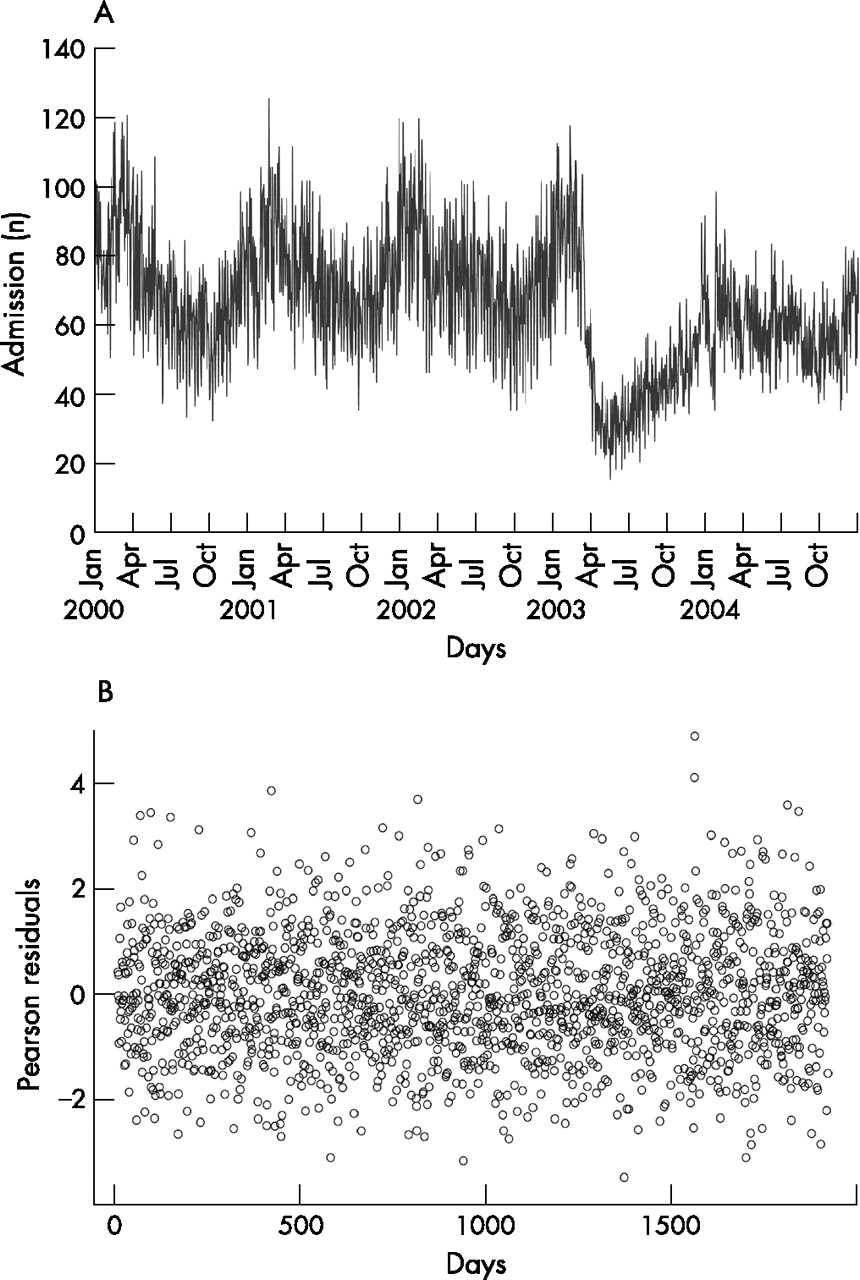
There were 119 225 admissions for acute exacerbations of COPD from January 2000 to December 2004 with mean (SD) annual and daily admissions of 23 845 (3645) and 65.3 (18.9), respectively. Figure 1 shows a plot of daily admissions over the 5 year period with the Pearson residuals. The seasonal or long-term pattern was not apparent in the residuals.

(A) Number of daily admissions for chronic obstructive pulmonary disease (COPD) from January 2000 to December 2004. (B) Time plot of Pearson residuals of daily admissions for respiratory diseases based on the core model.
The means, standard deviations, ranges and percentiles of the daily counts of hospital admissions, daily levels of NO2, SO2, PM10 and PM2.5 and the levels of O3 from 09:00 to 17:00 h are shown in table 1. Correlations of the pollutants are shown in table 2; a close correlation was found between PM10 and PM2.5 (r = 0.95, p<0.001).
Daily summary of the number of COPD admissions, meteorological and pollutant data
Correlations between different air pollutants and meteorological variables
There was a statistically significant association between hospital admissions for acute exacerbations of COPD and an increase in 10 μg/m3 of all five pollutants (NO2, PM10, O3, SO2 and PM2.5; table 3). A lag effect (cumulative from day 0 to ⩾2 days) was found for all the pollutants assessed except SO2. The strongest effect on COPD admissions observed for SO2 (RR 1.007, 95% CI 1.001 to 1.014) was on lag 0 (ie, no lag days), whereas for NO2 (RR 1.026, 95% CI 1.022 to 1.031) it was on cumulative lag days 0–3 as indicated by the greatest χ2 score (“best” lag). A more delayed effect on COPD admission was observed for O3 (RR 1.034, 95% CI 1.030 to 1.040), PM10 (RR 1.024, 95% CI 1.021 to 1.028) and PM2.5 (RR 1.031, 95% CI 1.026 to 1.036), with the “best” cumulative lag days of 0–5. The overdispersion parameter (φ) and the autocorrelation coefficients were 1.295 and −0.02163, respectively. The intercorrelation between the coefficients (β) of the pollutants in the multipollutant model, based on the covariance matrix,25 ranged from −0.4161 to 0.2005.
Relative risk (with 95% CI) for the pollutants per 10 μg/m3 increase in the concentration of air pollutants for hospitalisations due to an acute exacerbation of COPD (single pollutant model)
We noted a sharp fall in the number of daily admissions in April 2003, which was probably due to the major outbreak of severe acute respiratory syndrome (SARS) in Hong Kong at that time.27,28 As a sensitivity analysis, we constructed separate models for hospital admissions in 2000–2002, 2003 and 2004 by analysing the data before, during and after the SARS epidemic in 2003. The RRs before 2003 were lower than those after 2003 for NO2, O3, PM10 and PM2.5, but the results were largely similar to those when the entire period was used for the model (data available in supplemental table 1 available online at www.thorax.bmj.com/supplemental).
The multipollutant model was constructed and the results are shown in table 4. SO2, O3 and PM2.5 were statistically most significantly related to COPD admissions. Of all the pollutants, O3 had the highest χ2 score, indicating that it contributed to the greatest risk of admission for COPD (RR 1.029, 95% CI 1.022 to 1.036). There was only moderate correlation (r<0.5) between most air pollutants, except for the correlations between NO2 and SO2 (r = 0.66) and between PM2.5 and PM10 (r>0.9). Since PM2.5 is widely believed to be more damaging to health and has a higher RR for admission to hospital with an acute exacerbation of COPD than PM10, the former was selected into the statistical model instead.
Relative risk (with 95% CI) for the pollutants per 10 μg/m3 increase in the concentration of air pollutants for hospitalisations due to an acute exacerbation of COPD (multipollutant model)
There was also a seasonal effect on the air pollutants. Using 20°C as the cut-off temperature, a lower temperature was associated with a higher level of mean daily PM10, PM2.5 and NO2 but a lower level of mean 8 h O3. In addition, the mean number of daily admissions was higher with a lower temperature (74.5 vs 61.9, p<0.0001). The interaction between seasons and individual pollutants is shown in table 5. An additive effect of the cold weather on the pollutants was observed on COPD admissions for NO2, O3 and SO2 (RR 1.016 (95% CI 1.009 to 1.024), 1.020 (95% CI 1.008 to 1.031) and 1.0201 (95% CI 1.008 to 1.033), respectively).
Interaction between season and individual pollutants
DISCUSSION
This study assessed the effects of air pollution specifically on hospital admissions for acute exacerbations of COPD. All five air pollutants (NO2, SO2, O3, PM10 and PM2.5) had a positive association with hospital admissions for acute exacerbations of COPD, with different magnitudes in terms of the relative risks and the number of lag days. Previous time series studies in Asia did not focus on COPD alone but on admissions for all respiratory diseases or all-cause mortality.5,10,11,29 As the time frame chosen in this study was recent and for an extended duration (from January 2000 to December 2004), this study provides up to date information on the effects of air pollutants specifically on COPD.
The total number of hospital admissions in this single-city study was high (n = 119 225) when compared with other US national multi-city studies; for example, a US multi-city study by Medina-Ramon et al included a total of 578 006 admissions.2 As there was a sharp decline in the number of daily admissions in April 2003 which was most probably caused by the major outbreak of SARS,27,28 we constructed separate models to analyse hospital admissions and air pollution data for the periods before, during and after the SARS epidemic in 2003. Although the RRs before 2003 were lower than those after 2003 for NO2, O3, PM10 and PM2.5, the results were similar to those when the entire period was used for the model. Not only has this confirmed the robustness of the general additive model in correcting for the potential effects caused by an epidemic that might affect the number of hospital admissions, it has shown that the relationship between air pollution and COPD admissions was not affected by an event that reduced hospital admissions but not air pollution.
The concentrations of PM10 and PM2.5 in Hong Kong were high in 2000–4 compared with other western countries. The mean (SD) level of PM10 was 50.1 (23.9) μg/m3 in the current study, compared with a level of 30.4 (5.1) μg/m3 in a study involving 36 American cities2 in 1986–99. Our median level of PM10 (44.5 μg/m3) was also higher than those in several European studies (median levels for Stockholm, Birmingham, London and Netherlands 13.6, 21.5, 24.9 and 33.4 μg/m3, respectively). For PM2.5, the median (IQR) level in this current study was 31.7 (19.4–46.7) μg/m3, which was much higher than the level of 13.4 (11.3–15.2) μg/m3 in a national US study.1 Our study had comparable levels of SO2, O3 and NO2 to those in western European cities such as Rome.7
We found that a 10 μg/m3 increase in PM10 was associated with a 2.4% increase in hospital admissions for acute exacerbations of COPD at cumulative lag days of 0–5. The effect of PM10 on respiratory admissions appeared to be less than in other studies. For example, in the NMMAPS, which focused on the 20 largest metropolitan areas in the USA in 1987–94, every 10 μg/m3 increase in PM10 level was associated with an increase in hospital admissions for COPD of 1.5% (range 1.0–1.9%).30–32 The NMMAPS statistical model is overspecified with regard to long-wave controlling variables for season and weather placed in the model (along with the pollution) relative to the more generally accepted methods published in the literature.25,33,34 This has apparently led to smaller estimates of pollution effects in publications deriving from the NMMAPS study, and the difference in estimates can be up to twofold.34 Indeed, we have found that, by applying the more aggressive adjustment NMMAPS model, the effects of PM10, NO2, O3 and PM2.5 on COPD admissions were of smaller magnitudes than the APHEA2 statistical model. Our observations of underestimation of pollution effects with the NMMAPS model were similar to the those reported by Schwartz et al33 and Ito et al.34 The APHEA2 study, which assessed hospital admissions in eight European cities in the mid 1990s, found an increase of 1.0% (range 0.4–1.5%) per 10 μg/m3 increase in PM10 level in asthma and COPD admissions among people aged >65 years. However, COPD was not assessed separately in the APHEA2 study.6 Our results showed that the effect of PM10 on hospital admissions with COPD was similar to that reported in the NMMAPS study,30–32 based on the same method of analysis. The effect of PM10 on combined COPD and asthma hospitalisations in Europe in the APHEA2 study6 was of lesser magnitude than in our study.
The high PM2.5 level in our study was associated with a higher impact on COPD admissions than in other studies. A 10 μg/m3 increase in PM2.5 was associated with a 3.1% increase in COPD admissions with a cumulative lag of 0–5 in our study using the APHEA2 statistical model, in contrast to a recent US study using the NMMAPS statistical model which found the largest effect per 10 μg/m3 increase in PM2.5 occurring at lag 0 and 1 with a risk of about 0.9%.1 Analysis of our data using the NMMAPS model has shown that each 10 μg/m3 increase in PM2.5 was associated with a 2.0% increase in COPD admissions, and the effect of PM2.5 was higher than that reported by Dominici et al.1 The higher impact of the PM2.5 level on respiratory admissions as noted in our study may be due to a higher level of PM2.5 in our community and a dose-response effect of the pollutants on respiratory morbidity. The effect of particulate matter on respiratory morbidity remains a focus of research. The leading hypothesis emphasised inflammatory responses in the lungs and release of cytokines with local and systemic consequences. Particulate matters may promote inflammation, thereby exacerbating underlying lung diseases and reducing the efficacy of lung defence mechanisms.12,35
Despite several previous reports from Hong Kong on increasing air pollution,15,16 the average values detected by the air quality monitoring stations for NO2, SO2, O3 and PM10 did not differ significantly from a previous study conducted by Wong et al5 in Hong Kong in 1994–5 on the effect of air pollutants on all respiratory admissions. In fact, the effect of individual pollutants on COPD in our study was similar to that in the study by Wong et al.5 However, the cumulative effect of NO2, SO2 and PM10 was assessed only for up to 4 days (lag 0–3) by Wong et al, whereas we have extended the cumulative lag to 6 days (lag 0–5) for all the pollutants. We noted the most statistically significant effect of PM10 on COPD admissions was at lag 0–5, in contrast to lag 0–3 in the study by Wong et al.5 Concerning the use of cumulative lags in analysing the effects of pollutants on admissions for COPD, the RRs derived from two different averaging period variables must be interpreted with caution. For example, it requires a longer duration of exposure to effect a change of 1 μg/m3 in a 5 day average (ie, a 1 μg/m3 increase on 5 consecutive days) than for a 1 day average increase of 1 μg/m3 (ie, a 1 day increase of 1 μg/m3 on a single day only). Our study has provided additional information on the effect of PM2.5 on COPD admissions which was not addressed in the previous study.5 Furthermore, a multipollutant model specific for acute exacerbations of COPD was not constructed in the study by Wong et al.5 In our study, when a number of pollutants (NO2, SO2, O3 and PM2.5) were analysed together, all except NO2 were retained in the model. As expected, the RRs of the individual pollutants were smaller than those in the single pollutant models, with O3 having the greatest effect on COPD admissions.
We found differences in the maximum effect of the individual air pollutants on COPD hospitalisations in terms of the number of cumulative lag days. Despite the use of the “best” lag calculated according to statistical criteria, these differences could possibly be explained by the chemical and toxicological properties of the individual pollutants on the airway. SO2 is very soluble in the upper respiratory tract5 and thus may produce an immediate irritant effect on the respiratory mucosa which would account for the fact that no lag days were observed for SO2. In contrast, O3 and NO2 are much less soluble, enabling them to penetrate deeply into the lungs. In addition, these two gaseous pollutants and PM10 are highly reactive oxidants and can cause inflammation of the respiratory epithelium at high concentrations.36–38 An experimental chamber exposure study reported a decrease in lung function after exposure to O3.39 On the other hand, exposure to NO2 might enhance the recruitment of macrophages and T lymphocytes to the airway, as shown by increased CD45RO+ lymphocytes, B cells and natural killer (NK) cells in the bronchoalveolar lavage fluid of healthy volunteers.40 As oxidant-induced airway inflammation takes time to develop, this may account for some cumulative lag days with O3, NO2 and PM10 rather than an immediate effect on admissions for acute exacerbations of COPD.
In contrast to this current study, previous studies found an increased risk of admissions for respiratory diseases, including COPD and pneumonia, associated with ambient O3 and PM10 levels predominantly in the warm season.2,41,42 A previous study in the US suggested that the difference in the positive effect of O3 on respiratory admissions in different seasons might be due to higher O3 concentrations and more time spent outdoors during the warm season. Since O3 is a highly reactive gas, its indoor concentration is extremely low in buildings with closed windows.2 In Hong Kong the situation differs from western countries as the winter season is not cold enough to require central heating in most places. Windows are often opened in winter for ventilation purposes. Summers are generally hot and humid, and most people spend more time indoors with air conditioning. This might explain the enhanced effects of O3 exposure—and probably SO2 and NO2 exposure—in patients with COPD in the winter in HK. This is supported by a previous study showing that air conditioned homes had lower air exchange rates than homes with windows opened for ventilation.43 The reason for the seasonal differences observed in our current study compared with other western studies is not entirely clear and requires further study.
This study has a few limitations. As with other ecological studies, it was limited by the fact that precise exposure to a specific pollutant could not be assessed. Also, the ICD coding for identifying COPD hospital admissions might be limited by the accuracy of coding. In addition, the interaction between pollutants with the collinearity issues and limitations of the time series design made it difficult to assess which particular pollutant had a direct adverse effect on the patients.
In summary, air pollutant levels of SO2, NO2, O3, PM10 and PM2.5 were all associated with increased hospital admissions for acute exacerbations of COPD in Hong Kong. O3 was the most important air pollutant leading to increased hospitalisations for acute exacerbations of COPD, and PM10 and PM2.5 levels in Hong Kong were higher than in other countries. The PM10 concentration exceeded the European Union recommendation (average 24 h concentration <40 μg/m3 by 2005).32 Public health measures are urgently needed to improve air quality in Hong Kong.
Acknowledgments
The authors thank the Environmental Protection Society of Hong Kong for providing the air pollutant data and Mrs Edwina Shung of the Hospital Authority for advice on using health service data.
REFERENCES
Footnotes
-
Published Online First 20 February 2007
-
Funding: None.
-
Competing interests: None.
Linked Articles
- Airwaves