Article Text

Abstract
Background: Airway wall remodelling and inflammation are features of chronic asthma. Transforming growth factor β (TGF-β) has been implicated in these processes.
Aim: To determine the effect of allergen challenge on airway inflammation and remodelling and whether TGF-β isoforms and the Smad signalling pathways are involved.
Methods: Thirteen patients with atopic asthma underwent inhalational challenge with 0.9% saline, followed by allergen 3–4 weeks later. After both challenges, fibreoptic bronchoscopy was undertaken to obtain bronchial biopsies and tissue samples were processed for immunohistochemistry and examined by microscopy.
Results: Forced expiratory volume in 1 s (FEV1) fell after allergen challenge (mean (SE) −28.1 (0.9)% at 30 min with a late response at 7 hours (−23.0 (1.2)%). Allergen challenge caused an increase in neutrophils and eosinophils in the bronchial mucosa compared with saline. Sub-basement membrane (SBM) thickness did not change after allergen, but tenascin deposition in SBM was increased. Intranuclear (activated) Smad 2/3 and Smad 4 detected by immunohistochemistry were increased after allergen challenge in epithelial and subepithelial cells of bronchial biopsies. No inhibitory Smad (Smad 7) protein was detected. TGF-β isoforms 1, 2 and 3 were expressed predominantly in bronchial epithelium after saline and allergen challenges, but only TGF-β2 expression was increased after allergen. Double immunostaining showed an increase in TGF-β2 positive eosinophils and neutrophils but not in TGF-β1 positive eosinophils and neutrophils after allergen challenge.
Conclusions: TGF-β2 may contribute to the remodelling changes in allergic asthma following single allergen exposure.
- FEV1, forced expiratory volume in 1 s
- MBP, major basic protein
- NE, neutrophil elastase
- SBM, sub-basement membrane
- TGF-β, transforming growth factor-β
Statistics from Altmetric.com
- FEV1, forced expiratory volume in 1 s
- MBP, major basic protein
- NE, neutrophil elastase
- SBM, sub-basement membrane
- TGF-β, transforming growth factor-β
Airway wall remodelling in asthma comprises structural changes within the airways, including an increase in sub-basement membrane (SBM) thickening, collagen deposition, smooth muscle hypertrophy/hyperplasia, angiogenesis and mucous gland hypertrophy.1 These features have been correlated with an increased loss of lung function in patients with asthma2 and with the development of progressive fixed airflow obstruction in some patients with asthma.3
Although airway wall remodelling is now considered a characteristic feature of chronic asthma in adults, there is also evidence that remodelling can start at an early stage of the disease in children with asthma4,5 and may occur rapidly after an acute allergic response. An increase in the number of activated submucosal myofibroblasts has been reported within 24 h after allergen challenge of patients with mild asthma.6 An increase in the number of submucosal fibroblasts characterised by collagen synthesis and in tenascin deposition within the SBM may also occur in response to acute allergen challenge in patients with atopic asthma.7 These studies indicate that airway wall remodelling is a dynamic process that may result from repeated incremental activation of the epithelial-mesenchymal-trophic unit as a result of repeated allergen exposures.8
The mechanisms by which these rapid initial events in airway wall remodelling and inflammation are regulated have not been elucidated. Transforming growth factor β (TGF-β) is an important fibrogenic and immunomodulatory factor that can function either as a pro-inflammatory or as an anti-inflammatory cytokine,9 so it may be involved in airway wall remodelling of asthma. TGF-β protein is expressed by inflammatory cells such as neutrophils and eosinophils, and also by structural cells such as epithelial cells, fibroblasts and smooth muscle cells.10,11 TGF-β blockade with an anti-pan TGF-β antibody decreased the development of airway remodelling in a murine model of repeated allergen challenge.12
The TGF-β signalling pathway involves the phosphorylation of downstream Smad proteins, comprising the receptor-regulated Smad (R-Smad, such as Smad 2, 3), the co-mediator Smad (Co-Smad or Smad 4) and the inhibitory Smad (I-Smad, such as Smad 7). Activated Smad complexes translocate to the nucleus to upregulate the transcription of many target genes.13 Upregulation of R-Smad and Co-Smad has been found in the lungs of sensitised ovalbumin-exposed mice, indicating that the Smad-mediated signalling may be important in the pathophysiology of allergic pulmonary diseases.14 TGF-β can upregulate the production of extracellular matrix proteins, tenascin and fibronectin from lung fibroblasts,15 and the production of connective tissue growth factor from airway smooth muscle cells.16,17 Three different TGF-β isoforms (β1, β2, and β3) have been described, although TGF-β1 has been the most extensively studied. High levels of TGF-β1 and β2 have been found in bronchoalveolar lavage fluid from patients with asthma following segmental allergen challenge.18 Of the TGF-β isoforms, only TGF-β2 was found to be increased in airway biopsies of patients with severe asthma compared with subjects with mild asthma; this increase was mainly localised to eosinophils.19
In the present study, we examined the short-term effect of an acute allergen challenge on the inflammatory and remodelling airway features in mild asthma. We hypothesised that features of airway wall remodelling may be induced within 24 h of an acute allergen exposure and that the expression and activation of TGF-β could be important in the pathogenesis of these changes.
METHODS
Patient population
Thirteen non-smokers (six men) with mild atopic asthma aged 34.7 (2.4) years and forced expiratory volume in 1 s (FEV1) 92 (2.8)% of predicted were recruited from our outpatient clinic or by advertisement. All subjects had a history of mild allergic asthma together with documented bronchial hyper-responsiveness (concentration of methacholine provoking a fall in FEV1 of 20% or more (PC20) <8 mg/ml). None of the subjects had used inhaled or systemic corticosteroids. The protocol was approved by the local ethics committee of the Royal Brompton and Harefield NHS Trust and National Heart and Lung Institute, London, UK. Informed consent was obtained from all subjects.
Skin prick testing
Atopy was defined by a positive skin reaction (weal diameter >3 mm above the negative control response) to extracts of Dermatophagoides pteronyssinus, cat fur and mixed grass pollen (Aquagen; ALK, Reading, UK). The extract producing the largest weal was used for allergen challenge.
Saline and allergen challenges
Patients stopped using short-acting β2 agonists for at least 8 h before the challenges. A challenge with 0.9% NaCl (saline) was first performed, followed 1 month later by a challenge with allergen between 08:00 and 10:00 hours. Challenges were performed by inhalation of five breaths of solution from a breath-activated dosimeter (Model MB3, Mefar, Bovezzo, Italy). Each solution was administered from a hand-held nebuliser attached to the breath-activated dosimeter with a delivery time of 1 s per breath (aerodynamic mass median diameter 3.5 μm; output 9 μl/breath). FEV1 was recorded using a dry wedge spirometer (Vitalograph, Buckingham, UK) and the highest value was taken as the post-saline value. One month later an allergen challenge was performed. Fresh dilutions of freeze-dried allergen extract (Aquagen SQ) were made up with 0.9% saline from a stock solution of 10 0000 U/ml. After baseline and post-saline FEV1 measurements, starting with an allergen concentration of 250 U/ml, five breaths of serially increasing concentrations of allergen were inhaled from a hand-held nebuliser. The challenge was terminated when a fall of >15% in FEV1 from the post-saline value was observed. After the allergen challenge, FEV1 was measured also at 20, 30, 45, and 60 min and thereafter in duplicate at 30 min intervals up to 10 h. A late asthmatic response was defined as a fall in FEV1 of >15% from the post-saline value on at least three occasions between 4 and 10 h.
Fibreoptic bronchoscopy
Fibreoptic bronchoscopy was performed 24 h after each challenge to obtain endobronchial biopsy specimens. Anaesthesia of the upper airways was achieved with lignocaine 10% spray and jelly and sedation by intravenous midazolam (4–8 mg) and alfentanyl (125 μg). The fibreoptic bronchoscope (Olympus BF 10, Key-Med, Hertfordshire, UK) was introduced and endobronchial biopsy samples were taken from segmental and subsegmental carinae of the right lower lobe.
Bronchial biopsies
The biopsies were embedded in optimal cutting temperature (OCT) medium and then snap-frozen in precooled isopentane in liquid nitrogen and stored at −70°C. Cryostat sections (6 μm) were obtained from biopsy specimens placed on poly-l-lysine-coated microscope slides and stained with haematoxylin and eosin (for measurement of SBM thickness).
Staining of eosinophils and neutrophils
Fixed sections in acetone were washed, immunostained for eosinophils and neutrophils in bronchial mucosa using immunoperoxidase 3% in methanol for 30 min (Vectstain kit PK4002, Vector, Peterborough, UK) and incubated with mouse monoclonal antibodies to major basic protein (MBP; dilution 1:100; Cat No MON6008-1, Monosan, The Netherlands) or to neutrophil elastase (NE; dilution 1:50; DAKO Cytomation, Cat No M0756, DAKO, Denmark) for 1 h at room temperature. Sections were washed in phosphate buffered saline (PBS) and incubated for 45 min with biotinylated mouse IgG secondary antibody, made up in PBS containing horse serum. 3,3′-diaminobenzidine (Sigma D5905, Sigma-Aldrich Company Ltd, Gillingham, UK) was used for brown staining. Sections were finally counterstained in haematoxylin (20% in tap water) and dehydrated through alcohols to xylene.
Staining of TGF-β isoforms
TGF-β isoforms were also detected in tissue sections following the same method as above using TGF-β1, β2 and β3 specific (Santa Cruz Biotechnology, Santa Cruz, California, USA). To determine specific cells types expressing TGF-β, double immunostaining labelling techniques with immunoperoxidase (for cell markers) and rhodamine-conjugated (for TGF-β isoforms) were applied. Briefly, endogenous peroxidase activity was blocked using 3% H2O2. Sections were washed in PBS and then incubated with primary anti-NE antibody or anti-MBP antibody in PBS containing 0.1% bovine albumin (BSA). IgG secondary antibody was then applied for 45 min. 3,3′-diaminobenzidine (Sigma D5905, Sigma-Aldrich) was used for brown staining. Sections were then incubated overnight at 4°C with TGF-β1 or TGF-β2 polyclonal antibody diluted in PBS/saponin buffer. Sections were washed thoroughly in PBS/saponin buffer before incubation with rhodamine Red-X-conjugated donkey anti-rabbit IgG (Jackson Immunoresearch, Stratech Scientific Ltd, Cambridgshire, UK) for 45 min at room temperature in the dark. After washing with buffer the nuclei were counterstained with 4′,6 diamidino-2-phenylindole (Vectashield, Vector Laboratory, Peterborough, UK). For negative control preparations, the primary antibody was replaced by non-specific mouse immunoglobulin. Neutrophils and eosinophils stained brown and TGF-β1 and TGF-β2 stained as fluorescent red. Pictures of sections from the same area were taken to co-localise both staining.
Staining of ECM proteins (tenascin, procollagen III) and Smad proteins (2/3, 4 and 7)
Tissue sections were pretreated with PBS and then incubated with antibody against tenascin (mouse monoclonal, dilution 1:50, Monosan MON7025, Monosan, The Netherlands), procollagen-III (rabbit polyclonal, dilution 1:50, Chemicon AB764P, Chemicon International, Hampshire, UK) overnight in the refrigerator; and Smad 2/3 (rabbit polyclonal, dilution Upstate Cat No. 07-408, Upstate, UK), Smad 4 (rabbit polyclonal, dilution 1:50, Upstate Cat No. 06-693, Upstate, UK), and Smad 7 (Santa Cruz, Cat No 7004, dilution 1:50, Santa Cruz, California, USA) for 1 h at room temperature. After extensive washing, the sections were incubated with rhodamine and the nuclei were counterstained with 4′,6 diamidino-2-phenylindole.
Tissue quantification
The SBM was identified under light microscopy and the thickness (μM) was calculated by dividing the area of SBM by the length using a computer analysis system (KS-300, Zeiss, Germany). Eosinophil and neutrophil counts were expressed as the number of cells staining positively for MBP or NE, respectively, per 0.036 mm2. Measurements were performed down to a depth of 100 μm from the luminal surface in areas where the epithelium was present. The same method was used to determine cells expressing TGF-β1, TGF-β2 and TGF-β3 staining.
Immunofluorescence pictures were visualised using a confocal microscope (Leica TCS SP, Heidelberg, Germany). All the slides had their images recorded using the same settings for brightness and contrast, which allowed for comparison and analysis. The presence of SBM proteins (tenascin and procollagen III) was calculated using Scion Image Analysis software package (Scion Corporation, Maryland, USA) by measuring the fluorescence intensity. The density (number of pixels) in the SBM area (μm2) was calculated and divided by the SBM length to obtain thickness (μm) per density (pixels) as a measure of expression of the matrix proteins in the SBM.
Smad 2/3, 4 and 7 positive cells were counted using a confocal microscope. A cell was considered as positive when SMAD protein was expressed in the nucleus. Counts are expressed as percentage of intranuclear positively stained cells of total cells in the biopsy area down to a depth of 100 μm from the luminal surface with the epithelium intact.
Double immunostaining for MBP or NE and TGF-β1 or TGF-β2 was calculated by measuring the percentage of eosinophils or neutrophils staining positively for TGF-β1 or TGF-β2 in the biopsy area down to a depth of 100 μm from the luminal surface where the epithelium was present.
These measurements were performed by one investigator (AT) who was not aware of the treatment received by the patient as the slides were coded by another investigator (TO).
Statistical analysis
Data are presented as means (SE). A paired Student’s t test was used to analyse changes in the numbers of positive cells, SBM thickness and density after saline and allergen challenge. A p value of <0.05 was accepted as significant.
RESULTS
FEV1 and mucosal eosinophils and neutrophils
All patients experienced a biphasic asthmatic response after allergen challenge. The fall in FEV1 after allergen inhalation was maximal at 30 min (−28.1 (0.9)%, p<0.001), followed by a partial recovery and with a late fall maximal at 7 hours (−23.0 (1.2)%, p<0.01). Following saline challenge there was no significant change over the ensuing 10 h.
There was a significant increase in neutrophils and eosinophils in biopsy specimens when comparing saline and allergen challenge: neutrophils (from 6.2 (1.0) to 11.6 (1.8) cells per 0.036 mm2; p = 0.016); eosinophils (from 2.7 (0.7) to 8.6 (1.4) cells per 0.036 mm2; p = 0.01). The increase in neutrophils was significantly correlated with the increase in eosinophils (r = 0.607, p = 0.001).
SBM thickness and density
There was no difference in SBM thickness after the two challenges (8.1 (0.4) vs 8.3 (0.4) μm). The deposition of the ECM protein tenascin, as measured by the thickness × density in the SBM, was increased after allergen challenge (p = 0.02, fig 1⇓). No significant changes were seen in procollagen III deposition.

(A) Individual changes in sub-basement membrane (SBM) thickness (μm) and in the expression of tenascin and procollagen III in SBM measured as thickness (μm) × density (pixels). Dotted lines are mean (SE). (B) Representative confocal micrographs showing an increase in tenascin immunoreactiviy (red) in SBM from two subjects (A, B) after saline (A1, B1) and allergen challenge (A2, B2). Sections were counterstained with 4′,6 diamidino-2-phenylindole (blue) to demonstrate nuclear staining. Original magnification ×400.
Smad protein and TGF-β isoform expression
Positive Smad 2/3 and Smad 4 cells were localised predominantly in the epithelium, although there were also some positively stained subepithelial cells (fig 2⇓). There were a significantly higher number of cells expressing Smad 2/3 and Smad 4 in the nuclei of cells located predominantly in the epithelium after allergen challenge than after saline challenge (Smad 2/3: 4.4 (1.5)% positive cells after saline challenge, 13.0 (3.6)% positive cells after allergen challenge, p = 0.03; Smad 4: 4.4 (1.1)% positive cells after saline challenge, 16.1 (3.4)% positive cells after allergen challenge, p = 0.01).

(A) Changes in the percentage of total cells from biopsy sections with nuclear positive staining for Smad 2/3 and Smad 4 proteins after saline and allergen challenges. Dotted lines represent mean (SE). (B) Representative immunofluorescence confocal micrograph showing an increase in Smad 2/3 (A) and Smad 4 (B) proteins (red staining) in bronchial tissue after saline (A1, B1) and allergen (A2, B2) challenge in the nucleus (arrows).
No positively stained Smad 7 cells were detected. In order to ensure that the Smad 7 staining antibody was able to detect Smad 7, we stained airway smooth muscle cells transfected with an adenovirus vector expressing double-positive Smad 7. We were able to demonstrate positive staining for Smad 7 using our anti-Smad 7 antibody (data not shown).
Positive staining was observed with the antibodies to the three TGF-β isoforms (1, 2 and 3). The predominant TGF-β staining was found in the epithelial cells, particularly in the apical pole. However, there was a significant difference in TGF-β2 positive cells after allergen challenge. The counts were as follows: TGF-β1 from 14.0 (1.5)% positive cells after saline challenge to 15.1 (1.6)% positive cells after allergen challenge (p>0.05); TGF-β2 from 11.3 (1.9)% to 17.1 (1.5)% positive cells (p = 0.03); and TGF-β3 from 8.3 (1.5)% to 8.7 (1.8)% positive cells (p = 0.76, fig 3⇓).

Expression of transforming growth factor (TGF)-β1, TGF-β2 and TGF-β3 in bronchial mucosa. (A) Changes in the percentage of total cells with positive staining for TGF-β1, TGF-β2 and TGF-β3 after saline and allergen challenge. Dotted lines represent mean (SE). (B) Representative micrographs of bronchial tissue taken with light microscopy immunostained for (a) TGF-β1, (b) TGF-β2 and (c) TGF-β3. Original magnification ×400.
Expression of TGF-β1 and TGF-β2 in eosinophils and neutrophils
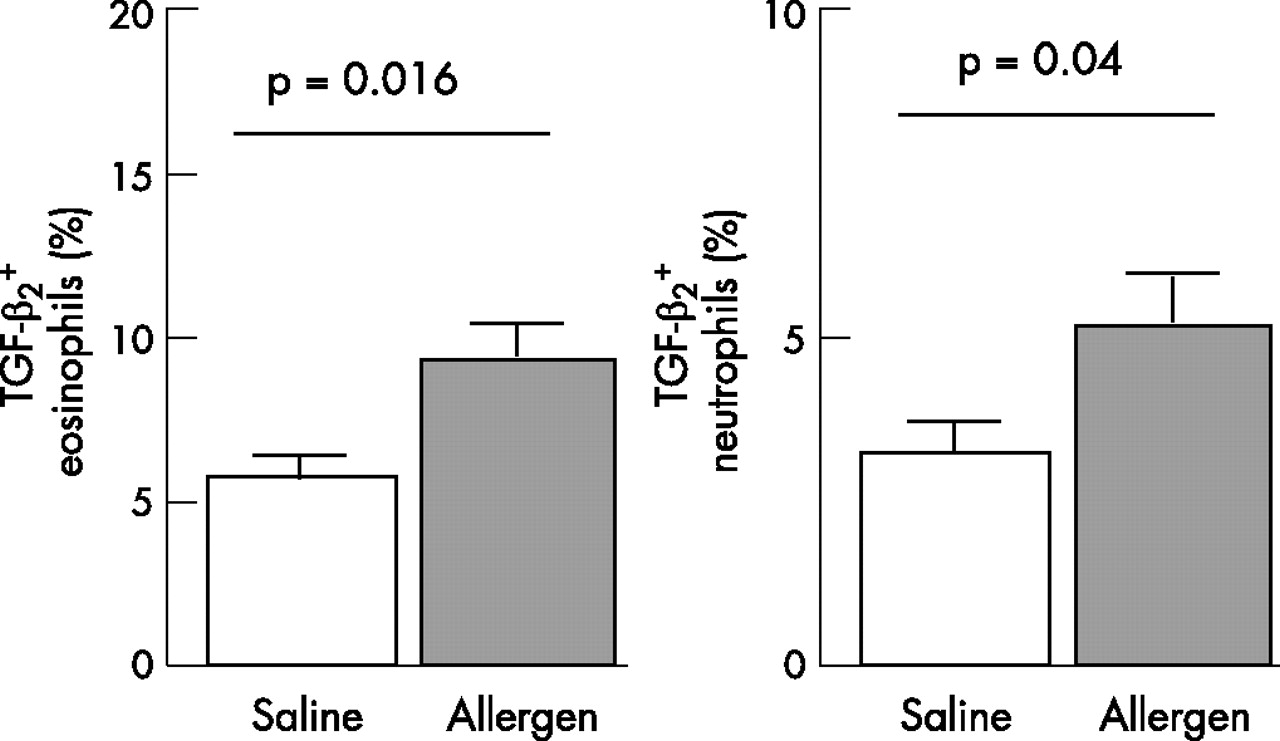
Using double immunostaining, TGF-β1 and TGF-β2 were found in both eosinophils and neutrophils present in the airways mucosa (fig 4⇓). The eosinophils and neutrophils positively stained for TGF-β1 did not change after the allergen challenge (7.4 (0.9)% of TGF-β1 positive eosinophils after saline challenge and 8.1 (1.1)% of TGF-β1 positive eosinophils after allergen challenge (p = 0.21); 6.1 (0.8)% of TGF-β1 positive neutrophils after saline challenge and 7.0 (0.9)% of TGF-β1 positive neutrophils after allergen challenge (p = 0.43). However, TGF-β2 positive eosinophils and neutrophils significantly increased after allergen challenge: from 5.7 (0.7)% of TGF-β2 positive eosinophils after saline challenge to 9.3 (1.2)% of TGF-β2 positive eosinophils after saline challenge (p = 0.016); and from 3.3 (0.6)% of TGF-β2 positive neutrophils after saline challenge to 5.3 (0.75)% of TGF-β2 positive neutrophils after allergen challenge (p = 0.04, fig 5⇓).

Localisation of transforming growth factor (TGF)-β2 staining in major basic protein (MBP) and neutrophil elastase (NE) positive cells in airway mucosa. Top panel: Section under confocal microscopy from subjects with atopic asthma with TGF-β2 positive staining shown as red fluorescence. Bottom panel: Similar sections showing either MBP staining (eosinophils) or NE staining (neutrophils) as brown staining. Arrows show the same cells (either eosinophil or neutrophil with TGF-β2 positive staining). Original maginification ×400.
Expression of transforming growth factor (TGF)-β2 in eosinophils and neutrophils. Change in percentage of eosinophils and neutrophils from biopsy sections positively stained for TGF-β2. Cells were counted in the area down to a depth of 100 μm from the luminal surface.
We found no significant correlations between the degree of fall in FEV1 in the early or late phase response and the number of positively staining Smad 2/3 or Smad 4 epithelial cells, or the number of positively staining TGF-β1 or TGF-β2 staining eosinophils or neutrophils measured after allergen challenge.
DISCUSSION
The novel finding in this study is the increase in expression of TGF-β2, particularly in the airway epithelial cells, and also in eosinophils and neutrophils following acute allergen challenge, but without an increase in expression of TGF-β1 and TGF-β3 in the epithelium or infiltrating leucocytes. Further support for a role for TGF-β2 comes from the finding that the expression and activation of Smad 2/3 and Smad 4 are increased following allergen challenge, principally in the epithelium. Our data indicate that TGF-β2 may be responsible for the increased deposition of tenascin observed after a single allergen challenge, although the contribution of TGF-β1 and TGF-β3 may still be important.
Examination of bronchial biopsies from patients with atopic asthma undergoing allergen challenge revealed that, within 24 h after allergen exposure, there was no significant change in SBM thickness. However, tenascin deposition within the SBM was increased, although deposition of procollagen III did not change significantly. This implies that changes in airway wall remodelling may occur within 24 h of allergen challenge, confirming a previous study in which similar measurements were made.20
It has been suggested that the epithelial-mesenchymal-trophic unit, which comprises the airway epithelium, the SBM and adjacent fibroblasts, may be responsible for the changes in airway wall remodelling observed in asthma.21,22 We have shown that there is increased expression of TGF-β2 and activation of the TGF-β signalling pathway following allergen challenge. Activation of the TGF-β2 signalling pathway may occur in the airway epithelial cells, and we presume that this may be the cause of the increased tenascin deposition observed in the extracellular matrix. Indeed, both TGF-β1 and TGF-β2 can increase the expression of tenascin and fibronectin in the extracellular matrix surrounding the BEAS2B human bronchial epithelial cell line.23
There is circumstantial evidence for a role for TGF-β in asthma, particularly under conditions of experimental allergen challenge. For example, increased levels of TGF-β have been measured in the bronchoalveolar lavage fluid of asthmatic subjects following allergen challenge.24 TGF-β pathway signalling involves the phosphorylation of downstream Smad proteins, which comprises the receptor-regulated Smad (R-Smad, such as Smad 2, 3), the co-mediator Smad (Co-Smad or Smad 4), and the inhibitory Smad (I-Smad, such as Smad 7). Activated Smad complexes translocate into the nucleus to upregulate the transcription of target genes.25 Rosendahl et al studied human airway biopsies and murine allergen challenged models and found that Smad signalling in bronchial epithelial cells could play a determinant role in the pathophysiology of allergic respiratory diseases.26,27 Our data also support a previous observation of upregulation of R-Smad (Smad 2) in asthmatic lungs induced by allergen.28
In our study the expression of TGF-β1 did not change after allergen challenge, but there was significant baseline expression of TGF-β1, TGF-β2 and TGF-β3 in biopsies obtained from patients with mild atopic asthma. Because we did not compare this expression with that found in normal healthy subjects, we are unable to determine whether this represents an increase in mild asthma. However, other studies suggest that TGF-β1 expression is increased in mild asthma.29 TGF-β2 has been shown to be the most prominent isoform in biopsy specimens from patients with severe asthma as a result of its increased expression in infiltrating eosinophils.30 In addition, this increase in TGF-β2 expression was associated with an increase in SBM thickness in the patients with the most severe asthma.
One limitation of our study is that we studied only one time point (24 h) and cannot therefore tell whether the deposition of tenascin observed at 24 h is only the beginning of the process. Relevant to this is our inability to detect any evidence of the inhibitory Smad (Smad 7) activation, even though our antibody was able to detect Smad 7. However, we do not know whether Smad 7 activation had occurred earlier or would occur later, although it is likely that all the Smad family would be expected to be activated simultaneously. Whether the lack of Smad 7 activation represents a defect in asthma, which could underlie an increased functional effect of TGF-β activation in asthmatics undergoing allergen challenge, is not known. Nakao and colleagues reported that the baseline immunoreactive expression of Smad 7 in bronchial epithelial cells of asthmatic subjects was significantly less than that of non-asthmatic subjects, and that the expression correlated inversely with the degree of SBM thickness.31
We found an increase in submucosal eosinophils and neutrophils following allergen challenge. Although much emphasis has previously been placed on the post-allergen eosinophilia, little attention has been given to the neutrophilic inflammation which was as prominent as the eosinophilia. We also found that both eosinophils and neutrophils were capable of expressing TGF-β1 and TGF-β2 with negligible expression of TGF-β3; in addition, in both neutrophils and eosinophils there was an increase in the percentage of these cells expressing TGF-β2 following allergen challenge, as determined by the double-immunostaining techniques used. The capacity for both eosinophils and neutrophils to express TGF-β isoforms, particularly after allergen challenge, supports the possibility that inhibition of both eosinophilic and neutrophilic inflammation may lead to prevention of airway wall remodelling. Neutrophilic inflammation is a particularly important feature of severe asthma.32,33 Treatment with anti-interleukin-5 antibody, which reduces the number of submucosal eosinophils in patients with asthma, is associated with a reduction in TGF-β levels in bronchoalveolar lavage fluid,34 indicating that TGF-β may be induced by interleukin-5. In vitro studies of epithelial cells also indicate that NE can induce TGF-β secretion from the extracellular matrix, further emphasising the potential contribution of neutrophils to airway wall remodelling in asthma.35 Human mast cell chymase also possesses similar properties36 and could be another stimulus for TGF-β release following allergen challenge. Finally, in a murine asthma model, treatment with a blocking anti-TGF-β antibody reversed peribronchiolar extracellular matrix deposition.37
In conclusion, we have shown that allergen challenge of patients with mild asthma induces the deposition of tenascin in the SBM within 24 h and is associated with neutrophil and eosinophil inflammation, activation of the TGF-β associated Smad pathway and upregulation of TGF-β2 expression in epithelial cells, neutrophils and eosinophils. These changes in tenascin deposition and TGF-β2 expression are small; however, repeated episodes of allergic inflammation induced by continuous or repeated allergen exposures could lead to significant cumulative increases. Our data also implicate a potential importance for TGF-β2 expression and activation in the increase in tenascin deposition. Further studies are needed to confirm this.
Acknowledgments
The authors thank Mr Ed Inett for his technical support with confocal microscopy and Ms Sally Meah for helping with the recruitment of patients and the performance of the allergen challenges and bronchoscopies.
REFERENCES
Footnotes
Published Online First 24 January 2007
This study was supported by a Wellcome Trust grant and Dr Alfons Torrego was the recipient of a European Respiratory Society Fellowship.
Competing interests: None.