Article Text

Abstract
Background: Lung densitometry derived from computed tomographic images offers an opportunity to quantify emphysema non-invasively, but a pathological standard cannot be applied to validate its use in longitudinal monitoring studies. Consequently, forced expiratory volume in 1 second (FEV1) remains the standard against which new methods must be judged. We related progression of densitometry (15th percentile point and voxel index, threshold −950 Hounsfield units) to disease stage and FEV1 decline in two studies of subjects with α1-antitrypsin deficiency (PiZ).
Methods: Consistency of progression, measured using densitometry and FEV1, was assessed in relation to disease stage in a 2 year study of 74 subjects grouped according to the FEV1 criteria employed in the GOLD guidelines. In the second study of a subgroup of subjects with extended data (n = 34), summary statistics were applied to measurements performed annually over 3 years and the rate of progression of densitometry was related to FEV1 decline.
Results: The progression of percentile point was consistent across a wide spectrum of disease severity, but voxel index progression varied in association with disease stage (p = 0.004). In the second study, FEV1 decline correlated with progression of lung densitometry (percentile point: rS = 0.527, p = 0.001; voxel index: rS = −0.398, p = 0.012).
Conclusions: 15th percentile point is a more consistent measure of lung density loss across a wide range of physiological impairment than voxel index. However, both methods are valid for use in longitudinal and interventional studies in which emphysema is the major outcome target.
- AATD, α1-antitrypsin deficiency
- CT, computed tomography
- FEV1, forced expiratory volume in 1 second
- HU, Hounsfield units
- Perc15, 15th percentile point
- VI, voxel index
- lung densitometry
- computed tomography
- emphysema
- alpha1-antitrypsin deficiency
Statistics from Altmetric.com
- AATD, α1-antitrypsin deficiency
- CT, computed tomography
- FEV1, forced expiratory volume in 1 second
- HU, Hounsfield units
- Perc15, 15th percentile point
- VI, voxel index
The natural history of chronic obstructive pulmonary disease (COPD) is one of accelerated decline in lung function in susceptible individuals, and this progression has been assessed traditionally by measurement of the forced expiratory volume in 1 second (FEV1).1,2 The FEV1 is also used as a surrogate measure of emphysema and its progression,3 although the cause of airway obstruction in general COPD is heterogeneous4,5 and the FEV1 is recognised as a non-specific parameter. This creates logistical problems in assessing treatment effect in therapeutic trials of disease (particularly emphysema) modifying drugs and, consequently, there is a pressing need for the development of more specific outcome measures.
Emphysema, although defined in morbid anatomical terms,6,7 can now be diagnosed and quantified non-invasively with computed tomography (CT). Various parameters derived from the frequency distribution histogram of lung voxel densities have been proposed as accurate measures8,9,10,11,12,13 but, in longitudinal studies of emphysema in α1-antitrypsin deficiency (AATD), the most widely applied parameters are the percentile point and voxel index methods.14–,17 The percentile point is defined as the cut off value in Hounsfield units (HU) below which a specified percentage of all voxels are distributed, and the voxel index is defined as the proportion of lung voxels of low density below a specified threshold (fig 1⇓). These two parameters may be regarded as having an inverse mathematical relationship, but there may be important differences between the methods. The sensitivity of the percentile point method is claimed to be relatively threshold independent and to give almost identical results within a broad range of percentiles from the 10th to the 30th,14 whereas the voxel index method has been shown to be threshold dependent.14,18 As a consequence, the progression of the percentile point should be a consistent measure of lung density reduction across a wide spectrum of disease severity whereas, theoretically, the voxel index will vary with disease stage. However, there are no data that directly support either this hypothesis or the superiority of either method.
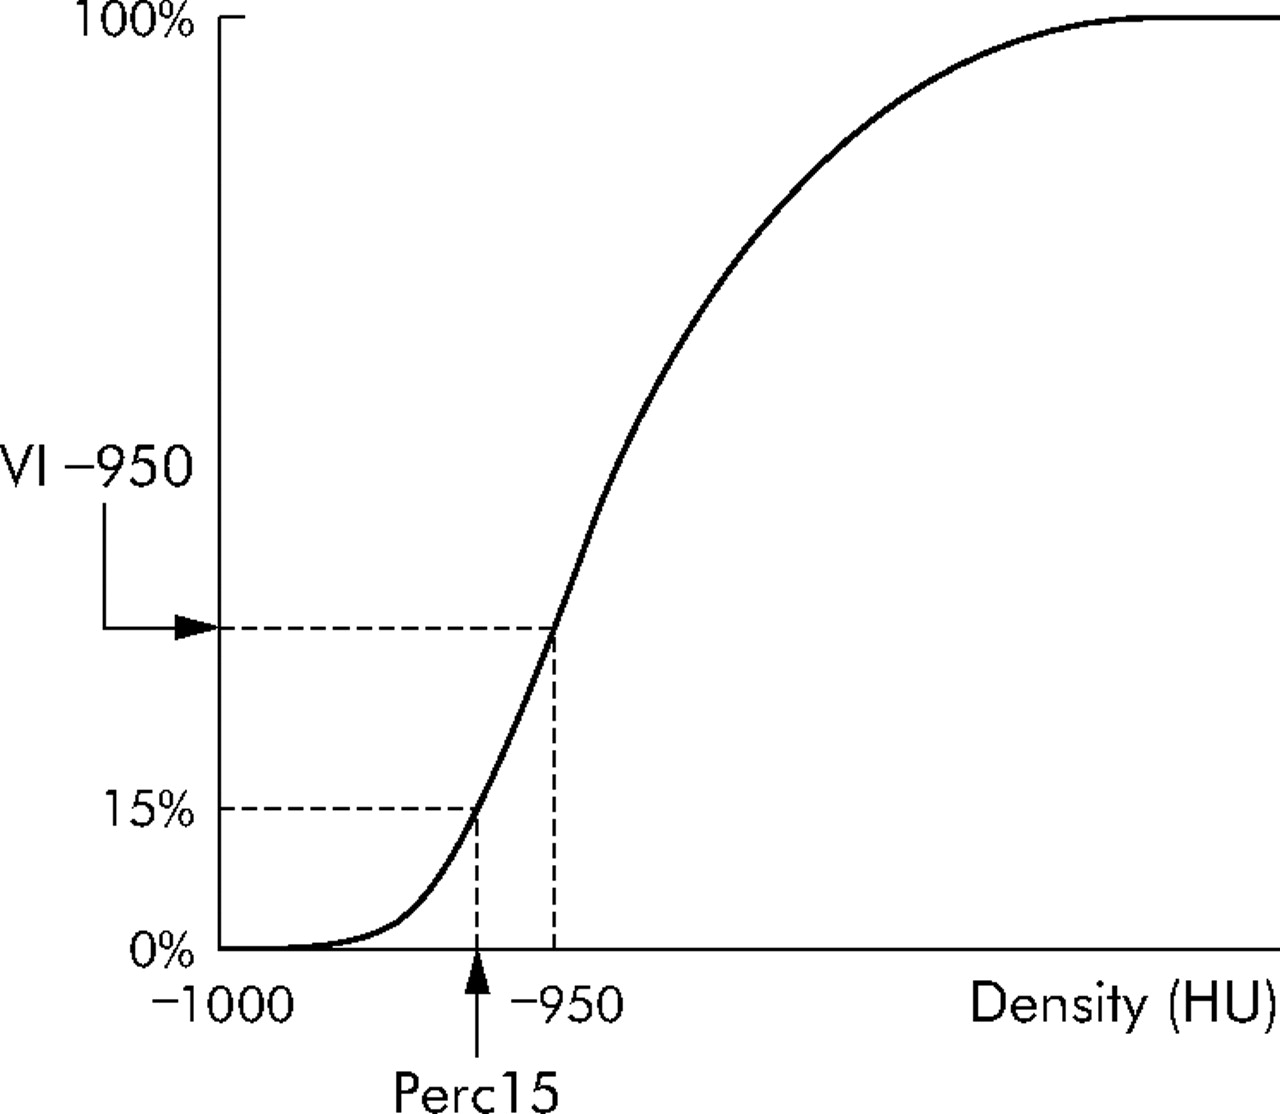
Cumulative voxel distribution histogram showing derivation of percentile point and voxel index parameters. The 15th percentile point (Perc15) is defined as the cut off value in Hounsfield units (HU) below which 15% of all voxels are distributed and, as a true measure of density, this parameter consequently decreases with worsening emphysema. The voxel index (VI) below –950 HU is defined as the proportion of lung voxels of low density below a threshold of –950 HU and increases with worsening emphysema.
Cross sectional pathological studies using a high resolution protocol have shown that the voxel index at a threshold of −950 HU (VI −950) relates directly to emphysema,19,20 and it is also likely that this is the optimal threshold for longitudinal studies.18 In the only study to validate the percentile point method against a pathological standard, comparison between airway wall surface area per unit volume (AWUV) and CT densitometry was restricted to the 5th percentile point.8 Notwithstanding the above published evidence, a recent peer reviewed workshop report on the use of CT in longitudinal studies of emphysema advised that the method of choice is the 15th percentile point (Perc15) measured from inspiratory images without the incorporation of volume control or correction to adjust for inspiratory level.21
Widespread acceptance of CT densitometry as an outcome measure for trials of emphysema modifying therapy requires validation against a recognised standard.22 The “traditional measure” in longitudinal studies of COPD and emphysema is FEV11,23–,27 and, consequently, improved understanding is needed of the relationship between the progression of CT parameters and progression of FEV1. The present study was therefore undertaken to explore the relationship between emphysema progression and disease stage in AATD, comparing these two principal quantitative CT methods and, in addition, to establish the validity of CT for monitoring emphysema by evaluating whether the progression of CT lung densitometry was related to the rate of decline of FEV1.
METHODS
Subjects
Patients attending our centre between November 1996 and February 2002 were selected to include all PiZ subjects with complete datasets at baseline and 2 years later (n = 74) and a subset of PiZ subjects with four consecutive complete annual assessments (n = 34). Annual attendance on the programme includes full pulmonary function testing, assessment of health status, medical examination, and thoracic CT scanning as described previously.28 Confirmation of α1-antitrypsin level and phenotype was by immunoassay and isoelectric focusing, respectively, in a central US laboratory (Heredilab, Salt Lake City, UT, USA) using a dried finger prick blood spot.
The programme was approved by the University of Birmingham Hospital NHS Trust research ethics committee and all subjects gave written informed consent.
Lung function testing
Lung function testing was performed according to the British Thoracic Society/Association of Respiratory Technicians and Physiologists (BTS/ARTP) guidelines29 as described previously.28 For annual change in FEV1, only post-bronchodilator (2.5 mg salbutamol and 250 μg ipratropium bromide, nebulised) results were used.
Computed tomography
Patients were instructed to take their usual medication before scanning. Images were acquired on a Prospeed Scanner (General Electric Medical Systems, Milwaukee, WI, USA) at full inspiration in the supine position (120 kVp, 200 mAs, reconstructed using a high resolution “bone” algorithm28). Incremental 1 mm axial slices were taken at 10 mm intervals throughout the thorax for baseline scans and limited imaging at the level of the aortic arch and inferior pulmonary veins for subsequent scans.
CT densitometry
The 15th percentile point (Perc15) and voxel index at a threshold of −950 HU (VI −950) were measured for single images selected from each series representing the upper (through the middle of the aortic arch) and lower (at the junction of inferior pulmonary veins and left atrium) zones using the Pulmo-CMS software (MEDIS Medical Imaging Systems BV, Leiden, the Netherlands). An internal air calibration process was incorporated as described previously.18
Trends in progression rate: comparison of densitometric parameters
The relationship between CT densitometic parameters was initially assessed in a cross sectional analysis of the baseline images ((upper zone parameter + lower zone parameter)/2) in 74 subjects with 2 year data. The group was then subdivided into four using the FEV1 criteria incorporated into the GOLD classification of disease stage30—namely, FEV1 >80% predicted (group 1); FEV1 50–79% predicted (group 2); FEV1 30–49% predicted (group 3); FEV1 <30% predicted (group 4)). In each group the median rate of progression and interquartile range (IQR) was calculated for FEV1 and for each densitometric parameter derived from the upper and lower zone scans individually and averaged as above.
CT lung density progression and its relationship with FEV1 decline
The rate of progression in FEV1 (post-bronchodilator), Perc15 and VI −950 was measured in 34 subjects with annual data over 3 years using Excel (Microsoft Inc, US) to calculate the derived slope between each of the above measures and the date of measurement.
Statistical analysis
Data were analysed using the Statistical Package for the Social Sciences (SPSS) Version 11.5 (SPSS Inc, Chicago, IL, US). Demographic data and clinical and radiographic parameters were summarised as median (IQR). Relationships between continuous variables were assessed with Spearman’s correlation coefficient and the Jonckheere-Terpstra test was used to identify trends associated with disease severity.
RESULTS
Trends in progression rate
The baseline characteristics of the 74 patients in the initial group are shown in table 1⇓. There was close agreement between both densitometric parameters at baseline, with a curvilinear relationship between Perc15 and VI −950 (rS = 0.994, p<0.001, fig 2⇓).
Clinical characteristics of the 74 PiZ subject cohort at baseline

Individual data for 15th percentile point (Perc15) and voxel index at a threshold of –950 HU (VI −950) derived from the mean values of upper zone and lower zone indices at baseline in 74 PiZ subjects (rS = −0.994, p<0.001).
The characteristics of the four GOLD subgroups are shown in table 2⇓ and the results of the Jonckheere-Terpstra test are shown in table 3⇓.
Clinical characteristics of the GOLD subgroups expressed as median (IQR)
Annual rate of disease progression related to disease severity: data expressed as median (IQR)
The rate of progression in FEV1 was significantly associated with disease stage (p = 0.001), with the highest decline observed in group 2 and the lowest in group 4 (table 3⇑ and fig 3A⇓). There was no significant trend in the rate of progression of Perc15 in association with disease stage, but the rate of progression of VI −950 was significantly associated with disease stage (table 3⇑). There was a clear trend in the progression rate of VI −950, with a graded increase in rate in association with worsening disease stage that was observed in both the individual and combined upper and lower zone images (table 3⇑ and fig 3C⇓).

Relationship between disease stage and annual progression rate measured by (A) FEV1 (ml), (B) 15th percentile point (Perc15), and (C) voxel index at a threshold of –950 HU (VI −950). Data are shown as the median and interquartile range and CT progression data were derived from the average of the upper and lower zone inspiratory images. Group 1: FEV1 >80% predicted (n = 18); Group 2: FEV1 50–79% predicted (n = 18); Group 3: FEV1 30–49% predicted (n = 20); Group 4: FEV1 <30% predicted (n = 18).
CT lung density progression and its relationship with FEV1 decline
The baseline characteristics of the 34 subjects with a complete data set are shown in table 4⇓.
Baseline clinical characteristics of the 34 PiZ subjects studied over 3 years
The annual rate of CT progression in the upper zone images correlated with the annual rate of decline in FEV1 (fig 4⇓). The best correlation was seen with Perc15 (rS = 0.527, p = 0.001), but a significant correlation was also seen with VI −950 (rS = −0.398, p = 0.012). There was no correlation between changes in the lower zone images and changes in FEV1 (Perc 15: rS = 0.075, p = 0.35; VI −950: rS = −0.251, p = 0.09). However, there was a correlation between the rate of lung density loss in the upper and lower zones (Perc 15: rS = −0.473, p<0.001; VI −950: rS = 0.476, p<0.001).

Relationship between FEV1 progression (ml/year) and annual CT progression in upper zone inspiratory images using (A) Perc15 (rS = 0.527, p = 0.001) and (B) VI −950 (rS = −0.398, p = 0.012), n = 34. Data were derived from four measurements over 3 years using summary statistics to calculate the progression slope for each parameter.
DISCUSSION
We have shown in a cross sectional study that there is good correlation between the percentile point and voxel index techniques for assessment of lung densitometry across a wide spectrum of disease severity. Of greater importance is the curvilinear relationship (fig 2⇑), because differences in the gradient of the curve in mild (VI −950 close to 0) and severe disease (VI −950 above 30%) suggest that the relative sensitivity of these parameters to lung density changes is dependent on disease severity—that is, in early disease when the curve is more vertical, the relative sensitivity of the Perc15 method to change is likely to be greater than the VI −950 method, but the reverse would be true in severe disease. The subgroup analysis confirms this and shows that the above relationship largely reflects the finding of consistent progression of Perc15 across the spectrum of disease severity (fig 3A⇑) but a trend of increasing VI −950 progression in association with worsening disease stage (table 3⇑ and fig 3C⇑). Consequently, the sensitivity of the voxel index method to detect progression is not only threshold dependent, as shown previously,14,18 but also varies with disease severity. In contrast, the sensitivity of the percentile point method is threshold independent,14 and the current study confirms the theoretical concept that it can detect changes in lung density consistently across the spectrum of disease severity. Notwithstanding this, there was wide variability in Perc15 progression rate in early disease (group 1). This may be because the subjects in group 1 were younger, with fewer index cases and lower pack year cigarette exposure (factors known to influence progression), and hence there may not have been significant loss of lung density in some patients. Nevertheless, since there is clear evidence of disease progression indicated by the decline in FEV1, an alternative explanation is that the limited sampling protocol that was employed in the programme at this time may have failed to detect the initial development of emphysema. Current understanding of the natural history of emphysema in AATD is that, in the majority of PiZ subjects, the lung bases are the site of initial change and, as the disease progresses, there is increasing extension of emphysema towards the apical regions. For this reason, the upper and lower zone images were combined in an attempt to overcome the effect that these stage related changes in emphysema distribution would have on the measurement of densitometry progression using single image analysis. Despite this, similar relationships were also demonstrated in the analysis of the progression measured individually in the upper and lower zones, suggesting that this is not a reflection of a temporal process alone.
It is important to note that the rate of decline in FEV1 was shown to vary in association with disease stage, and this has been recognised previously in individuals with AATD.31 The absolute change in FEV1 observed in the current study, and the observed trend in decline, are similar to this previous study and indicate that our group of patients is likely to be a representative sample.
The current study shows for the first time that progression of CT densitometry relates to the rate of decline in FEV1 in patients with AATD. The validation of CT densitometry against FEV1 appears, at first sight, to be a tautology since CT densitometry was developed to overcome rather than to reflect the limitations of FEV1. However, the rationale for this approach is logical and deserves further scrutiny. A close correlation between CT and pathological morphometry is of fundamental importance given the morphological definition of emphysema, but the measurement of airspace dimensions is not an exact science and such studies alone may not therefore be sufficient validation. It must be acknowledged that, in the current definitions of emphysema, “an increase in airspace dimension” remains a nebulous criterion in the absence of a defined normal range. In addition, it is known that the methods used for specimen processing greatly influence airspace dimensions,32 so it cannot be assumed that the correlations between clinical CT densitometry and morbid anatomy are consistent when applied to lung morphology in vivo. Furthermore, the source of lung specimens for cross sectional pathological studies does not allow comparison across the whole spectrum of disease severity since the majority of tissue originated either from necroscopic or from tumour resection material. It is therefore essential to show that CT is not only representative of emphysema when compared with morbid morphometry, but also that it relates to accepted clinical measurements.
Previous efforts to identify a relationship between the loss of lung density and the decline in FEV1 have been hampered, almost certainly, by the variability of each measure. Demonstration of this relationship required the application of summary statistics using linear regression on repeated measures over 3 years in order to overcome the error arising from the variability that exists in both parameters. The variability in FEV1 measurements is likely to be minimised by the high level of quality control applied in our physiology laboratory which ensures precision within 50 ml, whereas in routine clinical practice the accepted precision is within 100 ml.29 It is recognised that the variability in CT densitometry due to sampling error and changes in inspiratory level between scans was unavoidable using a limited slice protocol, but the internal consistency of this method has been shown to be high16 and it allowed repeated measures to be made while minimising radiation exposure. Furthermore, we have shown that densitometric indices derived from single image analysis relate well to whole lung analysis (data not shown).
The HRCT protocol used for densitometry in the current study has been superseded by the use of volume scanning protocols that allow adjustment of lung density measurements to a standardised lung volume. In addition, newer “low dose” scanning protocols have been shown to generate reproducible densitometry,33 and edge-enhancing reconstruction algorithms have been replaced with edge-smoothing algorithms in order to reduce signal noise. Although our programme now employs a modern volume scanning protocol, there is an unavoidable interval between the adoption of newer methodology and the generation of longitudinal data. Consequently, the data reported in the current study remain unique, and notwithstanding the limitations of the scanning protocol that was employed, an association between annual change in FEV1 and CT lung densitometry was identified that was statistically significant. Furthermore, it is anticipated that improvements in scanning methodology will generate data which is even more reproducible than the HRCT protocol employed in our current and previous longitudinal studies.16 For instance, in the most recent study, which used a volume scanning protocol but limited data collection to just two points spanning the period of observation, an association was found between annual change in CT lung densitometry and health status,17 suggesting that the method is becoming more reliable as an indicator of progression.
The relationship between CT progression and FEV1 progression was stronger for Perc15 than for VI −950. This is not unexpected given the findings of the first part of this study indicating that there is a complementary trend in progression of FEV1 and Perc15 (figs 3A and B⇑) across the spectrum of disease severity but a dissimilar trend in the progression of VI −950 (fig 3C⇑). In particular, in severe disease (FEV1 <30% predicted) when there is a slowing of the decline in FEV1, VI −950 progression is maximal. However, the rationale behind the development of CT densitometry was to overcome rather than reflect the deficiencies of FEV1, and the differences described above should not necessarily be interpreted as disadvantageous. On the contrary, they may indicate that VI −950 is the most appropriate method for monitoring emphysema progression in subjects with severe disease.
It is surprising that the relationship between FEV1 decline and CT progression was shown in the upper zone rather than the lower zone images, since impairment of FEV1 relates better to CT indices of severity in the lower lung.34 However, approximately two thirds of subjects with AATD have predominantly basal disease,34 and the upper zone images may therefore be ideally placed in the majority of patients to monitor extension of emphysema from the lower to the upper lung regions as the disease progresses. Indeed, previous studies that showed CT densitometry to be more sensitive to progression16 and a better predictor of mortality than FEV1 in subjects with AATD35 found that densitometric indices were more informative when derived from the upper than from the lower lung regions. When taken together, these findings may indicate that selective sampling of the upper lung region is a more sensitive method of detecting progression and treatment effects than whole lung densitometry. Nevertheless, the pattern of distribution of emphysema in subjects with AATD is not uniform,34 and whole lung imaging remains necessary to characterise the distribution of emphysema in individual subjects and the natural history of progression in the different GOLD subgroups.
In summary, we have shown that, as hypothesised, Perc15 is a more consistent measure of change in lung density than VI −950 across a wide spectrum of physiological impairment. In addition, the current study validates the use of CT densitometry in longitudinal studies of emphysema by confirming that progression of change in lung density correlates with decline in the accepted “gold” standard—namely, FEV1. These data should consolidate the role of CT densitometry as a valid outcome measure in studies of the progression and treatment of emphysema.
REFERENCES
Footnotes
Published Online First 14 March 2006
Funding for the ADAPT programme is by a non-commercial grant from Bayer Biologicals, UK and use of the Pulmo-CMS software is supported by European Union funding (grant number RNDV.07773). RAS and JS are members of AIR.
Competing interests: none declared.