Article Text

Abstract
Background Metabolomics could provide new insights into the pathophysiology of cystic fibrosis (CF) by identifying profiles of endogenous metabolites.
Objectives To investigate whether metabolomics of exhaled breath condensate could discriminate between patients with unstable CF, stable CF and healthy subjects, and whether selected metabolites were responsible for between-group differences.
Methods Twenty-nine patients with stable CF, 24 with unstable CF and 31 healthy subjects (age 9–24 years) participated in a cross-sectional study. Metabolomics was performed with high-resolution nuclear magnetic resonance spectroscopy. Partial least squares-discriminant analysis was used as classifier. The results were validated in a second independent study.
Results Intraclass correlation coefficients for between-day and technical repeatability were 0.93 and 0.96, respectively. Bland–Altman analysis showed good within-day repeatability. Correct classification rate of CF (n=53) vs healthy subjects (n=31) was 96% (R2=0.84; Q2=0.79). Model validation with a testing sample set obtained from subjects not included in the primary analysis (23 CF and 25 healthy subjects) showed a sensitivity of 91% and a specificity of 96%. The classification rate of stable CF (n=29) vs unstable CF patients (n=24) was 95% (R2=0.82; Q2=0.78). Model external validation in 14 patients with stable CF and 16 with unstable CF showed a sensitivity of 86% and a specificity of 94%. Ethanol, acetate, 2-propanol and acetone were most discriminant between patients with CF and healthy subjects, whereas acetate, ethanol, 2-propanol and methanol were the most important metabolites for discriminating between patients with stable and unstable CF.
Conclusions Nuclear magnetic resonance spectroscopy of exhaled breath condensate is reproducible, discriminates patients with CF from healthy subjects and patients with unstable CF from those with stable CF, and identifies the metabolites responsible for between-group differences.
- Metabolomics
- nuclear magnetic resonance spectroscopy
- exhaled breath condensate
- cystic fibrosis
- COPD mechanisms
- allergic lung disease
- asthma
- asthma mechanisms
- asthma pharmacology
- COPD pharmacology
- exhaled airway markers
- bronchiectasis
- cytokine biology
- asthma guidelines
- lung physiology
- paediatric asthma
- paediatric lung disease
- drug reactions
Statistics from Altmetric.com
- Metabolomics
- nuclear magnetic resonance spectroscopy
- exhaled breath condensate
- cystic fibrosis
- COPD mechanisms
- allergic lung disease
- asthma
- asthma mechanisms
- asthma pharmacology
- COPD pharmacology
- exhaled airway markers
- bronchiectasis
- cytokine biology
- asthma guidelines
- lung physiology
- paediatric asthma
- paediatric lung disease
- drug reactions
Key messages
What is the key question?
Does nuclear magnetic resonance (NMR) spectroscopy of exhaled breath condensate (EBC) discriminate between patients with unstable cystic fibrosis (CF), stable CF and healthy controls, and are selected metabolites responsible for between-group differences?
What is the bottom line?
NMR spectroscopy of EBC is a reproducible technique which discriminates patients with unstable CF, stable CF and healthy subjects and also unravels the metabolic changes that characterise CF.
Why read on?
To learn how NMR-based metabolomics of EBC provides a unique opportunity for investigating the pathophysiology of CF and identifies a panel of unbiased potential biomarkers of CF. These markers may be useful endpoints in future studies.
Introduction
Airway inflammation plays a central role in the pathophysiology of cystic fibrosis (CF).1 It is not clear whether the exuberant airway inflammation in CF is due entirely to chronic bacterial infection, whether the CF airway epithelium is inherently proinflammatory in the absence of infection2 and whether there is an excessive response to bacterial infection3 or a defect in the resolution of inflammation.4 Breath volatile compounds including hydrogen cyanide have been measured by mass spectrometry techniques in patients with CF and compared with healthy subjects.5 6 Exhaled breath condensate (EBC) is a non-invasive technique for studying the composition of airway lining fluid.7 Relatively few data on EBC metabolic profiles are available, and information on EBC metabolite composition is often obtained by analysing single inflammatory molecules. Metabolomics involves the detection of metabolites in a biological fluid usually using high-resolution nuclear magnetic resonance (NMR) spectroscopy.8 This approach enables a specific quantitative description of the low molecular mass endogenous metabolites in a biological sample, provides a metabolic ‘fingerprint’ which can be used for classification purposes and focuses on the most important regions of the NMR spectrum for further analysis.8 The identification of specific molecules and their relative variations might provide further insights into the pathophysiology of CF.
The presence of discriminating metabolites in a NMR spectrum can be tested with multivariate statistical algorithms which allow a thorough comparison of datasets.9
Metabolomics of EBC with NMR spectroscopy discriminates between children with mild-to-moderate persistent asthma and healthy children10 and between patients with chronic obstructive pulmonary disease and healthy subjects.11 Using NMR spectroscopy, chlorinated and brominated tyrosine residues were detected in the sputum of patients with CF but not in healthy subjects.12 Metabolomic profiles of bronchoalveolar lavage fluid from children with CF are correlated to the degree of airway inflammation.13
The primary objectives of the present study were to verify whether (1) EBC metabolomic analysis with NMR spectroscopy discriminates between patients with unstable CF, stable CF and healthy controls and (2) selective metabolites are responsible for between-group differences.
Methods
Subjects
Twenty-nine patients with stable CF, 24 patients with unstable CF and 31 age-matched healthy controls were studied. Healthy subjects had no history of respiratory or other diseases. They had no upper airway infections nor had received any medication in the previous 4 weeks. The diagnosis of CF was based on clinical, radiological and genotypic characteristics and an abnormal sweat test (sweat chloride ≥60 mmol/l).14 Patients with stable CF had no change in cough or shortness of breath, no requirement for oral or intravenous antibiotics and no significant spirometry change in the previous 4 weeks. Patients with unstable CF were assessed before treatment for pulmonary exacerbation, defined by the presence of at least two of the following signs: oral temperature >38°C, more frequent coughing, increased sputum volume, appetite or weight loss, absence from school or work due to illness (at least 3 of preceding 7 days) and symptoms of upper respiratory tract infection, associated with at least one of the following: decrease in forced vital capacity (FVC) of at least 10%; increase in respiratory rate of at least 10 breaths/min; peripheral blood neutrophil count of ≥15 000/mm3.15 All subjects were non-smokers (see also online supplement).
Study design
The study was cross-sectional. Subjects attended the CF Unit outpatient clinic of Ospedale Pediatrico Bambino Gesù, Rome, Italy on one occasion for clinical examination, EBC collection, spirometry, chest x-ray and blood sampling. Between-day repeatability was assessed in five healthy and 11 CF subjects, among those who participated in the principal study by collecting three EBC samples within 7 days of the first. From the same subjects, separate EBC samples were collected twice within the same day for assessing within-day repeatability. External validation of the classification model was performed by testing EBC samples obtained from subjects not included in the primary analysis and collected in a different centre under similar experimental conditions (CF Unit, University of Naples Federico II, Italy) (see table E1 in online supplement). Informed consent was obtained from parents and adult subjects, and age-appropriate assent from children. The study was approved by the local ethics committees.
EBC sampling
Before EBC collection, subjects refrained from eating for at least 3 h. EBC was collected using a condenser (Ecoscreen, Jaeger, Hoechberg, Germany), which has a saliva trap to reduce the chance of salivary contamination,11 in a windowless clinic facility without disinfectant dispensers; CF patients had not used wipes prior to the study. Saliva was also obtained. EBC was immediately transferred into 10 ml glass vials, closed with 20 mm butyl rubber lined with polytetrafluoroethylene septa and crimped with perforated aluminium seals. Before sealing, volatile substances were removed from samples by a gentle nitrogen gas flow for 3 min (see online supplement).11 Samples were then frozen in liquid nitrogen to immediately ‘quench’ metabolism and preserve the metabolite concentrations.
NMR sample preparation
EBC and saliva samples were rapidly defrosted. 70 μl of reference standard D2O solution (containing 0.1 mM sodium 3-trimethylsilyl [2,2,3,3-2H4] propionate (TSP) and sodium azide at 3 mM) were added to 630 μl of sample.
NMR spectroscopy measurements
Spectra were recorded on a 600 MHz Bruker Avance spectrometer (Bruker BioSpin GmbH, Rheinstetten, Germany) equipped with a CryoProbe. One-dimensional (1D) 1H-NMR and two-dimensional (2D) clean total correlation spectroscopy (TOCSY) spectra were recorded using a standard pulse sequence.16 The estimated detection limit was 0.14 μM. Full details are given in the online supplement.
Spectral and statistical analysis
There are no data in the literature for a sample size calculation in a NMR-based metabolomic study. The spectral 0.12–8.60 ppm region of the high-resolution 1H-NMR spectra was automatically data reduced to integrated regions (buckets) of 0.02 ppm each using the AMIX 3.6 package (Bruker Biospin GmbH, Rheinstetten, Germany). To account for possible metabolite concentration variations due to dilution, each bucket was normalised to the corresponding total spectral area or spectra were referenced to a known TSP concentration (0.1 mM) added to the samples. No difference was observed between these approaches.
To examine EBC metabolite clustering in an unsupervised manner, we applied the spectral filtering orthogonal signal correction routine17 with partial least squares-discriminant analysis (PLS-DA).
Within-day repeatability of NMR spectroscopy was assessed according to the method of Bland and Altman.18 Between-day and technical repeatability were assessed with ANOVA for repeated measures and expressed as intraclass correlation coefficient (ICC).
Data were expressed as mean±SEM after assessing for normality with the D'Agostino-Pearson omnibus normality test. One-way ANOVA and unpaired t tests were used for comparing groups. Significance was defined as a p value of <0.05.
Results
Patient characteristics
The characteristics of the study subjects are shown in table 1. Forced expiratory volume in 1 s (FEV1) and FVC were reduced in patients with CF compared with healthy subjects (table 1). Patients with unstable CF had lower FEV1 and higher systemic inflammation as reflected by serum C reactive protein and white blood cell counts than those with stable CF (table 1).
Subject characteristics*
NMR spectroscopy of EBC discriminates between patients with CF and healthy controls
The EBC NMR profiling of patients with stable and unstable CF was compared with that in healthy controls. Figure 1 shows representative EBC 1D spectra of a healthy subject (figure 1A), a patient with stable CF (figure 1B) and a patient with unstable CF (figure 1C). Spectra resonances were assigned to single metabolites by resorting to 2D 1H-1H TOCSY and 1H-13C Heteronuclear Single Quantum Coherence experiments (not shown) and compared with the Human Metabolome Database19 (http://www.hmdb.ca/) and published chemical shift data.20
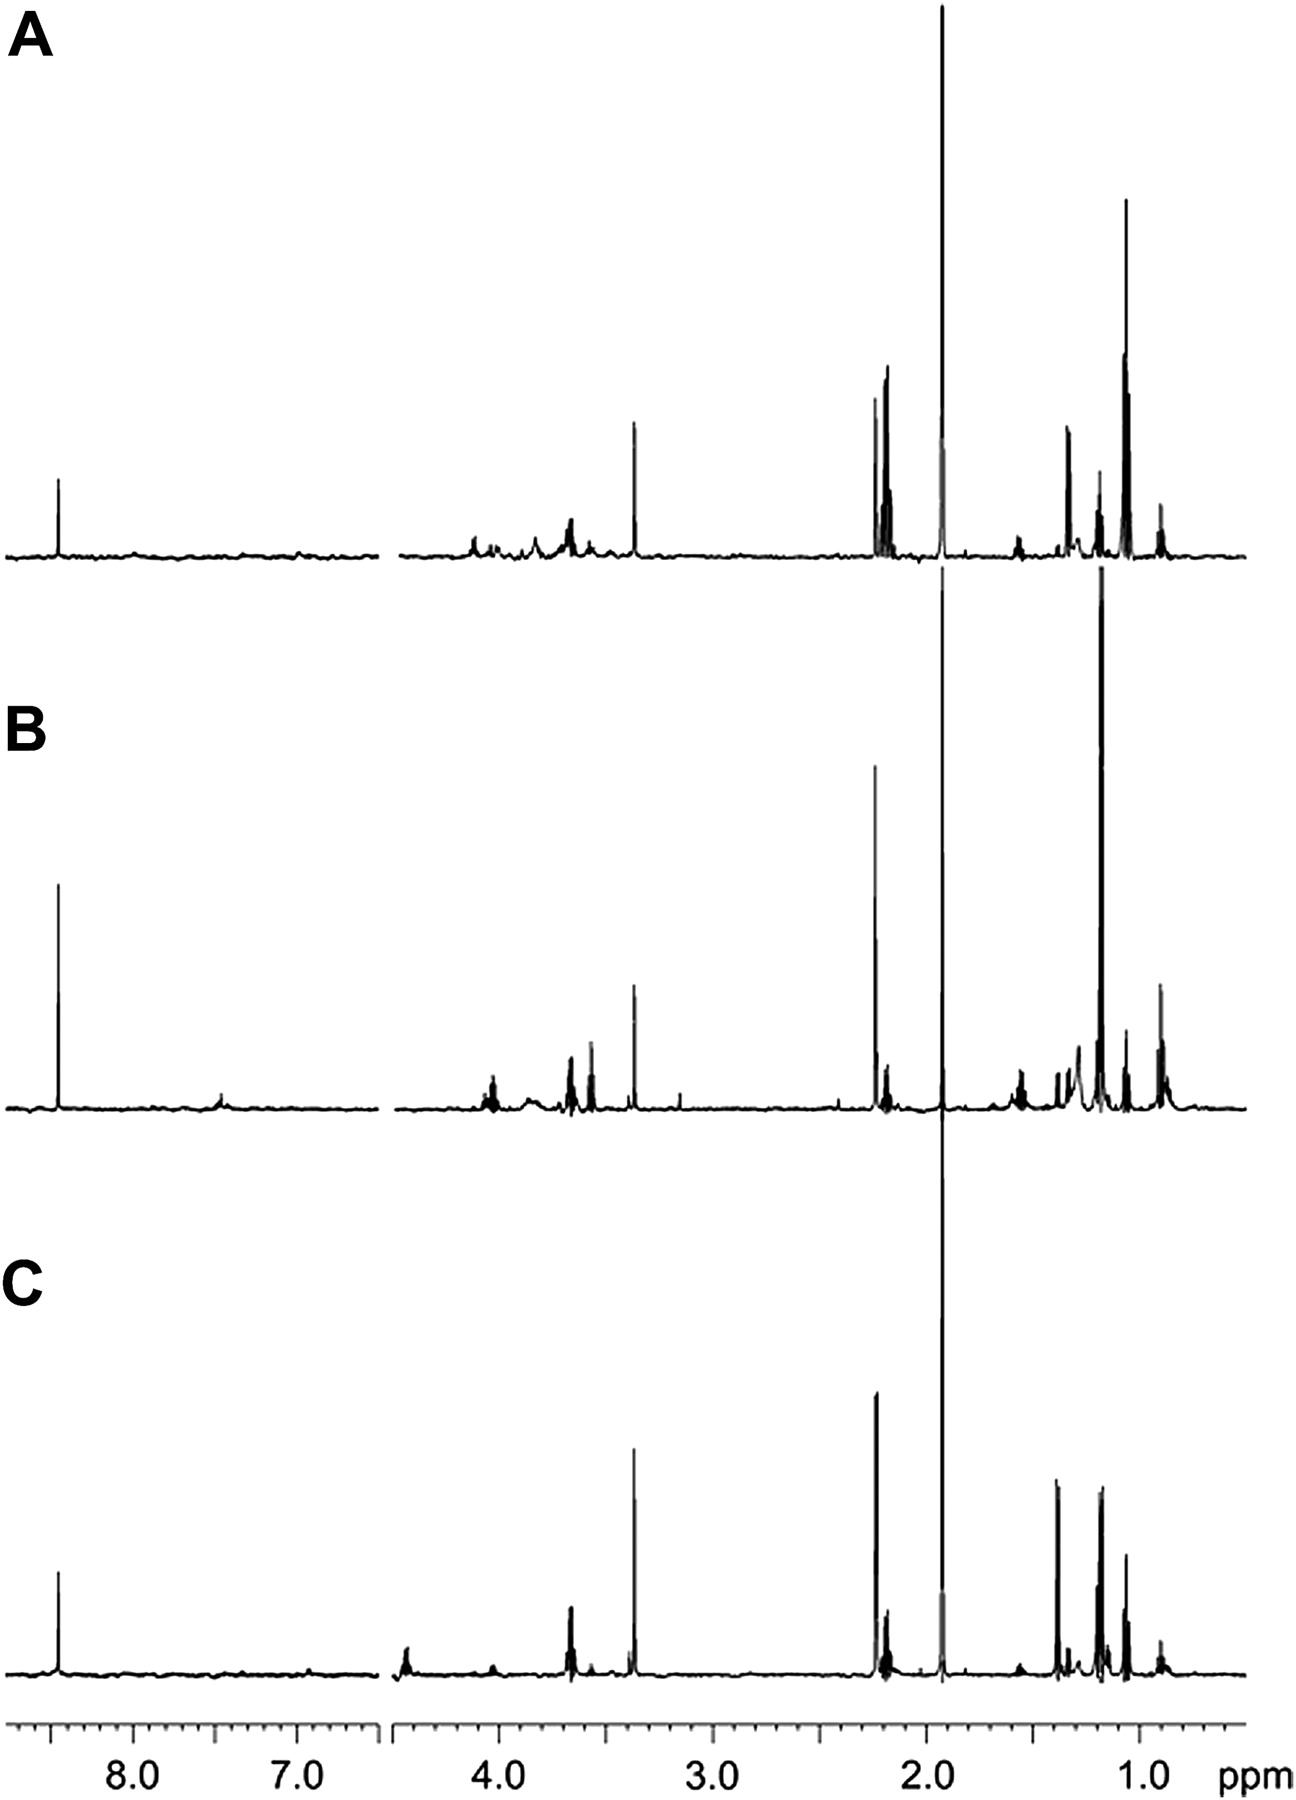
Nuclear magnetic resonance (NMR) spectra of exhaled breath condensate samples. Representative one-dimensional 1H spectra of (A) a healthy subject, (B) a patient with stable cystic fibrosis (CF) and (C) a patient with unstable CF. All signals were assigned to single metabolites by resorting to two-dimensional NMR experiments and referring to published data on metabolite chemical shifts. Absorption (related to the intensity) is plotted on the y-axis and magnetic field strength is plotted on the x-axis (scale is in parts per million (ppm) and usually ranges from 0 to 12 ppm).
PLS-DA showed a strong regression model (96%) between healthy subjects and patients with CF (figure 2A) in which data variation is well explained by the model (R2) with a very good predictivity (Q2) (R2=0.84, Q2=0.79). To validate this model, a sample set obtained from subjects not included in the primary analysis (23 patients with CF, 25 healthy subjects) was tested blindly (see table E1 in online supplement). The model correctly identified 21 of 23 patients with CF (91% accuracy) and 24 of 25 healthy subjects (96% accuracy, 4% false positives) with a sensitivity of 91%, a specificity of 96%, a positive likelihood ratio (LR+) of 23 and a negative likelihood ratio (LR−) of 0.08.

Patients with cystic fibrosis (CF) versus control subjects. Partial least squares-discriminant analysis (PLS-DA) with the spectral filtering orthogonal signal correction (OSC) of exhaled breath condensate metabolites in patients with CF compared with healthy control subjects. (A) Score plot showing the degree of separation of the model between healthy subjects (closed circles) and patients with CF (open circles). t[1] and t[2] represent the scores (the ‘first two partial least squares components’) of the model, which are sufficient to build a satisfactory classification model. The model showed a strong regression (96%). (B) Variables of importance plot (VIP) which represents the 14 most important ‘buckets’ (11 metabolites) generating this model (R2=0.84 and Q2=0.79). Metabolite assignments are indicated together with the corresponding chemical shift. Ethanol and 2-propanol are reported more than once as their different chemical groups resonate at different frequencies. The x-axis reports the buckets, identified with chemical shift (in ppm) and metabolite name, and is labelled ‘VAR-ID’ (variable identity); the y-axis, labelled ‘VIP[2]’, shows the strength of the labelled metabolites in the classification between patients with CF versus healthy subjects. Error bars represent 95% CIs.
NMR profiling of EBC discriminates between patients with stable and unstable CF
PLS-DA yielded a model of patients with stable (n=29) versus unstable (n=24) CF which resulted in three predictive and three orthogonal components (R2=0.82, Q2=0.78; figure 3A).

Stable versus unstable cystic fibrosis (CF). (A) Partial least squares-discriminant analysis (PLS-DA) with the spectral filtering orthogonal signal correction (OSC) of exhaled breath condensate metabolites in subjects with stable CF (blue dots) compared with subjects with unstable CF (red dots). t[1], t[2] and t[3] along the axes represent the scores (the ‘first three partial least squares components’) of the model, which are sufficient to build a satisfactory classification model. (B) Variables of importance plot (VIP) which represents the nine most important metabolites generating this model (R2=0.82 and Q2=0.78). Metabolite assignments are indicated together with the corresponding chemical shift. Ethanol and 2-propanol are reported more than once as their different chemical groups resonate at different frequencies. The x-axis reports the buckets, identified with chemical shift (in ppm) and metabolite name, and is labelled ‘VAR-ID’ (variable identity); the y-axis, labelled ‘VIP[2]’, shows the strength of the labelled metabolites in the classification between patients with stable versus unstable CF. Error bars represent 95% CIs.
To validate this model, a sample set obtained from subjects not included in the primary analysis (14 patients with stable CF and 16 with unstable CF; table E1 in online supplement) was tested blindly. The model correctly identified 12 out of 14 patients with stable CF (86% accuracy) and 15 out of 16 patients with unstable CF (94% accuracy) with a sensitivity of 86%, a specificity of 94%, LR+ of 15 and LR− of 0.14.
Four metabolites differentiate classes
The variables responsible for between-class differences observed in the score plot can be identified from the loading plot (see figure E1 in online supplement) which reports the spectral ‘buckets’ containing metabolite resonances. The variables of importance plot (VIP) describes the most important metabolites in making the model accurate. The first 14 buckets (corresponding to 11 metabolites) separate patients with CF (n=53) from healthy subjects (n=31) (figure 2B). Ethanol and 2-propanol appear more than once as their different chemical groups resonate at different frequencies (figure 2B).
Differences between patients with stable and unstable CF are based upon the spectral ‘buckets’ of the corresponding loading plot (see figure E2 in online supplement). The nine most relevant buckets (seven metabolites) generating the model are shown in the VIP (figure 3B). Ethanol and 2-propanol are reported twice as their different chemical groups resonate at different frequencies (figure 3B).
Not all metabolites shown in figures 2B and 3B are required for between-group classification. The first four metabolites—namely acetate, ethanol, 2-propanol and acetone signals at 1.93, 1.19, 1.17 and 2.23 ppm, respectively—discriminate between patients with CF and healthy subjects (R2=0.81, Q2=0.73; figure 2B). Likewise, ethanol, acetate, 2-propanol and methanol signals at 1.19, 1.93, 1.17 and 3.37 ppm, respectively, discriminate between patients with stable and unstable CF (R2=0.80, Q2=0.65; figure 3B). These data suggest that a limited number of metabolites can be used to pinpoint some of the metabolic changes in CF.
Figure 4 represents the difference between the coefficients of variation plots of the four selected metabolites between healthy subjects and patients with CF (ie, healthy subjects minus patients with CF) (figure 4A), and the difference between patients with stable and unstable CF (figure 4B). Acetate is higher in healthy subjects than in patients with CF whereas ethanol, 2-propanol and, to a much lesser extent, acetone are higher in patients with CF than in healthy subjects (figure 4A). Within CF patients, ethanol and 2-propanol are higher in those with stable CF whereas acetate and methanol are higher in patients with unstable CF (figure 4B). These data indicate that selective profiles of EBC metabolites might be useful for identifying biomarkers of CF. Estimated metabolite concentrations are reported in table E2 in the online supplement.

A panel of four metabolites differentiates exhaled breath condensate classes. The four selected metabolites which differentiate (A) healthy subjects from patients with cystic fibrosis (CF) (R2=0.81 and Q2=0.73) and (B) patients with stable CF from those with unstable CF (R2=0.80 and Q2=0.65) are reported as differences of coefficients of variation plots (ie, healthy subjects minus patients with CF and patients with stable CF minus patients with unstable CF). Metabolite assignments are indicated together with the corresponding chemical shift. Error bars represent 95% CIs.
NMR spectra of EBC are reproducible
All peaks were used for assessing within-day repeatability. Each spectrum was subdivided into six regions which were integrated and normalised to the total spectrum area (see online supplement). The SD was within ±1.96 SD in 94 out of 96 samples (see figure E3 in online supplement), indicating a good within-day repeatability.
Between-day repeatability was expressed as ICC of the 4.4–0.4 ppm spectral region which contains all the relevant signals shown in figures 2B and 3B. The ICC was 0.93.
Technical repeatability was assessed by repeating NMR spectroscopy on three different samples (one from a healthy subject, one from a patient with stable CF and one from a patient with unstable CF) 10 times consecutively. The ICC for the 4.4–0.4 ppm spectral region was 0.96.
No effect of salivary contamination or cleaning solution on EBC profiles
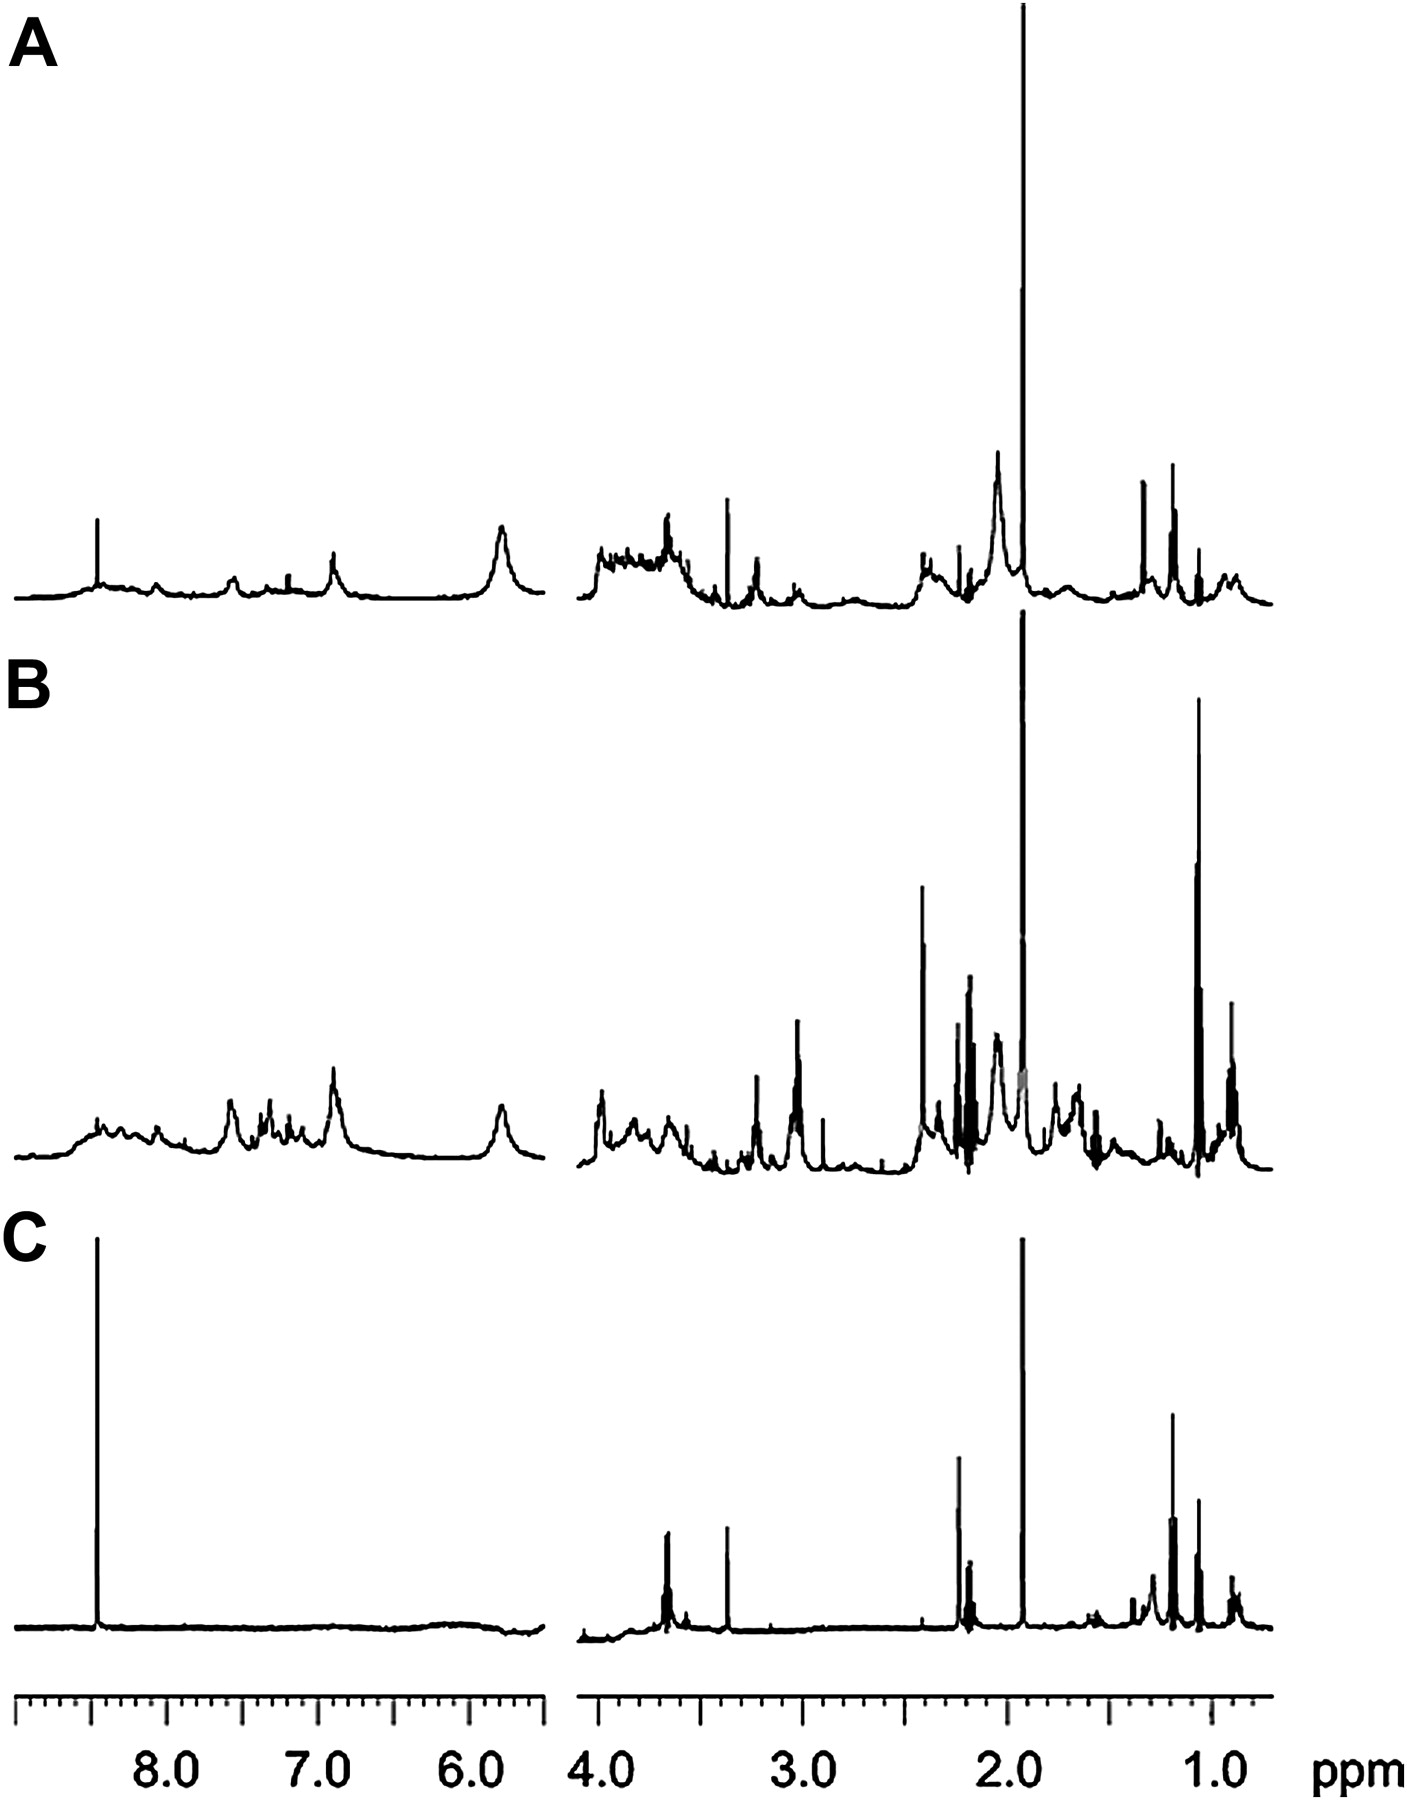
Saliva and EBC spectra were different, indicating no significant salivary contamination of EBC (figure 5). No peak was observed in the spectrum of the sodium hypochlorite solution (3.55 mM) used for disinfection of the EBC collection set-up (not shown), indicating that the cleaning procedure does not affect the results.
Nuclear magnetic resonance (NMR) spectroscopy of exhaled breath condensate (EBC) and saliva. Representative one-dimensional 1H-NMR spectra of (A) EBC spiked with saliva, (B) saliva and (C) EBC samples from a patient with cystic fibrosis (CF). The saliva sample shows signals between 3.3 and 4.5 ppm originating from carbohydrates (B), which are virtually absent in the EBC spectrum (C). In the EBC spectrum of a patient with CF spiked with his saliva (A), the overall resonance distribution indicates the presence of saliva. Absorption (related to the intensity) is plotted on the y-axis and magnetic field strength is plotted on the x-axis (scale is in parts per million (ppm) and usually ranges from 0 to 12 ppm).
Correlations
There was no correlation between metabolomic data and spirometry in any study group. In the CF groups there was no correlation between EBC metabolites and type of bacterial infection or genotypes. In patients with stable CF there was no correlation between metabolomic profiles and tobramycin or human recombinant DNase treatment. Assessing other correlations was difficult because of the small numbers of patients in some subgroups (table 1).
Discussion
The novel features of our study are: (1) the demonstration that NMR-based metabolomics can be applied to EBC to discriminate between patients with CF and age-matched healthy control subjects and, more interestingly, between patients with stable and unstable CF; (2) the use of high resolution 2D-NMR spectroscopy which enables the highly specific identification of the EBC metabolites that account for between-group differences; (3) the external validation of these results in independent datasets; and (4) the largest application of NMR spectroscopy to CF to date.
The technique has good within-day, between-day (ICC=0.93) and technical repeatability (ICC=0.96). A detection limit of 0.14 μM, notably low for NMR-based metabolomics,21 indicates that it can be exploited for a more complete profiling of EBC metabolites.
Unsurprisingly given the complexity of CF,1 profiles of metabolites rather than a single metabolite are needed to enable between-group discrimination. In previous studies, several metabolites have been identified in the exhaled breath in healthy subjects22–24 and in patients with CF.24–28 In the present study in EBC, most of the variance between patients with CF and healthy subjects depends upon ethanol, acetate, 2-propanol and acetone, whereas acetate, ethanol, 2-propanol and methanol are the most important metabolites for discriminating between patients with stable and unstable CF. Although similar metabolites are present in all study groups, their different distribution allows for this classification. Compared with healthy subjects, ethanol, 2-propanol and, to a much lesser extent, acetone concentrations in EBC were increased in patients with CF (stable and unstable), whereas acetate was reduced. Patients with unstable CF had higher methanol and acetate concentrations in EBC and lower ethanol and 2-propanol than those with stable CF. Metabolite differences in opposite directions in patients with CF and healthy subjects suggest that the differences are not a dilutional artefact. Moreover, referencing each bucket to the corresponding total spectral area and the spectra to a known concentration of TSP added to the samples normalised for possible signal variation due to EBC dilution.
It is possible that differences in EBC metabolites between patients with CF and healthy subjects might be partially due to medications (healthy subjects received no treatment). It is not ethical to stop treatment in patients with CF. Pharmacological treatment is less likely to be responsible for the differences in EBC metabolites between patients with unstable and stable CF observed in our study as the numbers treated with inhaled corticosteroids (ICS) and short-acting β agonists (SABA) were similar in the two groups (table 1), indicating that ICS/SABA treatment has little effect on the results. There were no differences in a subgroup of stable CF patients between those who were and were not being treated with either inhaled tobramycin or recombinant human DNase (see Results, Subgroup analysis in online supplement). However, the cross-sectional design of this study precludes definitive conclusions on the effects of these drugs in patients with CF. Large prospective controlled studies to establish the effect of pharmacological treatment on EBC metabolites in patients with CF are required.
Acetic acid, acetone, ethanol, 2-propanol and methanol have previously been detected in exhaled breath in healthy subjects.23 29 30 Using 1H-NMR, acetone was detected in the bronchoalveolar lavage fluid of children with CF with varying levels of inflammation.13 2-Propanol, an enzyme-mediated product of reduction of acetone, was demonstrated in a breath sample from one patient with CF infected with Pseudomonas aeruginosa.31 We speculate that the elevated EBC ethanol concentrations in patients with CF may be related to the reduced capacity of Pseudomonas aeruginosa to oxidise ethanol to acetate,32 whereas the elevated EBC 2-propanol concentration might be due to bacterial metabolism and/or increased lipolysis and lipid peroxidation.31 Elevated EBC acetate concentrations in healthy subjects could reflect metabolism of oral resident bacteria such as Streptococcus mutans, which degrades pyruvate into end products of metabolism including acetate and lactate.33
There are other factors to be considered in the interpretation of the results. NMR-based metabolomics is not affected by the cleaning procedure used in this study.34 We cannot ascertain the source(s) of EBC metabolites. Salivary and EBC NMR spectra are completely different, suggesting that salivary contamination is unlikely. Furthermore, EBC metabolite signals are obtainable in tracheostomised patients in whom there can be no salivary contamination.11 However, normal bacterial flora or the pathogens characteristic of CF35 may have been the source of some of the signals. Determining whether EBC metabolites are of host or microbial origin is difficult owing to the heterogeneous population of CF pathogens, the lack of specificity of many metabolites to either the host or microbial metabolome and the complexity of the host–microbial interactions in CF. Further studies are required to establish the specific origin of EBC metabolites, including the effect of anaerobic, fungal or mycobacterial infections. However, the aim of this study was to determine whether disease states could be differentiated, not the site of origin of the metabolites. Indeed, if the metabolites are discriminatory, their precise site of origin is less important to the clinician.
NMR-based metabolomics of EBC may be a useful contribution to the definition and management of a CF infective exacerbation, although longitudinal studies are required to confirm this. Ascertaining whether, and after how long, intravenous antibiotic treatment in patients with unstable CF reverts EBC metabolic profiles to those observed in patients with stable CF was beyond the scope of the present study, but would clearly need to be performed to evaluate the clinical utility of the measurements. We plan to perform a study to address this issue.
In conclusion, NMR spectroscopy of EBC can be used to discriminate patients with CF from healthy subjects and between patients with unstable and stable CF. This technique allows identification of unbiased potential biomarkers of CF, some of which may be useful surrogate endpoints in clinical trials, and also unravels the metabolic changes that characterise this disease.
Acknowledgments
We thank Matteo Stocchero, S-IN Soluzioni Informatiche (Vicenza, Italy) for helpful discussions on the merits of PLS-DA.
References
Supplementary materials
Supplementary Data
This web only file has been produced by the BMJ Publishing Group from an electronic file supplied by the author(s) and has not been edited for content.
Files in this Data Supplement:
- Download Supplementary Data (PDF) - Manuscript file of format pdf
- Download Supplementary Data (PDF) - Manuscript file of format pdf
- Download Supplementary Data (PDF) - Manuscript file of format pdf
- Download Supplementary Data (PDF) - Manuscript file of format pdf
- Download Supplementary Data (PDF) - Manuscript file of format pdf
Footnotes
PM, DP, DM contributed equally to this work.
Funding Catholic University of the Sacred Heart, Academic Funds 2009–2011, Italian National Research Council (CNR), Italian Cystic Fibrosis Research Foundation.
Competing interests None.
Ethics approval Ethics approval was provided by Ospedale Pediatrico Bambino Gesù, Rome and University of Naples Federico II, Italy.
Provenance and peer review Not commissioned; externally peer reviewed.