Article Text

Abstract
Background In lung cancer screening the ability to distinguish malignant from benign nodules is a key issue. This study evaluates the ability of positron emission tomography (PET) and volume doubling time (VDT) to discriminate between benign and malignant nodules.
Methods From the Danish Lung Cancer Screening Trial, participants with indeterminate nodules who were referred for a 3-month rescan were investigated. Resected nodules and indolent nodules (ie, stable for at least 2 years) were included. Between the initial scan and the 3-month rescan, participants were referred for PET. Uptake on PET was categorised as most likely benign to malignant (grades I–IV). VDT was calculated from volume measurements on repeated CT scans using semiautomated pulmonary nodule evaluation software. Receiver operating characteristic (ROC) analyses were used to determine the sensitivity and specificity of PET and VDT.
Results A total of 54 nodules were included. The prevalence of lung cancer was 37%. In the multivariate model both PET (OR 2.63, p<0.01) and VDT (OR 2.69, p<0.01) were associated with lung cancer. The sensitivities and specificities of both PET and VDT were 71% and 91%, respectively. Cut-off points for malignancy were PET >II and VDT <1 year, respectively. Combining PET and VDT resulted in a sensitivity of 90% and a specificity of 82%; ROC cut-off point was either PET or VDT indicating malignancy.
Conclusion PET and VDT predict lung cancer independently of each other. The use of both PET and VDT in combination is recommended when screening for lung cancer with low-dose CT.
- Lung cancer
- computer tomography
- positron-emission tomography
- computer aided detection
- screening
- imaging/CT MRI etc
- lung cancer
Statistics from Altmetric.com
- Lung cancer
- computer tomography
- positron-emission tomography
- computer aided detection
- screening
- imaging/CT MRI etc
- lung cancer
Introduction
In an effort to improve the prognosis of lung cancer, there has been a focus on screening with low-dose multi-detector CT scanning1–4 with the aim of detecting lung cancer at an early stage and thus to improve the prognosis.5–8 Nodules detected on screening are assessed by morphological features or repeated scans.9 In cases of suspected malignancy, the patient is referred for further diagnostic investigation. The ability to distinguish malignant from benign nodules is a key issue.
Positron emission tomography (PET) has been shown to discriminate between malignant and benign nodules.10 Increased cell metabolism in malignant nodules can be visualised by increased uptake of 18F-fluorodeoxyglucose (18F-FDG) on a PET scan. 18F-FDG PET combined with CT is very useful for preoperative staging of lung cancer.11 However, in screening situations the value of PET is unclear because the majority of detected nodules are small, approaching the resolution power of PET scanners.
Possible growth of lung nodules can be assessed by repeat CT scans where rapid growth rate is a feature of malignancy, and benign nodules usually grow more slowly.6 9 12 13 Nodules that stay stable over a period of at least 2 years have a low probability of malignancy and are usually categorised as indolent lesions.14 15 Volume doubling time (VDT) of nodules is therefore a key parameter in lung cancer screening. VDT is defined as the number of days in which the nodule doubles its volume. Low VDT indicates rapid growth and a VDT of <400 days has been suggested as the best cut-off between indolent and malignant lesions.9 16
The volume of a nodule can be determined manually or by semiautomatic computer-aided detection (CAD) software.17–19 The software requires skilled human interface as the nodules have to be selected before the volume analysis. This technique is a reproducible and promising new field in early lung cancer detection and diagnosis.20–22
The aim of this study was to evaluate the ability of PET alone, VDT alone and the combination of PET and VDT to discriminate between benign and malignant nodules found to be indeterminate for malignancy in a lung cancer screening trial with low-dose CT.
Methods
Study population
The study population was selected from the Danish Lung Cancer Screening Trial (DLCST).6 The DLCST is a randomised 5-year trial investigating the effect of annual screening with low-dose CT on the mortality of patients with lung cancer. Participants were aged 50–70 years at inclusion, of both sexes, current or former smokers with a smoking history of >20 pack-years. Individuals with a history of lung cancer, breast cancer, melanoma, hypernephroma or any other cancer for the past 5 years or tuberculosis for the past 2 years or any serious illness that would shorten life expectancy to <10 years were also excluded.6
Imaging
All CT scans in the DLCST were performed on a MDCT scanner (16-slice Philips Mx 8000) at Gentofte University Hospital. Scans were performed supine after full inspiration with a caudo-cranial scan direction including the entire rib cage and with a low-dose technique with 140 kV and 40 mAs. Scans were performed with spiral data acquisition with the following acquisition parameters: collimation 16×0.75 mm, pitch 1.5 and rotation time 0.5 s. Images were reconstructed with 3 mm slice thickness using a soft algorithm.6
Low-dose CT screening
Two radiologists (KB, HH) independently assessed the CT images; in the case of disagreement, consensus was obtained through a joint meeting between the two radiologists and a pulmonologist (AD). The radiologists mainly used manual measurements for investigation of nodules.6 Nodules were categorised into different groups on the basis of size and morphology as part of the DLCST nodule investigation: nodules up to 20 mm in maximal diameter with benign characteristics (calcified nodules) and nodules below 5 mm were tabulated and no further action was taken. Solid nodules with a diameter of 5–15 mm and non-solid nodules up to 20 mm not classified as benign were considered indeterminate and were rescanned after 3 months. The analysis of these nodules is the aim of this study. Between the initial scan and the rescan after 3 months, participants with indeterminate nodules were referred for a PET scan at Rigshospitalet. Nodules exceeding 15 mm (non-solid nodules >20 mm) were referred for diagnostic investigation and are not included in this study.
Nodule selection
Included were all indeterminate nodules which were both rescanned after 3 months and scanned by PET. If the CT scan demonstrated growth a biopsy was performed. Significant growth was defined as growth of >25%. If the nodule had not increased in size it was assessed at the next planned annual CT screening scan. Only nodules where a diagnosis was obtained by biopsy or nodules that were stable or regressed during a 2-year period were eligible for this study. The first nodule was included in June 2005 and the last in November 2008. To ensure at least 2 years of stability or regression, nodules detected after April 2007 were only included if a biopsy with a final diagnosis was obtained.
Volume analysis
The selected nodules were retrospectively analysed using Siemens syngo LungCARE CT version VE25A, CAD software that allows for volumetric three-dimensional analysis of lung nodules. Siemens syngo LungCARE CT was validated by double reading analyses and is used in both the DLCST and the Dutch-Belgian screening trial (NELSON).23 With this software the volume of the nodule can be calculated and possible growth between the initial scan and the 3-month rescan determined. From the volume measurements and the time between the measurements, it is possible to calculate the VDT using the following formula9:
where ∆t is the time (days) between scans (approximately 3 months), V1 is the initial volume and V2 the volume 3 months later. If a reliable volume estimate could not be made owing to software limitations, manual measurements performed by the radiologist were used to determine volume and possible growth between scans. To determine the volume manually, the x,y,z dimensions of the nodule were multiplied and afterwards divided by 2 to avoid overestimation of the volume.
Positron emission tomography (PET)
The FDG-PET low-dose CT scan was obtained in the PET section at Rigshospitalet. The screening unit only provided information regarding the location and size of the indeterminate nodule. After a 6 h fast, 400 MBq 18F-FDG was given intravenously and, after resting for 1 h, the patient was scanned over the chest with the use of an integrated PET/CT system (GE Discovery LS, GE Medical Systems, Milwaukee, WI, USA or Siemens Biograph, Siemens Medical Solutions, Knoxville, TN, USA). PET was acquired with 5 min emission scan per table position and reconstructed by filtered back projection and ordered-subset expectation maximization (OSEM) with data from the low-dose CT scan (50 mAs, 120 kV, 0.5 s per rotation, pitch of 6 and 3 mm slice thickness) used for attenuation correction.
Two specialists in nuclear medicine (AL, JM) visually evaluated the 18F-FDG-PET uptake of the lung nodule and compared it with the background area surrounding the nodule and the blood pool of the mediastinum. The 18F-FDG uptake was scaled from I to IV with increasing uptake:
Probably benign nodule (lower or same level as background and lower than mediastinum).
Possibly benign (higher than background and lower than mediastinum).
Possibly malignant (higher than background and same level as mediastinum).
Probably malignant (higher than background and higher than mediastinum).
A standardised uptake value was not used since, in our experience, the result is unreliable in small sized nodules.24 The result of the PET scanning was not revealed to the screening unit and was performed only for research purposes and had no clinical implications.
Statistics
The characteristics of the participants were compared using the Student t test and the χ2 test where appropriate. VDT was transformed to 365/VDT to ensure a monotonic increase in the risk of malignancy and a (more) normal distribution. Moreover, VDT was defined as positive for growing nodules and negative for nodules that regressed. For nodules of unchanged size at the 3-month rescan, 365/VDT was set to 0. The latter proved to be the case only for nodules that were measured manually by the radiologists. For nodules regressing completely, 365/VDT was set to −5 corresponding to a half-life of a couple of months.
Based on VDT, nodules were categorised into three groups: regressing nodules (group 1, VDT ≤0), slowly growing nodules (group 2, VDT >1 year (365 days)) and rapidly growing nodules (group 3, VDT ≤1 year (365 days)).
The ability of PET and VDT to distinguish between malignant and benign nodules was analysed using logistic regression models with cancer/benignity as outcome and PET, VDT and other characteristics (see table 1) as explanatory variables (univariate analysis). Variables reaching the level of significance were included in a multivariate logistic regression model and residual analysis was used to assess goodness of fit (table 2). Finally, PET and VDT were analysed as diagnostic tools using receiver operating characteristic (ROC) curves. R statistical software version 2.7.1 was used for the statistical analyses with a significance level of 0.05.
Characteristics of study participants and nodules
Logistic regression analysis with cancer/benignity as outcome
Results
The inclusion criteria were met by 53 participants with a total of 54 nodules and the prevalence of cancer was 37% (20/54). All cancers were pathologically verified by biopsy. Two benign nodules underwent invasive intervention with a final diagnosis of harmatoma and granulomatous disease, respectively. The remaining 32 nodules were classified as benign/indolent because of 2 years of stability or regression. One patient participated twice in the study. He had two nodules, one of which was detected at baseline (benign/indolent nodule) and the other at the incidence round (malignant nodule). The characteristics of the patients and nodules are shown in table 1.
Two nodules regressed completely, 15 regressed partly (ie, had a negative VDT), eight were stable and 29 grew larger (ie, had a positive VDT). The eight nodules designated as stable could not be segmented correctly by the LungCARE software so the radiologists' manual measurements were used. These eight nodules had all been stable for at least 2 years and were classified as benign/indolent. Of the 29 nodules that grew larger, 12 had a VDT of >1 year and the remaining 17 had a VDT of <1 year.
Logistic regression analyses
In univariate logistic regression analysis with cancer/benignity as the outcome, the screening round (prevalence or incidence), PET and VDT were the only characteristics that were statistically significant (table 1). PET and VDT were highly and equally significant (p<0.001), whereas the screening round had a relatively low significance (p=0.030) which disappeared in multivariate models that included either PET or VDT. The best multivariate model included both PET and VDT as categorical variables and the results are shown in table 2. The overall fit of the model was p<0.005. The ORs for PET and VDT group I and 1 were set as referents (OR=1).
ROC analysis of PET and VDT alone and in combination
Categorical PET (I–IV) and VDT (1–3) values are shown as ROC curves in figure 1. The best cut-off points giving the best combination of sensitivity and specificity were between groups II (possibly benign) and III (possibly malignant) for PET and between groups 2 and 3 (doubling time <1 year) for VDT. When using these cut-off values, the sensitivity was 71% and the specificity 91% for both PET and VDT. The 95% CIs for PET sensitivity and specificity were 46% to 86% and 77% to 98%, respectively, and for VDT the 95% CIs were similar at 46% to 86% and 76% to 98% for sensitivity and specificity, respectively. Based on the cut-off values, a combined variable was constructed as follows:
Group A: Both PET and VDT indicated benignity (ie, PET≤II and VDT≤2).
Group B: Either PET or VDT indicated malignancy (ie, PET≥III or VDT=3).
Group C: Both PET and VDT indicated malignancy (ie, PET≥III and VDT=3).

Receiver operating characteristic curves for positron emission tomography (PET), volume doubling time (VDT) and a combination of the two.
The combined variable showed the best combination of sensitivity (90%) and specificity (82%) at a cut-off between groups A and B. Cancer rates for each combination of PET and VDT are shown in table 3. The rate at which nodules were categorised falsely was 5% (2/40) when PET and VDT agreed (PET+VDT group A and C) and 43% (6/14) when PET and VDT differed (PET+VDT group B, p=0.003).
Combining PET and VDT
In the 14 cases in which PET and VDT differed (group B), there were seven nodules in both the PET positive/VDT >1 year and PET negative/VDT <1 year groups. There were four cancers in each of these groups, giving a total of eight cancers when PET and VDT differed. The best cut-off value giving the best combination of sensitivity (90%, 95% CI 68% to 99%) and specificity (82%, 95% CI 66% to 93%) was seen when PET and VDT differed (group B, table 3)—that is, the criteria for a positive combined PET and VDT test indicating malignancy was when one or both of the tests were positive. The positive likelihood ratio (+LR) was 5.1 (95% CI 4.1 to 6.3) and the negative likelihood ratio (−LR) was 0.12 (95% CI 0.0 to 0.5).
If, instead, the criterion for malignancy is that both PET and VDT should be positive (group C, table 3), the sensitivity was 50% (95% CI 27% to 73%) and the specificity was 100% (95% CI 90% to 100%) but the LRs were not applicable because the specificity is 100%.
Discussion
When screening for lung cancer, unnecessary invasive surgical procedures for benign lung nodules should be kept to a minimum. The substantial risk incurred by surgical resection of a nodule suspected of being malignant should not be underestimated. Even though minimal invasive techniques are available, not all hospitals offer these treatments. In many cases the resection is only possible with an open thoracotomy procedure. This increases the risk of complications and mortality, which ultimately can damage the potential beneficial effect of lung cancer screening. On the other hand, correct diagnosis of a malignant nodule is essential for the survival of patients with lung cancer. The use of diagnostic tools that can distinguish benign from malignant nodules is therefore crucial before deciding whether or not a nodule should be examined by an invasive procedure.
In this study both PET (OR 3.7, p=0.003) and VDT (OR 3.3, p=0.006) were associated with lung cancer in the multivariate logistical model (table 2). PET and VDT may therefore predict lung cancer independently of each other. The fact that both PET and VDT were significant in the multivariate analysis indicates that a combination of the two was better at predicting lung cancer than either procedure alone.
In the ROC analysis, cut-off values for malignancy using VDT (<365 days) and PET (>II, ie, probably or likely malignant) are consistent with earlier clinical trials.9 10 This resulted in the highest sensitivity (71%) and specificity (91%) for both PET and VDT. Combining PET and VDT using the cut-off value from the ROC analysis resulted in the highest sensitivity (90%) and specificity (82%), which again underlines the additive effect of PET and VDT (table 3). The cut-off value was malignancy indicated by either PET or VDT, in which case the likelihood of malignancy increased approximately fivefold (+LR=5.1) As an example, if the pre-test probability of malignancy is 50%, the post-test probability will be >80%. If both PET and VDT are negative the –LR of 0.12 indicates that, for a pre-test probability of 50% for malignancy, the post-test probability is <10%.
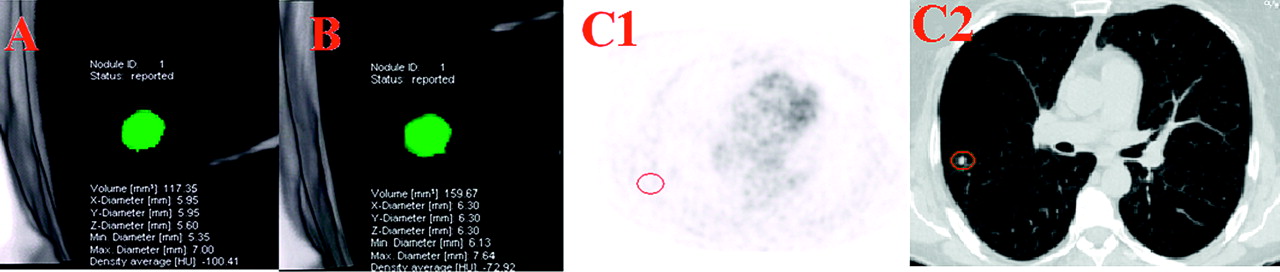
Our study suggests that, when PET and VDT are in accordance, there is only a small probability of false diagnosis (5%) compared with when PET and VDT differ (43%, p<0.01; figures 2 and 3). We therefore recommend nodules to be considered benign/indolent when both PET and VDT are negative. These nodules should be scheduled for rescanning after a year as part of the regular screening regime. If both PET and VDT indicate malignancy (ie, a positive PET result and a VDT of <1 year), we recommend referral for invasive diagnostic investigation because of a high probability of cancer. In fact, in our study all cases with positive PET and VDT were malignant. Ideally, this should be done with the use of video-assisted thoracoscopic surgery (VATS), with which the DLCST has had good experience.6 VATS is minimally invasive and therefore the complication rate is kept low, which is preferable, especially in screening settings.

Positron emission tomography (PET) and volume doubling time (VDT) differ. Volumetric measurement of a nodule at (A) baseline and (B) 3 months later at rescan. VDT was calculated as 186 days. The PET scan (C1) was negative (area with nodule highlighted by red circle). A transverse CT scan (lung window) (C2) showing a nodule at baseline in the right lung. The nodule was removed and was diagnosed as lung cancer (adenocarcinoma).

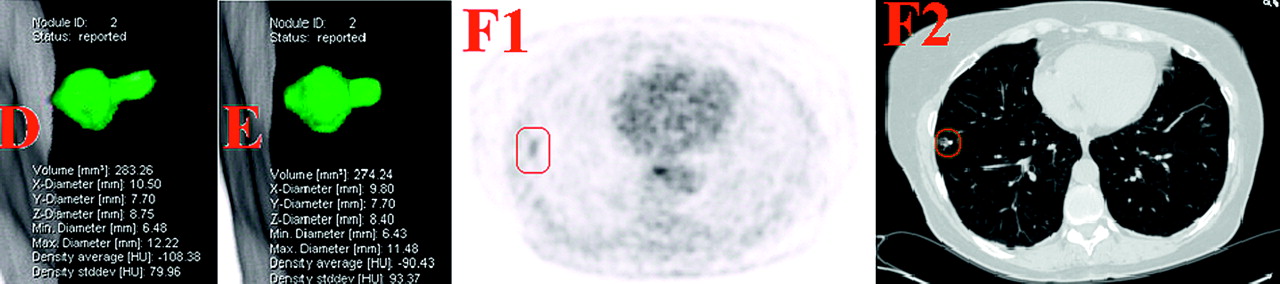
Positron emission tomography (PET) and volume doubling time (VDT) differ. Volumetric measurement of a nodule (D) at baseline and (E) 3 months later at rescan. VDT was calculated as −1949 days. The PET scan (F1) was positive (area with nodule highlighted by red circle). A transverse CT scan (lung window) (F2) showing a nodule at baseline in the right lung. The nodule was removed and was diagnosed as lung cancer (adenocarcinoma).
If PET and VDT differ, the outcome seems more uncertain as 57% of the nodules were malignant and 43% benign/indolent (table 3). We do not recommend surgical removal of these nodules owing to the associated risk and because a considerable number are benign. However, since the risk of malignancy is substantial, a CT-guided biopsy of the nodules is one option—depending on local expertise and morphology of the nodule. Close follow-up is another option since this allows the development of the nodule to be monitored. A 3-month rescan, which is part of the diagnostic investigation in most screening trials, may well be beneficial in the diagnostic clarification of these nodules.
Former screening studies have focused on growth and found that VDT alone is a sufficient predictor for malignancy.9 25 However, we found that slow growing nodules (VDT >1) and even nodules that decrease in size13 may prove to be malignant. Combining growth with other diagnostic tests such as PET therefore seems reasonable.
This study has some limitations. First, a larger number of nodules is warranted. A significant proportion of the benign nodules were found in the prevalence round owing to the inclusion criteria in which 2 years stability was necessary; this could only be ensured in nodules from the prevalence round. The 2-year stability definition for benign nodules is broadly accepted,14 15 but it may prove to be inadequate,26 especially for nodules detected by screening which may comprise slowly growing cancers. The term ‘benign/indolent’ nodule has therefore been used. Finally, the software used for the volumetric analysis was limiting as it was unable to segment nodules correctly in eight cases. This limitation is well-known as a software evaluation study23 has shown that, even though software analysis is reproducible, not all nodules—especially pleural based and ground glass opacities—are suitable for software volumetric segmentation. Manual interaction is therefore required in some cases for the diagnostic investigation of nodules detected by screening. It could be argued that these manually measured nodules should be excluded, but we felt it necessary to resemble the everyday clinical situation in which the software cannot be used alone as manual measurements are necessary to ensure evaluation of some lung nodules.
In conclusion, we found PET and VDT to be useful tools in the diagnostic investigation of nodules detected by screening. Both were associated with lung cancer independently of each other and both supplemented each other. Our study suggests that a PET positive nodule with a VDT <1 year has a high probability of malignancy and invasive diagnostic investigation should be conducted. Negative results from PET and VDT suggest an indolent lesion. When the PET and VDT results differ, close follow-up is necessary because of a high probability of malignancy. We recommend the use of both PET and VDT in combination for diagnostic investigation of indeterminate nodules detected by screening.
Acknowledgments
The authors are grateful for the comments and suggestions from the other members of the steering committee of the Danish Lung Cancer Screening Trial: Philip Tønnesen, Niels Seersholm, Paul Clementsen, Birgit Guldhammer Skov, Martin Døssing, John Brodersen, Hanne Thorsen and Klaus Ricther Larsen.
References
Footnotes
Funding The Danish Lung Cancer Screening Trial receives financial support from the Danish Government.
Competing interests None.
Ethics approval The Danish Lung Cancer Screening Trial was approved by the ethical committee of Copenhagen County on 31 January 2003. Approval of data management in the trial was obtained from the Danish Data Protection Agency on 11 February 2005.
Provenance and peer review Not commissioned; externally peer reviewed.
Linked Articles
- Editorial
- Editorial
- Editorial
- Airwaves