Article Text

Abstract
Patients with obstructive sleep apnoea (OSA) have reduced event rates during slow wave sleep (SWS) compared with stage 2 sleep. To explore this phenomenon, ventilatory and arousal timing responses to partial and complete airflow obstruction during SWS versus stage 2 sleep were examined.
Methods Ten patients, mean±SD apnoea–hypopnoea index (AHI) 49.7±16.5 events/h with reduced OSA frequency during SWS (SWS AHI 18.9±14.0 events/h) slept with an epiglottic pressure catheter and nasal mask/pneumotachograph. Patients underwent rapid continuous positive airway pressure (CPAP) dialdowns to three subtherapeutic levels and brief airway occlusions in random order.
Results Post-dialdown, there were marked reductions in peak flow and minute ventilation, and progressive increases in inspiratory effort (p<0.001), but with limited ventilatory recovery and no differences between sleep stages. CPAP versus peak flow relationships on the third and second to last breath pre-arousal were not different between sleep stages. Arousals occurred later and post-dialdown arousal probability was lower during SWS compared with stage 2 sleep, Cox hazard ratio (95% CI) 0.65 (0.48 to 0.88), p=0.006. During SWS occlusions, time to arousal (mean±SEM) was prolonged (23.0±2.6 vs 17.1±1.7 s, p=0.02). Inspiratory effort developed more rapidly (−1.0±0.2 vs −0.6±0.1 cm H2O/s, p=0.019) and was more negative (−28.7±2.7 vs −20.3±1.6 cm H2O, p<0.001) on the breath preceding arousal.
Conclusions Except for a heightened ventilatory drive response during airway occlusion, airway function and ventilatory compensation to ventilatory challenge appear to be similar, but with consistently and substantially delayed arousal responses, in SWS versus stage 2 sleep.
- Obstructive sleep apnoea
- sleep stages
- arousal
- respiratory physiology
- continuous positive airway pressure
- sleep apnoea
Statistics from Altmetric.com
- Obstructive sleep apnoea
- sleep stages
- arousal
- respiratory physiology
- continuous positive airway pressure
- sleep apnoea
Introduction
In an observational study in patients with obstructive sleep apnoea (OSA) we have previously shown that the frequency of obstructive events is markedly reduced during slow wave sleep (SWS) compared with lighter non-rapid eye movement (non-REM) sleep.1 One possible explanation is that the development of upper airway and ventilatory stability allows progression into SWS, which would otherwise be more difficult with continued disordered breathing. Alternatively, some feature of SWS per se may stabilise upper airway function, allowing relative ventilatory and sleep stability via greater resistance to airway collapse and/or heightened neuromuscular compensation to challenged airway function. This could be due to an increased arousal threshold to respiratory stimuli,2 ,3 which may simply allow for more time to stiffen and/or dilate the obstructed upper airway via mechanoreceptor/chemoreceptor-mediated stimuli,4 ,5 thereby stabilising ventilation while the patient remains asleep. It is also possible that as a result of an increased arousal threshold in SWS there are fewer arousals overall, and thus less tendency to post-arousal overshoot–undershoot6 in respiratory drive that may help perpetuate cyclical airway collapse.
There are conflicting data regarding sleep stage specific differences in upper airway function. Upper airway resistance has been shown to be elevated during SWS.7 When assessed by an upper airway occlusion technique, Issa et al 8 found that the upper airway in OSA patients was more resistant to collapse during SWS, compared with stage 1 and 2 sleep. In apparent contrast, passive upper airway function assessed via the critical closing pressure (PCRIT) technique does not appear to improve in SWS.9 Increased genioglossus electromyography (EMG) activity during SWS compared with light sleep10 could indicate improved upper airway control, or simply reflect higher overall ventilatory drive associated with increased upper airway resistance.7 In healthy volunteers, the hypercapnic ventilatory response11 and the increase in respiratory effort following complete upper airway occlusion do not appear to be different between light sleep and SWS.3 These responses have not been examined in patients with OSA.
The purpose of this study was to challenge upper airway function during stage 2 sleep versus SWS in patients with OSA to test the hypotheses that (1) basic airway function and (2) compensatory ventilatory drive and output responses are increased, and (3) delayed arousal via an increased arousal threshold permits greater ventilatory drive and compensation before arousal in SWS compared with stage 2 sleep.
Methods
Further details regarding the study methods appear in the online supplement.
Subjects
The Repatriation General Hospital Research and Ethics committee approved the study, and 14 patients participated after providing written informed consent. Review of polysomnography studies was used to select patients with moderate to severe OSA (overall AHI ≥30/h) who showed significant improvement in SWS (at least a 40% improvement in AHI compared with stage 1–2 non-REM sleep in the same posture). Patients were required to have been on continuous positive airway pressure (CPAP) treatment for at least 3 months, with minimum compliance of at least 4 h usage every night. Patients were excluded if they had other sleep disorders or were on sedative or respiratory depressant medications. Pre-menopausal women and post-menopausal women on hormone replacement therapy were excluded, given possible effects on ventilation and upper airway function of the menstrual cycle and hormone replacement.12
Equipment
A PCRIT research system (Philips-Respironics, Murrysville, Pennsylvania, USA) able to switch rapidly between two different airway pressures was attached via a T-piece to the inspiratory and expiratory limbs of the breathing circuit. A rapidly inflatable balloon occlusion valve was placed upstream from a low resistance pneumotachograph on the inspiratory limb and was connected to a nasal mask. On the expiratory side, corrugated CPAP tubing was connected to an expiratory port connected to the T-piece. The inspiratory and expiratory limbs of the circuit thus received the same delivered pressure and the upper airway could be occluded under positive pressure conditions.
Sleep signals consisted of electroencephalography (EEG), electrooculography (EOG), submental EMG, ECG, SaO2, end-tidal CO2 (ETCO2), and epiglottic and mask pressures.
Protocol
Patients were instrumented as described above and asked to sleep in the supine posture, with one pillow. CPAP was commenced at the patient's documented therapeutic pressure and increased if required, 1–2 cm H2O above the point where visible inspiratory flow limitation was noted. This pressure was maintained as the baseline pressure for the duration of the study. Three subtherapeutic pressures were determined during a brief assessment period prior to commencement of the study proper. These pressures were chosen as ∼75, 50 and 25% on a scale from flow limitation first being observed to the development of frank apnoeas. Once determined, these dialdown pressures remained fixed throughout the remaining study. Brief upper airway occlusion was performed by inflation of the balloon valve during stable baseline pressure conditions.
Interventions were grouped into blocks of four (25, 50, 75 and occlusion) with the order randomised. At least 30 s of arousal-free sleep was required prior to each intervention. Both dialdowns and occlusions were performed until EEG/EMG evidence of arousal was observed, or for a maximum of 2 min, and were repeated throughout the night.
Data analysis
An experienced technician viewing only EEG, EMG and EOG signals performed sleep staging and arousal scoring. Only interventions scored to have commenced following at least 30 s stable stage 2 sleep or SWS without arousal underwent further analysis. Breath timing (inspiratory, TI; expiratory, TE; and total breath time, TTot), inspiratory tidal volume (Vti), minute ventilation (VI), peak inspiratory flow (PIF), CPAP level (mask pressure at end expiration) and ETCO2 were determined breath by breath. The ΔPepi (a measure of inspiratory drive) was determined as the difference between the epiglottic pressure at breath onset and the nadir of epiglottic pressure for each breath.3 For upper airway occlusions, time to arousal (TTA) was determined as the time from the first negative deflection in epiglottic pressure up to the point of EEG-defined arousal. The ΔPepi for the last completed inspiratory effort prior to arousal was used to assess ventilatory arousal threshold.13
To summarise the overall pattern of ventilatory response to dialdown interventions, ventilatory measurements from the first five and last three breaths were averaged across all replicate trials within each patient for each dialdown pressure in stage 2 sleep and SWS. Given a variable and often short latency to arousal, particularly under the more severe dialdown conditions, breaths potentially contributed to both the first and last breath periods. Early dialdown and pre-arousal upper airway function was assessed from the PIF versus CPAP relationship on the third and second to last dialdown breath, respectively. PCRIT, or the estimated airway pressure at which no flow occurs, was calculated by performing linear regression of PIF versus CPAP levels as previously described.9 The ventilatory drive response to occlusion was assessed from the linear regression slope of the ΔPepi versus the corresponding time relationship across each post-occlusion effort.
Statistical analysis
Differences in ventilatory parameters between breaths, sleep stages and dialdown pressures were examined via mixed model analysis, using an autoregressive covariance structure and separate random effects intercept for each patient (SPSS version 14, SPSS, Chicago, Illinois, USA). Mixed model analysis was also used to examine sleep stage and intervention effects on TTA, arousal threshold (maximum ΔPepi), the PIF versus CPAP relationship (CPAP as a covariate) on the third and second to last pre-arousal dialdown breath, and the ventilatory drive response to occlusion. Arousal-free survival time was examined using Cox regression with robust standard errors, with sleep stage and dialdown level as covariates (Stata version 10, StataCorp, College Station, Texas, USA). All data and figures are presented as mean±SEM, unless otherwise specified. A p value <0.05 was considered statistically significant.
Results
Fourteen patients (11/14 male) underwent the experimental study. Baseline characteristics: (mean±SD) overall AHI 49.7±16.5, SWS AHI 18.9±14.0, age 57.9±5.2, body mass index (BMI) (median, IQR) 31.2, 6.6. Four patients had insufficient sleep/SWS on the experimental night and were not analysed. One patient was only able to sleep in an oblique lateral posture. Data from this patient were included from this posture alone. Total sleep time was 288.0±16.2 min, with 172.4±11.8 min in stage 2 sleep and 39.3±8.2 min in SWS. There were 367 dialdown and 106 occlusion trials available for analysis. There were ∼10±1 dialdown trials at each airway pressure and 7±1 occlusion trials per patient in stage 2 sleep, and 3±1 dialdown trials at each airway pressure and 4±1 occlusion trials per patient in SWS. Most dialdown trials (275/367) and all occlusion trials were associated with an arousal within 120 s.
Pre-intervention ventilatory variables in stage 2 sleep versus SWS are shown in table 1. With the exception of a small but statistically significant increase in breathing frequency due to shortened expiratory time in SWS compared with stage 2 sleep, there were no other differences between stages.
Preintervention ventilatory variables during stage 2 sleep and slow wave sleep
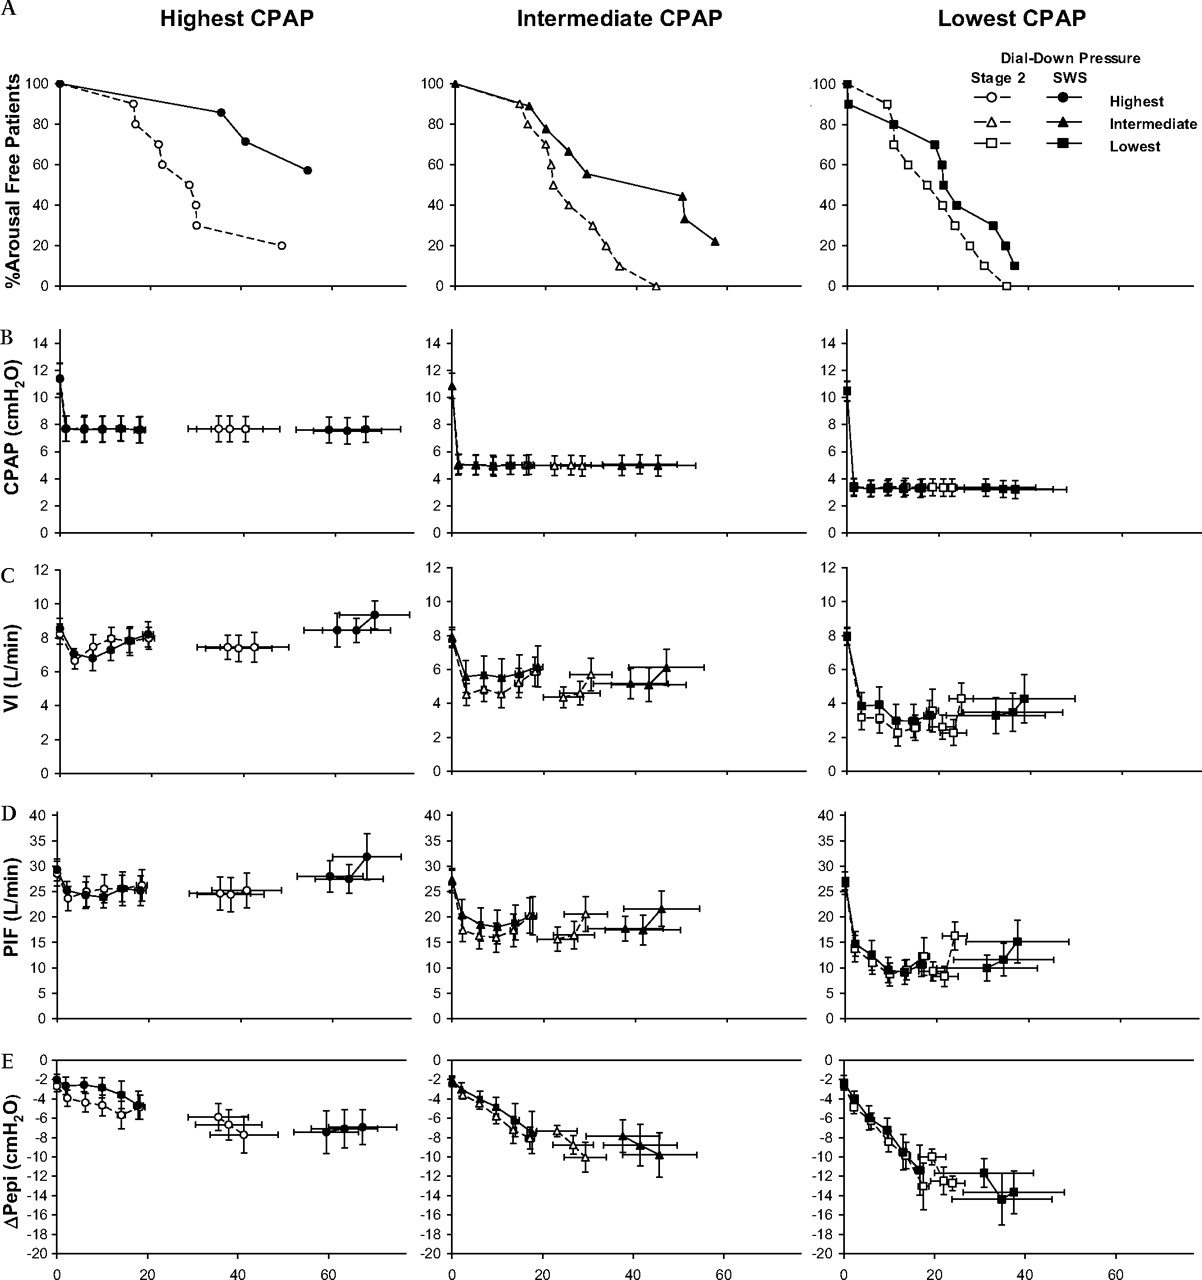
Post dialdown arousal probability and timing were strongly related to sleep stage and dialdown pressure. The proportion of patients remaining arousal free as a function of post dialdown time averaged for replicate trials within each patient and condition is shown in figure 1A. Cox regression survival analysis showed that both dialdown pressure and sleep stage significantly influenced time to arousal. The arousal HR (95% CI) for SWS compared with stage 2 sleep was 0.65 (0.44–0.88), p=0.006. The arousal HRs for 50% and 75% compared with 25% dialdowns were 0.51 (0.38–0.68) and 0.17 (0.12–0.26) respectively, both p<0.001.

(A) The proportion of patients remaining arousal free as a function of post dialdown time averaged for replicate trials within each patient and condition. (B), (C), (D) and (E), represent continuous positive airway pressure (CPAP) levels, minute ventilation (VI), peak inspiratory flow (PIF) and drive (ΔPepi), respectively, for breaths 0–baseline, 1–5 post dialdown and –3, –2, –1 before the end of the intervention, for the three different dialdown pressures, over time. SWS, slow wave sleep.
CPAP and ventilatory changes in the first five and last three breaths during each of the dialdown interventions are shown in figure 1B–E. By design, dialdown pressures were statistically significantly different between each of the interventions (p<0.001). However, there were no stage or breath number main or interaction effects to indicate any differences between sleep stages. Dialdown from therapeutic CPAP caused substantial pressure-dependent decrements in VI (figure 1C) and PIF (figure 1D), due to decreased Vt (all p<0.001) and an initial drop in inspiratory time on the first breath, followed on subsequent breaths by significant inspiratory prolongation (p<0.001) and expiratory shortening (p=0.037), but with no net increase in breathing frequency. There were rapid, progressive increases in ventilatory drive (ΔPepi, figure 1E, breath effect p<0.001) particularly in the more severe dialdown conditions (dialdown pressure×breath effect p<0.001). However, despite these substantial (approximately three- to seven-fold) increases in ventilatory drive, there were only marginal improvements in peak inspiratory flow and ventilation up to the penultimate breath, with no statistically significant main or interaction effects of sleep stage in any variable.
Peak flow plotted as a function of CPAP level in the third and penultimate (breath–2) postdialdown breaths in stage 2 sleep and SWS is shown in figure 2. There were no statistically significant stage, breath number or interaction effects to indicate any differences or improvement in upper airway function over time, in either stage 2 sleep or SWS. Calculated PCRIT values for the third post-dialdown breath were 0.4±1.3 and 0.8±1.8 cm H2O for stage 2 sleep and SWS, respectively. PCRIT for the penultimate dialdown breath was 0.4±1.8 and 2.13±0.9 cm H2O in stage 2 sleep and SWS, respectively. There were no statistically significant stage or breath effects for PCRIT.

Peak inspiratory flow (PIF) vs continuous positive airway pressure (CPAP) for breath 3 post-dialdown (A) and breath –2 before the end of the intervention (B). Calculated critical closing pressure (PCRIT) values are shown as isolated points. SWS, slow wave sleep.
The ventilatory drive response to upper airway occlusion trials is shown in figure 3. In SWS compared with stage 2 sleep, the maximum ΔPepi prior to arousal was statistically significantly more negative (−28.7±2.7 vs −20.3±1.6 cm H2O, p<0.001), occurred later (20.5±2.7 vs 16.1±2.0 s, p=0.023) and with a significantly prolonged time to arousal (23.0±2.6 vs 17.1±1.7 s, p=0.008). In addition, there was a statistically significant stage by breath number interaction effect (p<0.001) and a steeper linear regression slope of ΔPepi versus breath time (−1.0±0.2 vs −0.6±0.1 cm H2O /l, p=0.019, r2=0.9 and 0.86, respectively), suggesting brisker ventilatory responsiveness in SWS compared with stage 2 sleep.

Drive (ΔPepi) pre-balloon and post-balloon airway occlusion on a breath by breath basis, over time. The ΔPepi for the final breath pre-arousal is shown as an isolated point. Mean arousal times for stage 2 sleep versus slow wave sleep (SWS) are also shown.
Discussion
The key finding of this study was that despite rapid augmentation of inspiratory effort there was no statistically significant ventilatory recovery to partial airway occlusion in either stage 2 sleep or SWS under matched CPAP conditions. Significantly reduced arousal probability and delayed arousal suggested more prolonged, but otherwise similarly and largely ineffectual increased ventilatory efforts with continued flow limitation in SWS compared with stage 2 sleep. There was no evidence to support that upper airway function was intrinsically improved in SWS compared with stage 2 sleep, either early in airway challenge or in response to augmented ventilatory efforts prior to arousal.
By design, we used the same three CPAP dialdown levels throughout the night within each patient, in order to compare ventilation/flow with equivalent airway pressures between stages. Any systematic stage effect on ventilatory/airway responses would therefore be expected to appear as differences in flow/ventilatory output for the same CPAP level (ie, a shift in the pressure–flow relationship and/or changes in ventilatory responses over time for equivalent pressure conditions between stage 2 sleep and SWS). No such effects were noted.
Fixed anatomical factors are thought to contribute to the severity of sleep apnoea. Patients with OSA tend to have an anatomically smaller upper airway measured by MRI14 or pharyngoscopy15 compared with those without apnoea. OSA severity, however, can vary across the night. This may partly be due to alterations in airway anatomy caused by changes in body9 ,16–18 However, most patients with OSA achieve periods of stable sleep, even when controlling for positional effects.19 We have previously shown that even in patients with severe OSA, the frequency of respiratory events is significantly reduced during SWS.1 This study was designed to investigate possible mechanisms underpinning this phenomenon by exploring differences in airway function and arousability between SWS and stage 2 sleep.
Passive airway function, measured from the airflow response to rapid dialdown from therapeutic CPAP,20–22 was not different between stage 2 sleep and SWS. This agrees with the findings of Penzel et al,9 who assessed airway function via measurements of PCRIT, but appears to contrast with the findings of Issa et al,8 who found significantly decreased upper airway collapsibility during SWS compared with light sleep using an upper airway occlusion technique. While the reasons for this difference are unclear and may reflect methodological differences, we did observe faster increments in ventilatory drive during occlusion, but not dialdown trials that may help explain these discrepant findings.
Patil et al 23 suggested that patients with OSA have both abnormalities in passive airway function and impaired neuromuscular compensation to airway challenge, compared with non-OSA controls. Apparent improvements in OSA during SWS could reflect either more rapid and effective neuromuscular compensation responses or greater tolerance to increased ventilatory drive during SWS compared with lighter sleep.2 ,3 This tolerance may potentially allow for greater improvements in airway function and ventilation via increasing negative upper airway pressure and chemostimulation,5 which are more likely to trigger arousal during lighter sleep. However, apart from more rapid ventilatory drive augmentation to complete airway occlusion, we found no evidence to support improved ventilatory compensation during SWS compared with stage 2 sleep. These findings suggest that patients with OSA essentially tolerate a higher drive state for longer during SWS, with minimal improvements in airflow or ventilation until arousal.
Substantial sleep stage effects on arousal probability and timing have been shown previously with both respiratory2 ,3 and non-respiratory stimuli.24 ,25 Patients with sleep apnoea have a higher arousal threshold compared with those who do not have apnoea.26 This may be due to chronic sleep fragmentation,27 recurrent hypoxia28 and/or an underlying neurological abnormality. These changes are at least partially reversible following CPAP treatment29 and recur following withdrawal of CPAP.30 It is not clear if this effect is adaptive or maladaptive as it may reduce the frequency of respiratory arousals, but possibly at the cost of prolonged periods of hypoventilation and increased ventilatory drive.
Ventilatory control stability is dependent on negative feedback loops and is frequently described using the engineering concept of loop gain.31 Loop gain describes the propensity of the ventilatory control system to develop periodic fluctuations in output (as seen in sleep apnoea). Elevated loop gain assessed by proportional assist ventilation appears to be significantly correlated with OSA severity,32 particularly in patients with a near atmospheric pharyngeal closing pressure.33 We measured the increase in ventilatory drive after complete airway occlusion as a possible marker of chemosensitivity. Our subjects demonstrated more rapid drive augmentation responses during SWS, which, within the limitations of this technique, may suggest increased chemosensitivity during SWS. This has not been described previously. A similar technique used in healthy volunteers suggested no significant differences between stage 2 sleep and SWS in the ventilatory drive response to occlusion.3 The increased drive responses observed in SWS post-occlusion were not apparent in the non-occlusive dialdown stimuli. The significance of this finding is unclear but may indicate interactive mechanoreceptor-mediated effects. We found no further evidence of important differences in ventilatory compensation between SWS and stage 2 sleep.
During the baseline period, there were some minor but statistically significant breath timing differences, with shorter expiratory time and increased breathing frequency in SWS compared with stage 2 sleep. These did not result in any ventilatory differences and there were no post dialdown sleep stage effects in these variables to support key differences in breath timing between the sleep stages.
There are a number of limitations to this study. Arousals from sleep were scored according to conventional criteria,34 thus the impact of subcriterion arousals is unknown. However, we found no evidence to suggest ventilatory improvements from subcortical arousals and no evidence for systematic stage effects other than substantially delayed cortical arousal in SWS. By design, this study investigated respiratory variables only until arousal, as occlusions and dialdowns were terminated at the onset of arousal to minimise sleep disruption. We have thus not investigated the effects of the ventilatory response to arousal itself, which may further contribute to ongoing cyclical breathing by causing hyperventilation, followed by a period of hypoventilation35 that may render the airway more prone to re-narrowing. Reduced arousability to respiratory challenge during SWS would reduce the frequency of post-arousal hypoventilation and therefore potentially explain an important component of the reduced respiratory event frequency in SWS. It is currently unknown if post-arousal ventilatory responses are modulated by sleep stage.
There are a number of caveats to our technique of measuring ventilatory drive augmentation post airway occlusion. With an occluded airway, ETCO2 cannot be measured. Thus we cannot be sure if the findings are due to increased chemosensitivity during SWS. Conceivably—for example, if there are differences in unmeasured variables such as metabolic rate, respiratory quotient or CO2 buffering between stage 2 sleep and SWS—the rise in mixed venous CO2 post airway occlusion may be different, with changes in drive therefore not necessarily indicating differences in chemosensitivity per se. Previous studies suggest that metabolic rate36 ,37 and respiratory quotient36 are not significantly different between non-REM stages.
While PCRIT measurements support our findings of no change in either basic or compensated airway function between light sleep and SWS, our study design to compare ventilatory responses at fixed pressures is not ideal for PCRIT determinations. PCRIT is more appropriately measured using multiple pressure–flow points9 and ideally includes pressures associated with airway collapse in order to minimise measurement variability from extrapolation.
Finally, this was a small study in selected patients who had SWS even when they had severe, untreated OSA. It is possible that these results may not be generalisable to all patients with OSA. Patients with an extremely collapsible upper airway, for example, may frequently not achieve SWS, and may require recurrent arousals from sleep to protect ventilation. However, we have previously shown that in the majority of patients with OSA, respiratory event frequency reduces during SWS compared with stage 2 sleep.1 Sixty percent of patients with moderate to severe OSA in that study, for example, would meet the inclusion criteria for this study.
In summary, this study found no evidence to support improved upper airway airflow mechanics or ventilatory compensation responses to ventilatory challenges in SWS compared with stage 2 sleep in a group of patients with OSA known to exhibit OSA improvement in SWS. Following rapid dialdown from therapeutic CPAP, there was rapid augmentation of ventilatory drive; however, this did not translate into statistically significant improvements in flow or ventilation, up to the point of arousal in either SWS or stage 2 sleep. However, patients were significantly more likely to arouse and be aroused earlier during stage 2 sleep compared with SWS and during more severe ventilatory challenges. Similarly, with upper airway occlusion, arousal threshold and the time to arousal were statistically significantly greater during SWS compared with stage 2 sleep. There was also more rapid ventilatory drive augmentation in SWS that was not apparent post-dialdown. It appears that patients are more likely to “tolerate” reduced ventilation during SWS for longer without arousing, but with no major differences in the ability for ventilatory compensation during SWS compared with stage 2 sleep. Consequently, differences in arousability and potentially arousal responses to respiratory stimuli remain as factors more likely to account for substantial reductions in OSA frequency during SWS.
Acknowledgments
The authors gratefully acknowledge Philips-Respironics for loaning the PCRIT research system, and the Lions Medical Research Foundation of Australia for providing scholarship support for RR. We are also grateful to Dr Richard Woodman, Flinders University of South Australia, for statistical advice and undertaking the survival analysis. The study was funded by NHMRC project grant 480438.
References
Supplementary materials
Supplementary Data
This web only file has been produced by the BMJ Publishing Group from an electronic file supplied by the author(s) and has not been edited for content.
Files in this Data Supplement:
- Data supplement 1 - Online supplement
Footnotes
-
See Editorial, p95
-
Supplementary methods are published online only at http://thorax.bmj.com/content/vol65/issue2
-
Linked articles 127860.
-
Funding Lions Medical Research Foundation, Australia (PO Box 253, Greenacres, SA 5086, Australia), National Health and Medical Research Council, Australia (GPO Box 1421, Canberra, ACT, 2601, Australia).
-
Competing interests None.
-
Ethics approval This study was conducted with the approval of the Repatriation General Hospital, Research Ethics Committee.
-
Provenance and peer review Not commissioned; externally peer reviewed.