Article Text

Abstract
Background: Dynamic hyperinflation of the lungs impairs exercise performance in chronic obstructive pulmonary disease (COPD). However, it is unclear which patients are affected by dynamic hyperinflation and how the respiratory muscles respond to the change in lung volume.
Methods: Using optoelectronic plethysmography, total and regional chest wall volumes were measured non-invasively in 20 stable patients with COPD (mean (SD) forced expiratory volume in 1 second 43.6 (11.6)% predicted) and dynamic hyperinflation was tracked breath by breath to test if this was the mechanism of exercise limitation. Resting ventilation, breathing pattern, symptoms, rib cage and abdominal volumes were recorded at rest and during symptom limited cycle ergometry. Pleural, abdominal, and transdiaphragmatic pressures were measured in eight patients.
Results: End expiratory chest wall volume increased by a mean (SE) of 592 (80) ml in 12 patients (hyperinflators) but decreased by 462 (103) ml in eight (euvolumics). During exercise, tidal volume increased in euvolumic patients by reducing end expiratory abdominal volume while in hyperinflators tidal volume increased by increasing end inspiratory abdominal and rib cage volumes. The maximal abdominal pressure was 22.1 (9.0) cm H2O in euvolumic patients and 7.6 (2.6) cm H2O in hyperinflators. Euvolumic patients were as breathless as hyperinflators but exercised for less time and reached lower maximum workloads (p<0.05) despite having better spirometric parameters and a greater expiratory flow reserve.
Conclusions: Dynamic hyperinflation is not the only mechanism limiting exercise performance in patients with stable COPD. Accurate measurement of chest wall volume can identify the different patterns of respiratory muscle activation during exercise.
- chronic obstructive pulmonary disease
- exercise
- lung volume
- dynamic hyperinflation
- BMI, body mass index
- COPD, chronic obstructive pulmonary disease
- EELV, end expiratory lung volume
- EEVcw, end expiratory chest wall volume
- FEF, forced expiratory flow at a percentage of FVC
- FEV1, forced expiratory volume in 1 second
- FRC, functional residual capacity
- FVC, forced vital capacity
- IC, inspiratory capacity
- OEP, optoelectronic plethysmography
- Pab, abdominal pressure
- Pdi, transdiaphragmatic pressure
- Pga, gastric pressure
- Poes, oesophageal pressure
- Ppl, pleural pressure
- RV, residual volume
- TLC, total lung capacity
- Vab, abdominal volume
- Vcw, total chest wall volume
- Vrc, rib cage volume
Statistics from Altmetric.com
- BMI, body mass index
- COPD, chronic obstructive pulmonary disease
- EELV, end expiratory lung volume
- EEVcw, end expiratory chest wall volume
- FEF, forced expiratory flow at a percentage of FVC
- FEV1, forced expiratory volume in 1 second
- FRC, functional residual capacity
- FVC, forced vital capacity
- IC, inspiratory capacity
- OEP, optoelectronic plethysmography
- Pab, abdominal pressure
- Pdi, transdiaphragmatic pressure
- Pga, gastric pressure
- Poes, oesophageal pressure
- Ppl, pleural pressure
- RV, residual volume
- TLC, total lung capacity
- Vab, abdominal volume
- Vcw, total chest wall volume
- Vrc, rib cage volume
Exercise limitation is a major cause of disability in patients with chronic obstructive pulmonary disease (COPD) and is largely the result of disturbances in the mechanics of breathing. Tests of airflow limitation at rest such as forced expiratory volume in 1 second (FEV1) are relatively poor predictors of exercise duration in these patients.1,2 The most common explanation for this is that, unlike healthy subjects, end expiratory lung volume (EELV) increases during exercise in patients with COPD, decreasing the inspiratory capacity (IC).2,3 This dynamic hyperinflation increases the ability of the respiratory system to generate expiratory flow but limits the maximum tidal volume and reduces the ability of inspiratory muscles to produce force by reducing their length, leading to the sensation of breathlessness.4 At present few data are available on the time course of these changes, how the volume change is distributed between the compartments of the chest wall (rib cage and abdomen), and what happens in patients who do not show these changes in lung volume.
EELV is usually measured indirectly from IC, but this is influenced by the subject’s ability to cooperate. It cannot follow breath-to-breath variation in lung volume. Integrator drift, which is multifactorial in origin, also poses a problem. This problem can be overcome by using optoelectronic plethysmography (OEP).5,6 OEP is an accurate non-invasive method for measuring total chest wall volume (Vcw), ventilation, and respiratory kinematics.7–10 It enables analysis of chest wall motion and accurately measures changes in the volume of the different respiratory compartments of the chest wall in different postures and conditions. Although OEP cannot measure the absolute lung volume unless the subdivisions of lung volume are also known, it can measure changes in volume such as during a tidal breath and can record breath by breath changes in EELV, as well as its distribution between the different chest wall compartments.6
A study was undertaken to measure operating chest wall volumes on a breath by breath basis in patients with clinically stable symptomatic COPD at rest and during exercise, and thus to assess how the chest wall changed as dynamic hyperinflation developed. We hypothesised that an increase in end expiratory Vcw would be the most important factor limiting exercise, but found a more complex situation than we anticipated.
METHODS
Subjects
Twenty men with stable COPD diagnosed by accepted criteria took part in the study.11,12 All had been smokers and complained of exertional dyspnoea. None had clinical or physiological features of bronchial asthma or a history of exacerbation in the previous 6 weeks. There were no co-morbid conditions limiting exercise. Patients were studied before pulmonary rehabilitation and were unfamiliar with physiological exercise testing. Routine bronchodilator drugs were omitted for 4 hours (short acting) or 12 hours (long acting) before attendance. The protocol was approved by the district research ethics committee and informed consent was obtained.
Measurements
Subdivisions of lung volumes were measured by body plethysmography (Medgraphic Autolink 1085D, Medical Graphics, St Paul, MN, USA) using ATS standards.13 Flow was measured at the mouth by a screen pneumotachograph and integrated to display the flow-volume loop from which FEV1, FVC, and flow indices were derived.
Chest wall kinematics and compartmental volumes were non-invasively measured by OEP. The principle of this method is described in detail elsewhere.5,6 Briefly, OEP measures the change in the complex shape of the chest wall during breathing by modelling the thoracoabdominal surface with a large number of points belonging to selected anatomical reference sites on the rib cage and abdomen. The three dimensional positions and displacements of each point are measured by a motion analyser (BTS, Milan, Italy) based on passive (reflective) markers (plastic hemispheres of 10 mm diameter covered by a thin film of retroreflective paper) placed on the skin using biadhesive hypoallergenic tape and special TV cameras operating up to 100 frames per second synchronised with coaxial infrared flashing LEDs. After computing and classifying the two dimensional coordinates of all markers surveyed by at least two TV cameras, the system determines the three dimensional coordinates of the different markers by stereo-photogrammetry. Once the three dimensional coordinates of the points belonging to the chest wall surface are acquired with reference to an arbitrary coordinate system, a closed surface is defined by connecting the points to form triangles (mesh of triangles) and the volume contained by the surface is computed using Gauss’ theorem. This procedure allows the direct computation of the volume enclosed by the thoracoabdominal surface approximated by a closed mesh of triangles. As in our previous studies, we used 89 markers placed over the chest wall surface and four TV cameras (two in front and two behind the subject at a distance of 3 m) to track their movement.
Eight patients were instrumented using standard balloon tipped catheters connected to pressure transducers (SCX05; Sensym, Milpitas, CA, USA) for recording oesophageal (Poes) and gastric (Pga) pressures which were used as indices of pleural (Ppl) and abdominal (Pab) pressures, respectively. Transdiaphragmatic pressure (Pdi) was computed as the difference between Pga and Poes. In these subjects we also continuously measured flow at the airway opening using a low dead space (70 ml) pneumotachograph (Medical Graphics).
Breath by breath oxygen consumption and carbon dioxide production were measured using a fuel cell and infrared carbon dioxide analyser, respectively, as part of a commercial exercise system (Medical Graphics).
Pressures and flow signals were synchronised to those of the motion analyser used for OEP and sent to a personal computer for subsequent analysis. Oxygen saturation was measured by pulse oximetry (Biox 3700e, Ohmeda, Louisville, CO, USA).
Protocol
After performing spirometric and plethysmographic measurements in the body box the subjects were asked to sit on an electrically braked cycle ergometer. Once acclimatised, quiet breathing for 3 minutes and a slow vital capacity to determine chest wall volumes at functional residual capacity (FRC), total lung capacity (TLC), and residual volume (RV) were measured. The patients than began pedalling for 3 min with 10 W increases in workload every subsequent 3 minutes until exhaustion. Data were collected during the last minute of each workload, including the subject’s subjective assessment of breathing difficulty and leg fatigue using a 10 point modified Borg category scale.14 During both rest and exercise the subjects grasped handles positioned at mid-sternum level, which lifted the arms away from the rib cage, so that lateral markers could be visualised.
Data analysis
Modelling of the chest wall
The chest wall was modelled as if it was composed of two compartments—rib cage and abdomen. A change in abdominal volume (Vab) was defined as the volume swept by the abdominal wall and the boundary between the rib cage and abdomen along the lower costal margin anteriorly and at the level of the lowest point of the lower costal margin posteriorly. Total chest wall volume (Vcw) equalled the sum of rib cage volume (Vrc) and Vab. The pulmonary and abdominal rib cage compartments have been combined as Vrc in this analysis.
Comparison between chest wall and pneumotachographic volumes
As in previous studies in which we assessed the ability of OEP to measure changes in lung volume,5,7,9,10 we compared changes in Vcw during inspiration obtained by OEP (ΔVcw) with inspired volumes obtained by integration of flow (ΔVm), considering the difference between values at the beginning and end of inspiration. For each instrumented patient, 5–6 breaths were studied during both quiet breathing and at their maximal workload during exercise. Data were then compared by linear regression analysis.
Chest wall, ventilatory pattern and work of breathing
During quiet breathing and exercise OEP data were used to measure end expiratory and end inspiratory Vrc, Vab, and Vcw and the complete ventilatory pattern (including tidal volume, breathing frequency, minute ventilation, inspiratory and expiratory times) at each workload. All volumes reported are the combined mean values over the last minute of each run (unless otherwise specified). The work of breathing performed on the lung in the instrumented patients was calculated as the area enclosed by the Poes–Vcw loops.
Patients were considered to show dynamic hyperinflation of the chest wall if the end expiratory Vcw increased above its resting value at maximum workload. Those in whom Vcw was maintained or reduced were described as euvolumic. This terminology was the same as that used in other published papers15,16 in which similar patterns of behaviour were found in healthy subjects in response to an incremental exercise test with expiratory flow limitation artificially induced by a Starling resistor.
Statistical analysis
Data are presented as mean (SE) unless otherwise stated. Differences between anthropometric, spirometric, and exercise data sets were tested using Wilcoxon and Mann-Whitney tests for paired and unpaired data, respectively, with a 5% significance level. To compare chest wall volumes at end expiration and end inspiration at different workloads between euvolumic and hyperinflator patients we applied a repeated measures analysis of variance (ANOVA). This enabled us to test for an overall difference between workloads (within-subject effect) and between groups (euvolumics v hyperinflators). When ANOVA was significant, post hoc Fisher’s PLSD test was performed to verify the statistical significance of the differences between pairs of means. For all tests the significance level was taken as p<0.05.
RESULTS
Baseline anthropometric and pulmonary function data are shown in table 1. Instrumentation did not influence exercise performance or the changes in Vcw during exercise.
Mean (SD) baseline anthropometric and pulmonary function data of study subjects and subgroups defined by their end expiratory lung volumes during exercise
Comparison of OEP with pneumotachograph data
The relationship between ΔVcw (OEP) and ΔVm (pneumotachograph) is shown in fig 1. Each data point represents the mean of 10–15 breaths either during quiet breathing or at maximum exercise. The linear regression analysis provided the following equation: ΔVcw = 1.12 · ΔVm − 0.08 (r2 = 0.92, p<0.0001). Using the same data, the mean (SE) percentage difference between ΔVm and ΔVcw (computed as (ΔVm − ΔVcw)/ΔVm × 100) was −4.3 (2.5)%. When only quiet breathing data were considered the equation was ΔVcw = 1.16 · ΔVm + 0.17 (r2 = 0.933, p<0.001) with a mean (SE) percentage difference of 0.8 (3.2)%; when only exercise data were considered the equation was ΔVcw = 0.95 · ΔVm − 0.15 (r2 = 0.92, p<0.001) with a mean (SE) percentage difference of −9.5 (2.9)%. At rest ΔVm and ΔVcw differed by 5 (30) ml, while at maximum workload the difference was −100 (29) ml, the ΔVcw values being larger.

Comparison of the simultaneously recorded integrated flow at the mouth (measured by pneumotachograph, PNT) and change in Vcw (measured by optoelectronic plethysmography, OEP) during quiet breathing (QB) at rest and at maximum workload during exercise (EX) in euvolumic patients (closed symbols) and hyperinflators (open symbols). Each point represents the mean value for each individual. The solid line is the slope of the regression between the data sets and the dashed lines are the 95% confidence intervals. The slope of the regression line (equal to 1.12) reflects the combined effect of gas compression, blood displacements away from the thorax, and the difference in thermodynamic conditions (ATPS v BTPS).
Changes in end expiratory chest wall volume during exercise
Two patterns of change in Vcw occurred during exercise. End expiratory Vcw increased by a mean (SE) of 592 (80) ml in 12 patients (five instrumented) and decreased in eight others (three instrumented; fig 2, right hand panels). End expiratory Vrc increased significantly by 494 (90) ml in the hyperinflated patients compared with 46 (148) ml in the euvolumic group (p<0.05) during unloaded cycling and remained constant thereafter. End expiratory Vab remained constant in hyperinflators throughout exercise with the end inspiratory volumes rising to accommodate the increases in Vrc (fig 2, left hand and middle panels). In euvolumic patients the end expiratory Vab was reduced at the onset of exercise and remained constant thereafter. The right hand panel of fig 2 shows that the change in Vcw (that is, the tidal volume) in these patients was almost entirely the result of the decrease in Vab while end inspiratory Vcw remained almost constant. In contrast, in the hyperinflators end inspiratory Vcw approached the TLC values measured before exercise and this was accomplished by increases in both Vrc and Vab.

Compartmental and total chest wall volume changes in hyperinflating (upper panels, HY) and euvolumic (lower panels, EU) patients. Open circles = end inspiration; closed circles = end expiration. Mean values and standard error bars are shown. *p<0.05, **p<0.01, ***p<0.001 v quiet breathing (QB); †p<0.05, ††p<0.01, †††p<0.001 hyperinflators (HY) v euvolumics (EU).
Resting lung volumes including IC were not significantly different between the exercise groups nor was the degree of oxygen desaturation during exercise. Both hyperinflator and euvolumic patients reported a similar degree of breathlessness and leg effort scored at peak exercise. However, euvolumic patients had significantly higher BMI, pre-exercise FEV1, FEV1/FVC ratio, and forced expiratory flows at 25% and 50% of expired volume (table 1).
Flow, pressure, and regional volume relationships
Figure 3 shows the flow-volume and compartmental pressure-volume relationships of two representative subjects, one hyperinflator (top panels) and one euvolumic (bottom panels). The hyperinflator had a rightward displacement of the tidal flow-volume loop at peak exercise with an expiratory flow profile that had changed little from that under resting conditions. There was an increase in both rib cage and abdominal volumes with little change in the shape of the pressure-volume loop. In contrast, in the euvolumic patient the expiratory flow was increased during exercise at close to the resting end expiratory volume with marked abdominal muscle pressure generation. This pattern was consistent in all the patients in which it could be assessed.
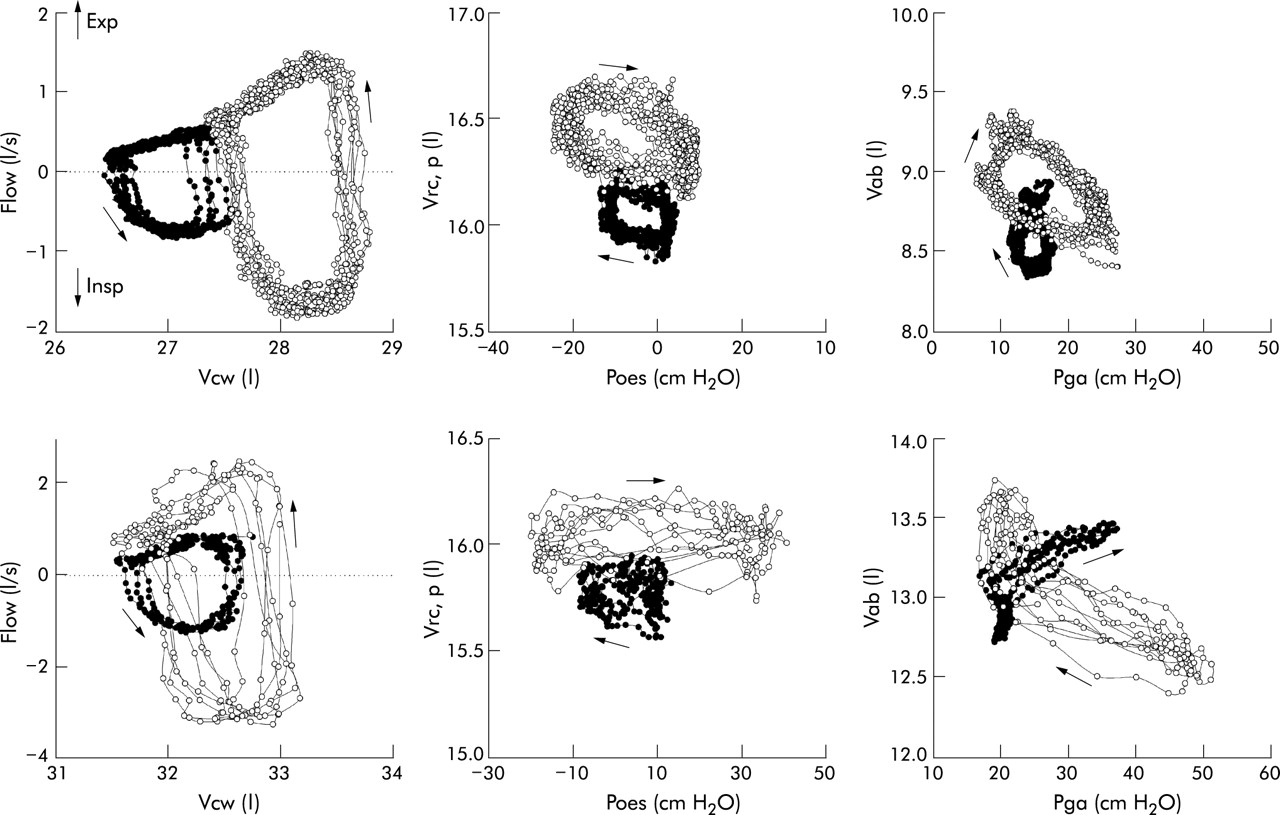
Relationships between tidal flow, chest wall volumes, and pressures in two representative patients, one hyperinflator (top panels) and one euvolumic (bottom panels). The data represent the composite values during sequential breaths at specific flow, volume and pressure. Solid symbols are values measured at rest and open symbols are those measured at maximal exercise. In the left hand panels flow at the mouth is related to chest wall volume (Vcw). The tidal loops of the hyperinflating patient are displaced rightward during maximal exercise while in the euvolumic patient tidal expiratory flow is increased without a substantial increase in end expiratory lung volume (EELV). In the middle two panels the volume of the pulmonary rib cage (Vrc,p) is related to oesophageal pressure (Poes). These data have been selected as only the pulmonary rib cage is exposed to pleural pressure.8 In both patients there is an increase in end inspiratory and end expiratory pulmonary Vrc at maximal exercise compared with rest, although significantly higher end expiratory Poes values were seen in the euvolumic patient. In the right hand panel abdominal volume (Vab) is plotted against gastric pressure (Pga). With exercise there is little change in the pressure-volume loop of the hyperinflating patient, but a marked shift in the axis of the loop occurred in the euvolumic patient which suggests a strong recruitment of expiratory muscles acting on this compartment.
Exercise capacity, breathing pattern, and respiratory pressures
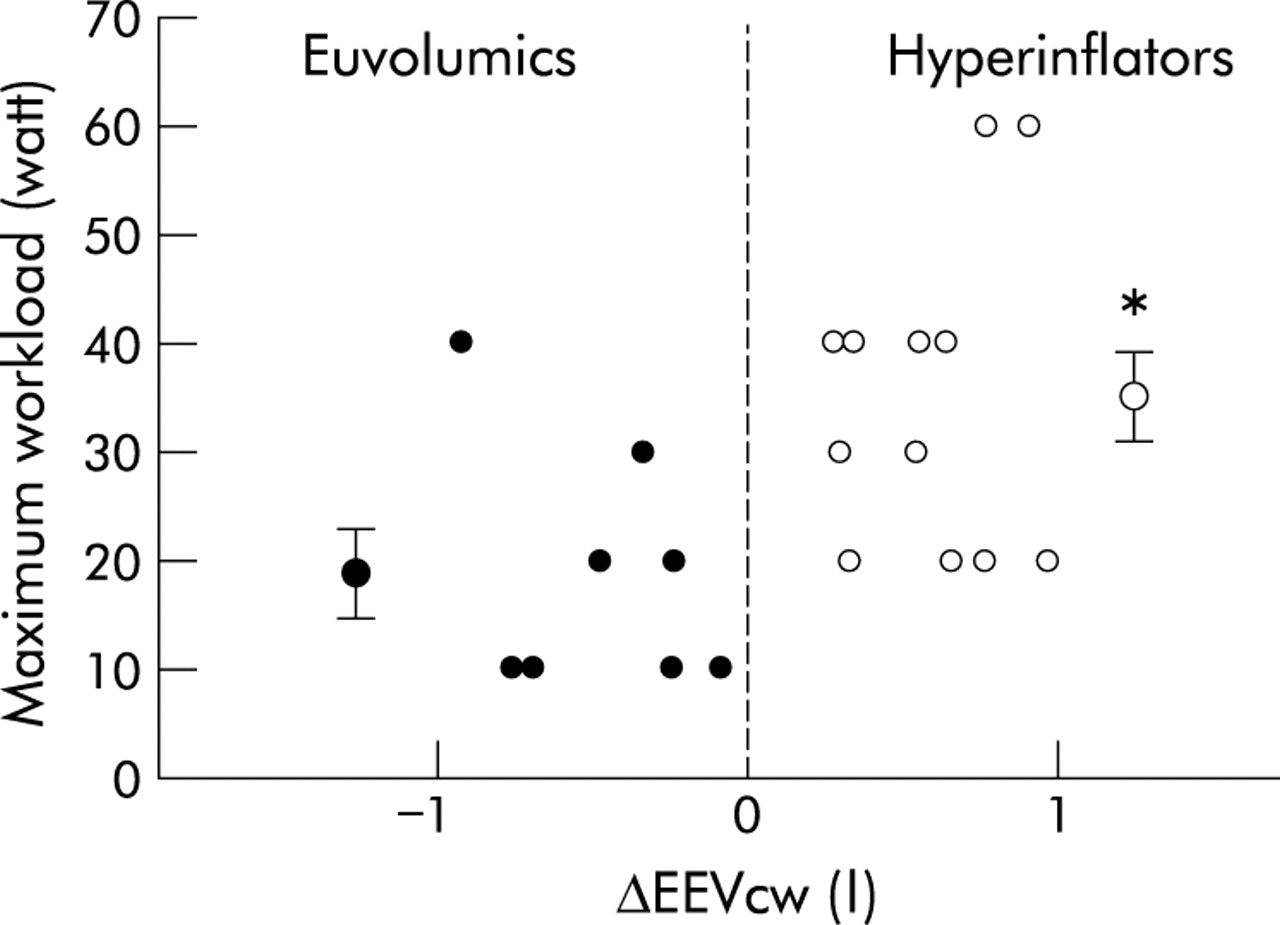
Although peak exercise ventilation was the same, hyperinflators reached a mean (SE) maximum workload of 35.0 (4.8) watts with an exercise duration of 13.7 (1.4) min, while the euvolumic patients achieved a maximum workload of 20.0 (4.2) watts and an exercise duration of 8.8 (1.3) min (p<0.05). The change in end expiratory Vcw was weakly related to the maximum workload achieved (r2 = 0.216, p = 0.038; fig 4).
Relationship between change in end expiratory chest wall volume from quiet breathing to exercise (ΔEEVcw) and maximum exercise workload reached by euvolumic and hyperinflator patients. Mean values and standard error bars are shown for the two groups; *p<0.05.
Tidal volume and frequency at maximum workload were similar in the two groups with no significant difference in the inspiratory or expiratory times between the subgroups (table 2).
Mean (SE) values of exercise performance, breathing pattern, exercise duration, respiratory pressures, energetics and sensation at rest and maximal exercise (Wmax) for the euvolumic and hyperinflating subjects
In the instrumented patients the mean and peak transdiaphragmatic pressure swings remained relatively constant at rest and during exercise. The mean abdominal pressure swings at maximum exercise were negative in both groups and the maximal abdominal pressures were three times greater in the euvolumics than in the hyperinflators, but the difference was not statistically significant (table 2).
Although resting and peak exercise oxygen consumption were similar in both groups, the calculated work of breathing at the same level of exercise was substantially greater in the euvolumic patients (p<0.05).
DISCUSSION
When healthy subjects exercise, end expiratory lung volume falls as ventilation increases—a change seen in young adults8 and in healthy elderly subjects of a similar age to our patients.17 Changes in lung volume can be inferred from changes in IC, but the respiratory response to exercise also involves the distribution of these volume changes to different chest wall compartments involving the activity of different groups of respiratory muscles. Initial studies of Vcw in patients with COPD used semi-quantitative methods based on magnetometers and were the first to show that dynamic hyperinflation occurred during exercise in some of these patients.3,18 OEP represents an important technical advance which has allowed us to define how Vcw changes during exercise in patients with COPD. As a result, we have identified two different behaviour patterns in changes to end expiratory Vcw during exercise.
Studies with externally applied flow resistance in healthy subjects showed differences in the pattern of response to exercise, with some maintaining the normal fall in EELV throughout exercise while others allowed EELV to rise before stopping.15 In most of our COPD patients end expiratory Vcw increased with exercise, but in a significant number the pattern seen in healthy subjects was adopted with reduced Vab preventing dynamic hyperinflation. In each case the response of a particular individual was constant and the differences between groups at each workload were statistically significant (fig 2). The hyperinflators reached end inspiratory volumes close to their resting TLC while the euvolumic patients had an apparent end inspiratory reserve when they stopped. The change in end expiratory Vrc occurred in hyperinflators before loaded exercise began—a finding previously noted in COPD patients using less quantitative methods18,19—and it did not change further in either group as exercise intensity increased. The effect of exercise on the abdominal compartment was equally distinct with end inspiratory Vab increasing in hyperinflators, while in euvolumic patients the end inspiratory Vab remained constant but higher abdominal pressure developed to try to reduce end expiratory Vab (fig 3).
It is not clear why these different responses to exercise occur. The presence of balloon catheters or breathing via a mouthpiece did not explain the pattern observed. All patients had omitted their normal bronchodilator drugs and none had undergone pulmonary rehabilitation, an intervention which can modify changes in lung volume during exercise.20 There was no difference in the oxygen saturation during exercise and the oxygen consumption, when measured, was similar at equivalent workloads. Although the BMI differed between the groups, this is likely to reflect differences in disease severity, with euvolumic patients having significantly better spirometric parameters. Differences in the relative amounts of emphysema or small airways disease might be relevant, although the presence of emphysema is not necessary for dynamic hyperinflation to occur.21
The most likely explanation is a difference between groups in their resting expiratory flow reserve. The hyperinflators reported here are very similar to those reported by O’Donnell and colleagues,21 exhibiting quantitatively similar changes in end expiratory Vcw using optoelectronic measurement to those in EELV measured using the IC technique and with similar impairments in resting spirometry and expiratory flow. Data from the composite tidal flow-volume loops in our patients are compatible with the presence of resting tidal flow limitation which is associated with hyperinflation in COPD.22 In contrast, the euvolumic patients were less obstructed and had less marked flow limitation at lung volumes within the resting tidal range, as assessed by their maximum pre-exercise flow-volume loops and the non-invasive data shown in fig 3. Despite their better inspiratory flow reserve, euvolumic patients developed high intra-abdominal pressure rather than permitting EELV to rise as in the hyperinflators.
Whatever the explanation, maintaining a normal end expiratory lung volume is a poor adaptive strategy. The calculated work of breathing at end exercise was substantially higher in the euvolumic patients than in the hyperinflators, confirming that exercise was not limited by poor motivation in this group. The increase in oxygen consumption by the respiratory muscles in euvolumic patients resulting from this increase in work of breathing effectively competes for a larger share of the whole body oxygen consumption, reducing the oxygen available to the leg muscles.23–25 This may explain why patients who adopted this strategy, although as breathless as hyperinflators when they stopped, exercised for less time and reached a lower intensity of power at equivalent levels of breathlessness.
Measurements of Vcw are normally identical to the volume change recorded at the mouth during spontaneous breathing5,7,10 or that measured in ventilated and paralysed patients.11 In our COPD patients there was good overall agreement between the inspiratory tidal volume and Vcw, amounting to an error of 0.8% at rest, equivalent to a difference of 5 ml in the resting tidal volume. This increased to a 9.5% error at maximal exercise, equivalent to a difference of 100 ml in the mean tidal volume. This difference is likely to arise from physiological rather than methodological factors. The change in Vcw tended to be larger than the volume change at the mouth and was more marked during expiration, reflecting the effect of gas compression and also the shift of blood between thoracic and extrathoracic regions.15
Our data have clinical implications. They help explain why spirometry is such a poor predictor of exercise capacity in individual COPD patients, since those with apparently better resting values can still be limited by their efforts to reduce end expiratory Vcw. Evidence from studies at rest in patients with COPD and with kyphoscoliosis26 suggest that the order of recruitment of the respiratory muscles during breathing is an automatic response of the central controller. This stereotyped behaviour may explain why some patients with COPD adopt a euvolumic breathing pattern during exercise. Whether previously euvolumic patients adapt to the onset of persistent tidal flow limitation and then allow Vcw to rise remains to be established. Some therapeutic interventions may work by modifying these volume related exercise responses. Thus, in healthy subjects, reducing the work of breathing can increase the oxygen consumption of the locomotor muscles,24,25 while in patients with COPD the major effect of supporting ventilation during exercise is to increase exercise duration in patients with the most marked abdominal muscle activation.27
In conclusion, exercise limitation in COPD and its attendant dyspnoea is not necessarily associated with dynamic pulmonary hyperinflation. Individuals vary in the strategy of respiratory muscle recruitment that they adopt and in the resultant change in compartmental chest wall volume. The reasons for this require further investigation, and the OEP technique may be helpful in understanding the effects of treatment on exercise performance in COPD.
REFERENCES
Footnotes
-
This work was supported in part by the European Community CARED FP5 project (contract no QLG5-CT-2002-0893).