Article Text

Abstract
Background: Lung density measurements by computed tomography have previously been found to be a more sensitive indicator of disease progression in emphysema of α1-antitrypsin deficiency than lung function measurements. The aim of this study was to investigate the predictive potential of several parameters, including CT scanning, for mortality in patients with severe α1-antitrypsin deficiency.
Methods: Over a 5 year period, 256 patients with α1-antitrypsin deficiency (PiZ phenotype) were assessed, of whom 254 underwent lung function testing and 197 had thoracic CT scans. Lung function, CT scans, health status (St George’s Respiratory Questionnaire, SGRQ), and other clinical data of survivors and non-survivors were compared and these parameters were applied to survival analyses.
Results: There were 22 deaths in this patient cohort, 10 of which were classified as “respiratory” deaths. Baseline lung function parameters (forced expiratory volume in 1 second (FEV1), carbon monoxide transfer coefficient (Kco)), and CT scores were significantly lower in the non-survivors than in the survivors. 170 of the 256 patients had complete data for entry into multiple regression analyses (Cox proportional hazards model). In the univariate analysis, upper zone expiratory scan had the best association with all cause (p = 0.001) and respiratory mortality (p<0.001), whereas FEV1 (p = 0.158 all cause, 0.015 respiratory) and Kco (p = 0.002 all cause, 0.012 respiratory) had poorer associations with mortality. Only age gave further independent predictive information regarding all cause or respiratory mortality when the CT scan was entered into the survival analyses.
Conclusions: CT scanning predicts respiratory and all cause mortality in α1-antitrypsin deficiency and appears to be superior to lung function parameters, especially FEV1.
- lung densitometry
- α1-antitrypsin deficiency
- emphysema
- computed tomography
- outcome measures
Statistics from Altmetric.com
Forced expiratory volume in 1 second (FEV1) is a widely accepted measure for the assessment and monitoring of obstructive airways disease. Because it is simple to measure, it has been used widely as an epidemiological tool to identify airflow obstruction and its relationship to environmental1,2 and genetic3,4 factors, and as an end point in clinical trials in patients with chronic obstructive pulmonary disease (COPD).5,6 FEV1 has also been used to stratify patients with COPD into those with mild, moderate and severe disease,7–9 and relates to the patient’s health status.10,11 More specifically, FEV1 is generally accepted as a predictor of all cause,12–16 respiratory,12–13,16,17 and even cardiovascular mortality,12–14,16,18 as well as of the risk of developing lung cancer.17,19
COPD comprises a complex group of diseases including bronchitis, fibrosis and narrowing of the small airways, and emphysema with airways collapse on expiration. These differing aspects of the disease can be assessed by more comprehensive physiological measurements of lung function and, in addition, the recent development of high resolution computed tomography (HRCT) has enabled emphysema to be visualised and quantified in life.20
However, although such assessments have not been used widely for epidemiological studies, measures such as gas transfer (that relates to alveolar surface area) and the extent of emphysema seen on HRCT scanning correlate as well as (if not better than) FEV1 with health status21 and exercise capacity4 in patients where emphysema is an integral component of the COPD. Furthermore, these measures are also sensitive to progression of disease in patients with COPD related to α1-antitrypsin deficiency.22 Indeed, these patients provide an ideal model for such studies because they develop their disease while young and it progresses rapidly so that health status is less affected by co-morbidities that become more prevalent with age.
Because α1-antitrypsin deficiency is a genetic condition it is possible to identify relatives of index cases who have a wide spectrum of respiratory impairment, thus enabling studies to span the range from normality to severe disease. The UK registry of patients with α1-antitrypsin deficiency therefore offers a unique opportunity to investigate the relationship of physiological, radiological, and health status features to respiratory and all cause mortality. This report investigates the predictive potential of these measures in relation to mortality in patients followed for up to 4 years.
METHODS
Between March 1996 and May 2001 256 patients with α1-antitrypsin deficiency of the PiZ phenotype (assumed PiZZ genotype) were assessed and followed up in our centre, 254 of whom underwent lung function testing and 197 of whom had a CT scan. These data were collected prospectively as part of a wider project to study the natural history of progression of disease in α1-antitrypsin deficiency. Ethical approval was granted by the local research ethics committee and the patients gave informed consent for the investigations. Data used in the analysis are taken from assessment at baseline entry into the programme. All patients had their health status assessed using the disease specific St George’s Respiratory Questionnaire (SGRQ) which provides a total score as well as individual scores for the three domains of activity, symptoms, and impact. The scores range from 1 to 100 with high scores indicating greater impairment. Full lung function tests were performed according to ARTP/BTS guidelines,23 including the measurement of post-bronchodilator (400 μg salbutamol) flow rates and carbon monoxide uptake as a measure of gas transfer using the single breath method. The results are expressed as a percentage of the predicted value for the patient’s age, sex and height.
HRCT scans were performed using a GE Pro Speed Scanner (General Electric Medical Systems, Milwaukee, USA) to obtain 1 mm slices as part of the baseline assessment. The scanner was calibrated weekly for water and air. A full scan was performed at maximal inspiration (10 mm intervals) and a limited scan on expiration (30 mm intervals) in 197 of the patients. Two slices were chosen for analysis: the level of the aortic arch (upper zone) and the level of the inferior pulmonary vein/right atrial confluence (lower zone).24 The data were subjected to density mask analysis, which is an automated method using a computer program to highlight lung voxels with a density of less than the arbitrarily chosen value of −910 Hounsfield Units (HU). The proportion of highlighted voxels expressed as a percentage of the total is the voxel index which reflects the proportion of emphysematous tissue.24
At the time of analysis, all patients or relatives were contacted to determine those who had died. In most cases these were known to the registry but the cause of death for all patients was confirmed from death certificates or hospital records. Only those deaths primarily related to emphysema, or an exacerbation of COPD including bronchial infection or pneumonia leading to respiratory failure, were classified as respiratory deaths. For the purposes of the present study, deaths due to pulmonary embolus were classified as non-respiratory (see later), as were post-transplant deaths. There were 10 transplant patients (eight lung and two liver), four of whom died (three lung and one liver). These patients were excluded from the multiple regression analyses.
Data analysis
For the scatter graphs, parameters in survivor and non-survivor groups were compared using the Mann-Whitney U test. All patients for whom data were available were included in these graphs, including patients who subsequently had transplants. In order to determine the predictive nature of the measurements obtained, forward stepwise regression analyses (SPSS) were carried out by the Cox proportional hazards method (survival analysis) composed of a univariate followed by a multivariate analysis. These analyses were only carried out in the 170 patients for whom complete data were available, and patients who subsequently had transplants were excluded. With the exception of the patient’s sex, continuous data were used for all covariates; we therefore made the assumption that risk of death increases in a linear fashion as the variable changes.
For the purposes of the Cox analysis, the follow up period was from the date of baseline assessment: the date of death minus the date of baseline assessment was used for the non-survivors, or the end date of the study minus the date of baseline assessment for the survivors.
RESULTS
Two hundred and fifty six patients were followed for 0.12–4.43 years (median 1.83 years, mean 2.14 years). One hundred and ninety eight of these had a history of smoking (24 of whom were current smokers) with a median pack year history of 20. There were 22 deaths over the 5 year period, of which three were following a lung transplant and one following a liver transplant (none included in the multiple regression analyses). Eight further patients were classified as non-respiratory deaths (table 1), which included one patient who died of multiple pulmonary emboli (patient 17). The remaining patients (n = 10) died of a documented respiratory cause as shown in table 1. Twenty one of the 22 patients who died had baseline post-bronchodilator flow rates measured and 20 were able to complete measurements of gas transfer and to have an HRCT scan. The Kaplan-Meier plot of the group for all cause mortality is shown in fig 1.
Cause of death and survival time from entry into the programme for the 22 non-survivors, classification as a respiratory or non-respiratory death, and whether or not the case was entered into the Cox proportional hazards analysis

Kaplan-Meier all cause survival plot for all PiZ patients on assessment programme (0 years, n = 256; 1 year, n = 208; 2 years, n = 118; 3 years, n = 75; 4 years, n = 42). Mortality rate = ~4% per year.
In the global analysis of all our study patients, those who died had worse baseline health status, lung function, and HRCT scans. Although this takes no account of how long the patients had been followed in the study and includes patients who subsequently had transplants, these plots illustrate that, on a gross basis, there are general differences in some baseline measurements between the groups. The individual data points with medians for the patients for several of these parameters are shown in fig 2 in which the patients are separated into survivors and non-survivors for both all cause and respiratory deaths. The results show the lower FEV1 (percentage predicted) and lower Kco (percentage predicted) in the non-survivors. The patients who died also had higher (that is, worse) CT voxel index scores for scans at both thoracic levels in inspiration and expiration, and higher SGRQ scores indicating worse health status.
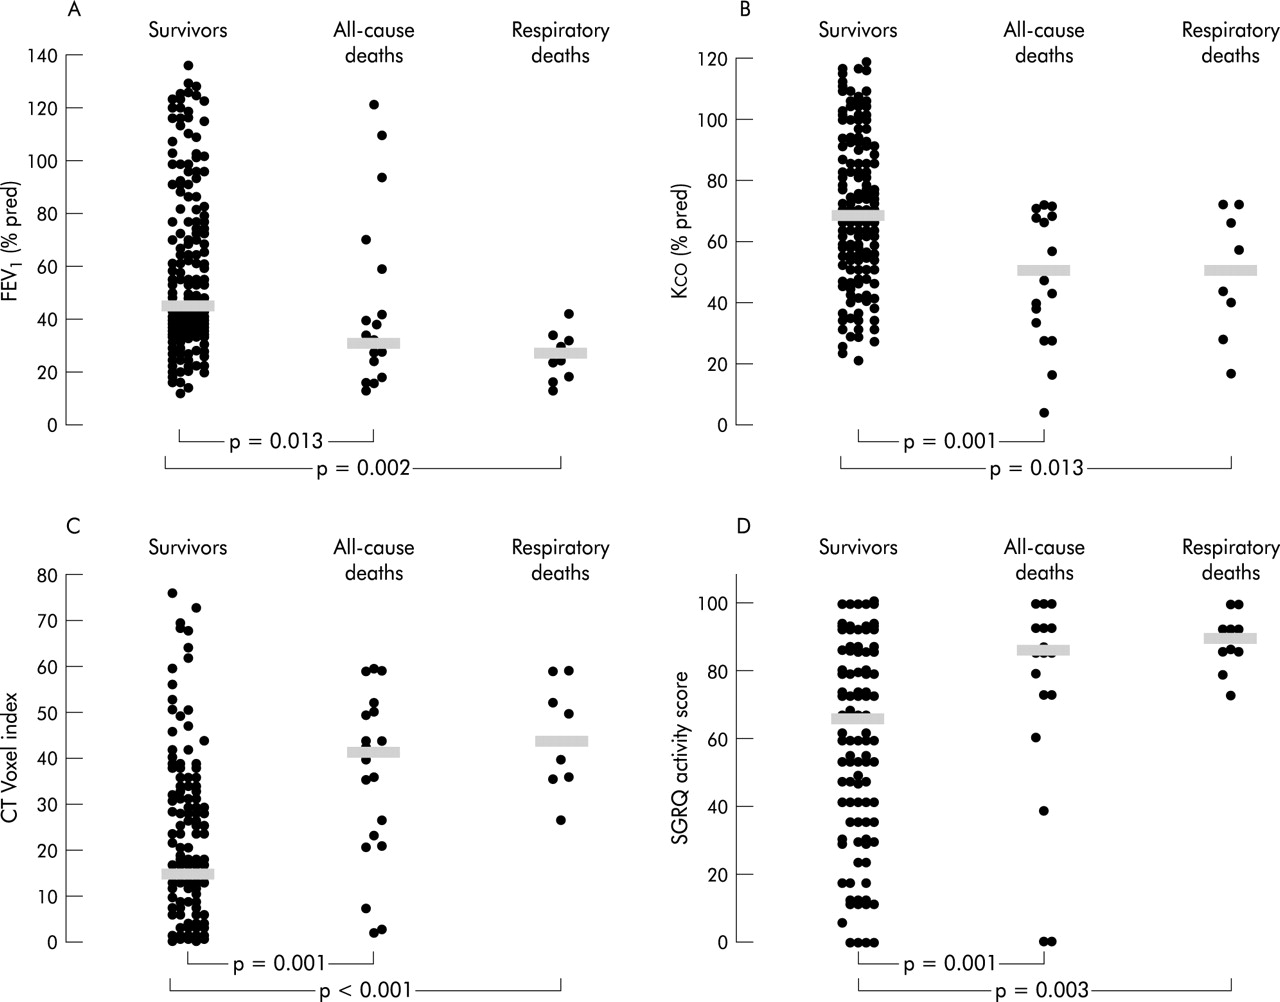
Scatter graphs for (A) forced expiratory volume in 1 second (FEV1) % predicted (n = 248), (B) carbon monoxide transfer coefficient (Kco) % predicted (n = 249), (C) upper expiratory scan voxel index (n = 196), (D) St George’s Respiratory Questionnaire activity scores (n = 255) in survivors, all-cause deaths, and respiratory deaths for all patients assessed in the programme. Each point indicates the baseline value for an individual patient and the horizontal bars indicate the median values.
For the more detailed Cox analyses (which took into account the times for which patients were followed and excluded patients who subsequently had transplants), 170 of the 256 patients (including 15 of the 18 non-transplant related deaths) had complete data available for entry. The initial univariate comparisons indicated that the upper expiratory scan had the best association with both all cause and respiratory mortality, followed by the lower expiratory scan (table 2).
Univariate analysis of parameters used to predict mortality as part of Cox proportional hazards method for all cause (n = 170 total, deaths = 15) and respiratory mortality (n = 164, deaths = 9)
Since several variables were significantly related to mortality in the univariate analysis, a forward stepwise multiple regression analysis was then performed in order to find how many or how few of them are needed to predict this outcome. The results of this multivariate analysis are shown in table 3 and confirm that upper and lower expiratory scans are the best independent predictor of all cause and respiratory mortality, respectively. In addition, only age gave further independent predictive information for either all cause or respiratory mortality (table 3).
Final result of multivariate analysis of parameters used to predict mortality as part of Cox proportional hazards method for all cause mortality (n = 170 total, deaths = 15) and respiratory mortality (n = 164, deaths = 9)
Kaplan-Meier plots showing respiratory deaths for the 170 patients included in the multiple regression analyses are shown in fig 3. These have been stratified into tertiles for a selection of the parameters significantly associated with mortality in the univariate analysis.

Kaplan-Meier plots showing respiratory deaths for the 170 patients entered into the Cox survival analysis, stratified into tertiles for (A) FEV1 % predicted (A = >63.8%, B = 37.5–63.8%, C = <37.5%); (B) Kco % predicted (A = >80.0%, B = 57.8–80.0%, C = <57.8%); (C) CT scan voxel index (upper expiratory view) (A = <8.1, B = 8.1–27.8, C = >27.8); and (D) SGRQ activity scores (A = <53.4, B = 53.4–83.0, C = >83.0).
DISCUSSION
This study provides unique data regarding predictive factors for mortality in α1-antitrypsin deficiency. At the present time there are few data in the literature on this subject, although Danish workers found an association between mortality and low FEV1,3 smoking,3 low body mass index,25 and patient acquisition26—that is, index cases have a worse prognosis than non-index cases identified by family screening. Larsson et al showed that the increased mortality of patients with α1-antitrypsin deficiency was also essentially related to smoking,27 and a large study from the USA showed that both age and baseline FEV1 were significant predictors of mortality.28
Our study confirms that FEV1 predicts respiratory mortality in patients with α1-antitrypsin deficiency, which is in keeping with previous extensive literature linking lung function with the likelihood of mortality. Probably the most well known study is that of Peto et al17 who followed nearly 3000 British men prospectively over 20 years and showed that the FEV1 was clearly related to mortality. This result has been reproduced by others including the Cracow study,14 Whitehall study,12 and studies in Chicago and Arizona,16 Maryland,15 and Renfrew and Paisley in Scotland.13 However, in our univariate analysis of 170 patients entered into the Cox proportional hazards analysis, although the FEV1 was lower in the all cause mortality group than in the surviving group, it failed to achieve predictive significance except for respiratory deaths. This disparity with the literature on total mortality is likely to reflect the smaller number of patients and deaths in the cohort studied here, as well as their younger age and hence decreased likelihood of death from non-respiratory causes.
We did not feel it was appropriate to classify the three lung transplant related deaths as respiratory since we wanted this group to reflect mortality due to the underlying disease alone. For this reason these patients were excluded from the subsequent analysis. The all cause mortality group is necessarily a heterogeneous collection of causes of death, but it is interesting and perhaps surprising that the conclusions of the regression analyses are the same as in the “purer” respiratory death group. It is noteworthy that, when transplants were included in the analysis of all cause deaths (results not shown), CT scanning still emerged as the best predictor of mortality. There was an argument for using the time of transplant as equivalent to time of death, using the concept of transplant-free survival, but this is problematic since patients are usually transplanted in the “window of opportunity” rather than at the end stage of their disease. The inclusion of these patients as “premature” deaths would therefore seem inappropriate when considering primary respiratory mortality.
Health status questionnaires are being used increasingly as measures of disease impact and as end points in clinical trials,21 but only a few studies have related health status to mortality in COPD. The Cracow study14 found health status to be an independent risk factor for mortality. Domingo-Salvany et al found health status, as measured by SGRQ total and Short Form 36 physical summary scores, to be independently associated with total and respiratory mortality in Cox models.29 In support of these previous reports, the SGRQ activity score was high in the univariate analysis ranking in the current study, but was not independently predictive of all cause or respiratory mortality in the multiple regression analyses when transplant patients were excluded from the analysis. However, the data emphasise the importance of health status measurements in COPD as part of patient assessment and as an indicator of prognosis.
Age was understandably2,16,28 associated with the likelihood of death in the univariate analyses for both all cause and respiratory mortality, and emerged as an independent predictor of mortality in the multiple regression analyses. The patient’s sex was not significantly related to likelihood of death and, perhaps surprisingly, neither was pack years history of smoking. This probably reflects the low numbers of never smokers included in the analysis (since such subjects rarely develop emphysema and do not therefore present to healthcare workers). Furthermore, data from our patients with α1-antitrypsin deficiency did not support recent evidence linking low body mass index or other measurements of nutritional status to mortality in more general COPD.30–33
Of major interest in the current study of patients with a genetic cause of emphysema was the predictive ability of Kco (which is a more specific measure of emphysema than FEV1) to both all cause and respiratory mortality. Indeed, in all analyses this physiological measure exceeded the predictive ability of FEV1, indicating that the severity of emphysema and not the degree of airflow obstruction is more likely to affect outcome (even though these measures are at least partly interdependent).
This concept was supported by the observation that CT scans consistently proved to be the best independent predictor of mortality. Although upper expiratory views had the best individual association with mortality, any of the other three views would have given almost as good a prediction of outcome. Data from our centre have already shown that CT scans (particularly expiratory views) are the most sensitive marker of progression of emphysema in α1-antitrypsin deficiency, supporting previous work from Europe.22 Furthermore, our group has observed that Kco, FEV1, health status,21 and exercise capacity4 all relate to the quantification of emphysema. However, despite these interrelationships, the CT scan analysis emerged as the best independent predictor of mortality in all models used in the current study.
Prognostic indices can be derived from the Cox proportional hazards analyses summarised in tables 2 and 3. The hazard ratios in these tables represent the multiplicative increase in the rate of mortality per unit increase in the predictor. For instance, if patient X has an upper expiratory CT scan voxel index 10 higher than patient Y, there is a 1.03910 (1.47) times rate of overall mortality and a 1.05410 (1.69) times rate of respiratory mortality. In PiZ phenotype patients with emphysema on our programme, we have previously found a mean increase of 5.7 in upper zone voxel index over 2 years which projects to 28.5 over 10 years. Therefore if the prognostic indices are applied to these longitudinal data, there is a 1.03928.5 (2.98) increased rate of overall mortality and 1.05128.5 (4.48) increased rate of respiratory mortality after a 10 year period in this group of patients. Prognostic indices such as these could influence the timing of lung transplantation, the cost-benefit analyses of therapeutic interventions, and the powering of trials where mortality is a primary end point.
The technique of measuring lung density by CT scanning was first described in 1988,34 but since then the most appropriate protocol for quantitative analysis of CT scans has not yet been agreed by consensus. Studies have shown that radiological scores relate to pathological changes20,34,35 and pulmonary physiology.24,36 In the current study a threshold of −910 HU, as used by Muller and colleagues,35 was chosen (although we used 1 mm rather than 10 mm sections37,38 to reduce overall radiation dosage), which was based on the best data available at the time the study was initiated. Thresholds of −950 HU have been suggested to be most sensitive for the detection of macroscopic emphysema on inspiratory scans,20,39 and a recent review has endorsed this value for emphysema studies.40 However, even if −910 HU proves to be a less appropriate threshold than −950 HU, the fact that the inspiratory scans were still more strongly associated with mortality should only strengthen the role of CT scans as a prognostic measure. Data acquisition can vary between scanners,40 so we performed all our scans using the same machine. In the Dutch-Danish pilot study of α1-antitrypsin augmentation therapy,22 where CT scores were found to be a better end point for the monitoring of emphysema than physiological parameters, the 15th percentile point of the total lung density histogram was used. This analytical technique and the voxel index technique used in the present study have, however, been found to correlate well in our patients (correlation coefficient rho = 0.95, p<0.001, unpublished data), suggesting that they provide similar information. Nevertheless, with differing views concerning the most sensitive and specific method for analysing CT scans to quantify emphysema or monitor progression, further studies will be necessary to determine whether other ways of analysing the CT data are even better independent predictors of mortality than the threshold method used here.
We have shown that physiological parameters other than FEV1 and, in particular, radiological assessment have better associations with mortality in α1-antitrypsin deficiency. Although this is a retrospective analysis of a prospectively followed cohort, we would argue that these parameters would therefore be more useful in the prediction of mortality in α1-antitrypsin deficiency than FEV1. It will be important to determine whether these findings can be reproduced in patients with the mixed injury and predominantly centrilobular emphysema associated with tobacco induced COPD.
In conclusion, the results presented here have clear implications for the assessment, management, and monitoring of patients with COPD and for the design of clinical trials involving patients with emphysema, at least in α1-antitrypsin deficiency.
Acknowledgments
The authors would like to thank Peter Nightingale at the University of Birmingham for statistical advice, Helen Wilkins for assistance with data collection and analysis, and Carole Seymour and Rebecca Lewis for coordination of patient assessment at the centre. Professor R A Stockley is a member of AIR (the α1-antitrypsin International Registry).
REFERENCES
Footnotes
-
The α1-antitrypsin deficiency assessment programme in Birmingham is supported by a non-commercial grant from Bayer plc.
Linked Articles
- airwaves