Article Text

Abstract
Aims: This study was designed to investigate the mechanisms by which the right ventricle is able to increase stroke volume (SV) during exercise in chronic obstructive pulmonary disease (COPD). A second aim was to determine whether resting pulmonary artery pressure (Ppa) is predictive of exercise SV.
Methods: 16 COPD patients (GOLD stages II–IV) underwent right heart catheterisation at rest and during exercise. In this group and eight age-matched controls resting and exercise right ventricular SV, end-diastolic volume (RVEDV) and end-systolic volume (RVESV) were assessed by magnetic resonance imaging (MRI). The exercise protocol during both measurements consisted of 3 minutes of cycling in supine position at 40% of maximal workload.
Results: In all patients mean Ppa increased significantly in response to exercise (21 (8) vs 33 (11) mm Hg, p<0.01), whereas pulmonary vascular resistance did not change. In the patient group, RVEDV (129 (42) vs 135 (42) ml, p<0.05) and SV (63 (13) vs 69 (14) ml, p<0.05) increased significantly from rest to exercise, but RVESV and RV ejection fraction remained unaltered. In contrast, in healthy controls SV is augmented (81 (22) vs 101 (28) ml, p<0.05) by both increased RVEDV (123 (33) vs 134 134) ml, p<0.05) and reduced RVESV (37 (9) vs 27 (10) ml, p<0.05). Resting mean Ppa was related to SV during exercise (r = −0.59, p<0.02).
Conclusion: As a consequence of unaltered pulmonary vascular resistance to exercise in COPD patients, Ppa increases and SV response to exercise is limited and results from an increased preload only. Ppa at rest predicts exercise SV.
Statistics from Altmetric.com
Advanced chronic obstructive pulmonary disease (COPD) is associated with changes in cardiac structure and function owing to increased pulmonary artery pressures.1 Before elevated pulmonary artery pressure (Ppa) is apparent at rest, patients with COPD may develop pulmonary hypertension during physical activity.2 3 This abnormal rise in Ppa is explained by the fact that pulmonary vascular resistance (PVR) does not decrease or might even increase during exercise in COPD patients. As a consequence, cardiac output augmentation during exercise is limited and will lead to an increase in Ppa. In contrast, in healthy subjects pulmonary vasodilation, through recruitment and distension of the pulmonary vascular bed, takes place during exercise and pulmonary blood flow increases. Hence, PVR is reduced and the Ppa increase is limited.4
Studies on the effects of exercise and the subsequent rise in Ppa on cardiac function have shown that right ventricular end-diastolic volume (RVEDV) increases5 6 and right ventricular ejection fraction (RVEF) fails to augment to exercise in most COPD patients.7–10 Right ventricular dilatation and a consequent unaltered RVEF, however, do not necessarily reflect an impaired stroke volume response.11 The question remains unanswered to what extent RV pressure changes during exercise affect RV volumes and hence SV response in this patient group.
Therefore, the first objective of this study is to investigate the exercise-induced changes in right ventricular end-diastolic volume and end-systolic volume in relation to stroke volume response in COPD patients and healthy controls; second, whether resting pulmonary arterial pressure is predictive of an abnormal stroke volume response to exercise in this patient group.
METHODS
Subjects
This study is part of a larger research project on the development of exercise-induced increases in pulmonary artery pressure in COPD that requires right heart catheterisation and exercise testing in all patients. The VU University medical ethics committee approved the study, and informed consent was obtained from all subjects. Sixteen patients with moderate to severe COPD (GOLD stages II–IV) and increasing symptoms during daily activities despite stable pulmonary function participated in the study. All patients had COPD according to ATS/ERS criteria.12 All patients were studied during a stable period of their disease. Patients with a history of cardiovascular disease, in the presence of an abnormal left ventricular function on echocardiography were excluded. A mean Ppa >25 mm Hg at rest or a mean Ppa >30 mm Hg during exercise confirmed the diagnose of pulmonary hypotension (PH) secondary to COPD.13
Study design
The following three measurements, which are described in more detail below, were performed in all COPD patients within one week on consecutive days: (1) a cardiac MRI scan, which was performed both at rest and during submaximal exercise, (2) a right heart catheterisation both at rest and during submaximal exercise, (3) extensive lung function testing followed by a maximal cardiopulmonary exercise test. The MRI scan and the right heart catheterisation were performed within 24 hours, and both exercise tests were performed on the same recumbent ergometer (Lode, Groningen, The Netherlands) at identical workload levels. As a control group eight gender-matched and age-matched healthy controls underwent pulmonary function testing and cardiac MRI both at rest and during submaximal exercise. The healthy controls did not undergo right heart catheterisation.
MRI measurements
The MR images and flow measurements were acquired with a 1.5 Tesla Siemens Sonata whole body system (Siemens Medical Solutions, Erlangen, Germany), equipped with a circularly polarised phased-array body coil. The ECG was recorded with MRI compatible leads, to enable prospective ECG-R wave triggering. The same MRI protocol was used for the resting and exercise measurements, as previously described.14 15 The MRI exercise protocol consisted of a three-minute period of cycling in supine position on a recumbent bicycle (Lode, Groningen, The Netherlands). For the patient group, work rate was increased in the first minute to 40% of maximal workload as previously determined during maximal exercise testing. The exercise level for healthy controls was set at 40% of the predicted maximal workload for gender, age, weight and length. Between exercise measurements a five-minute resting period was included.
To measure RV and LV volumes at end-diastole and end-systole, a stack of short-axis image planes covering the LV and RV from base to apex was acquired. From the stack of parallel short-axis cine images, quantitative analysis of right ventricular volumes and geometry was performed by manual detection of endocardial and epicardial borders on each slice, using the MR Analytical Software System (Medis, Leiden, The Netherlands). Stroke volume (SV) was measured using MR phase-contrast flow quantification.14
Right heart catheterisation
The tests were performed in the intensive care unit with the patient in stable condition breathing room air and continuous monitoring of ECG and systemic blood pressures. The right heart catheterisation was performed with a balloon-tipped, flow-directed 7F Swan-Ganz catheter (131HF7; Baxter Healthcare Corp; Irvine, CA, USA). Pulmonary artery pressures were taken at the end of expiration. Cardiac output was determined with the direct Fick method. Pulmonary vascular resistance was calculated as the ratio of mean pressure to cardiac output. Haemodynamic measurements were obtained at baseline and while cycling. The exercise protocol consisted of a three-minute period of cycling in supine position on a recumbent bicycle (Lode, Groningen, The Netherlands) with the Swan-Ganz catheter in situ. Work rate was increased in the first minute to 40% of maximal workload as previously determined during maximal exercise testing (as described below) and was identical to exercise MRI measurements.
Lung function and exercise testing
Pulmonary function was evaluated by standard spirometry, determination of carbon monoxide transfer capacity (DLCO), and measurement of functional residual capacity (FRC) and total lung capacity (TLC) following ERS/ATS guidelines.16–18 General characteristics and pulmonary function data are shown in table 1.
Maximal exercise tolerance and peak oxygen uptake (VO2) were assessed by a standard, incremental, maximal exercise test on an electronically braked cycle ergometer (Lode, Groningen, The Netherlands). Measurements of VO2 and carbon dioxide output were made breath-by-breath (Vmax229, Sensormedics, Yorba Linda, CA, USA). The exercise protocol consisted of 3 minutes of rest, 3 minutes of unloaded cycling at 60 rpm followed by a progressively increasing work rate to maximum tolerance and 3 minutes of recovery.19
Statistics
Data are presented as mean (SD). The SPSS 12.0 software package was used for statistical analyses and a value of p<0.05 was considered significant. A Wilcoxon signed rank test was used to compare between resting and exercise conditions. The Mann-Whitney U test was applied to compare cardiac function between healthy controls and COPD patients. Pearson correlation analyses were calculated to determine the correlations between haemodynamic and cardiac function data.
RESULTS
General characteristics
The results of the right heart catheterisation of the COPD patients both at rest and during submaximal exercise are presented in table 2. Nine out of 16 patients were diagnosed with PH: four patients showed PH at rest, in five patients exercise induced an increase in mPpa above 30 mm Hg. In all patients Ppa increased significantly in response to exercise, whereas pulmonary vascular resistance did not change. As shown in figure 1, exercise mPpa is related to resting mPpa in COPD patients.

Cardiopulmonary exercise test results from the COPD patients yielded a maximal workload of 36% (SD 18%) (percentage of predicted), a peak oxygen uptake of 49% (SD 12%) (percentage of predicted), peak ventilation of 66% (SD 16%) (percentage of predicted), ventilatory equivalent for CO2 at nadir of 48 (SD 15), peak oxygen pulse of 50% (SD 17%) (percentage of predicted) and a slope of oxygen uptake relative to workload of 7.2 (SD 2.4).
Cardiac function
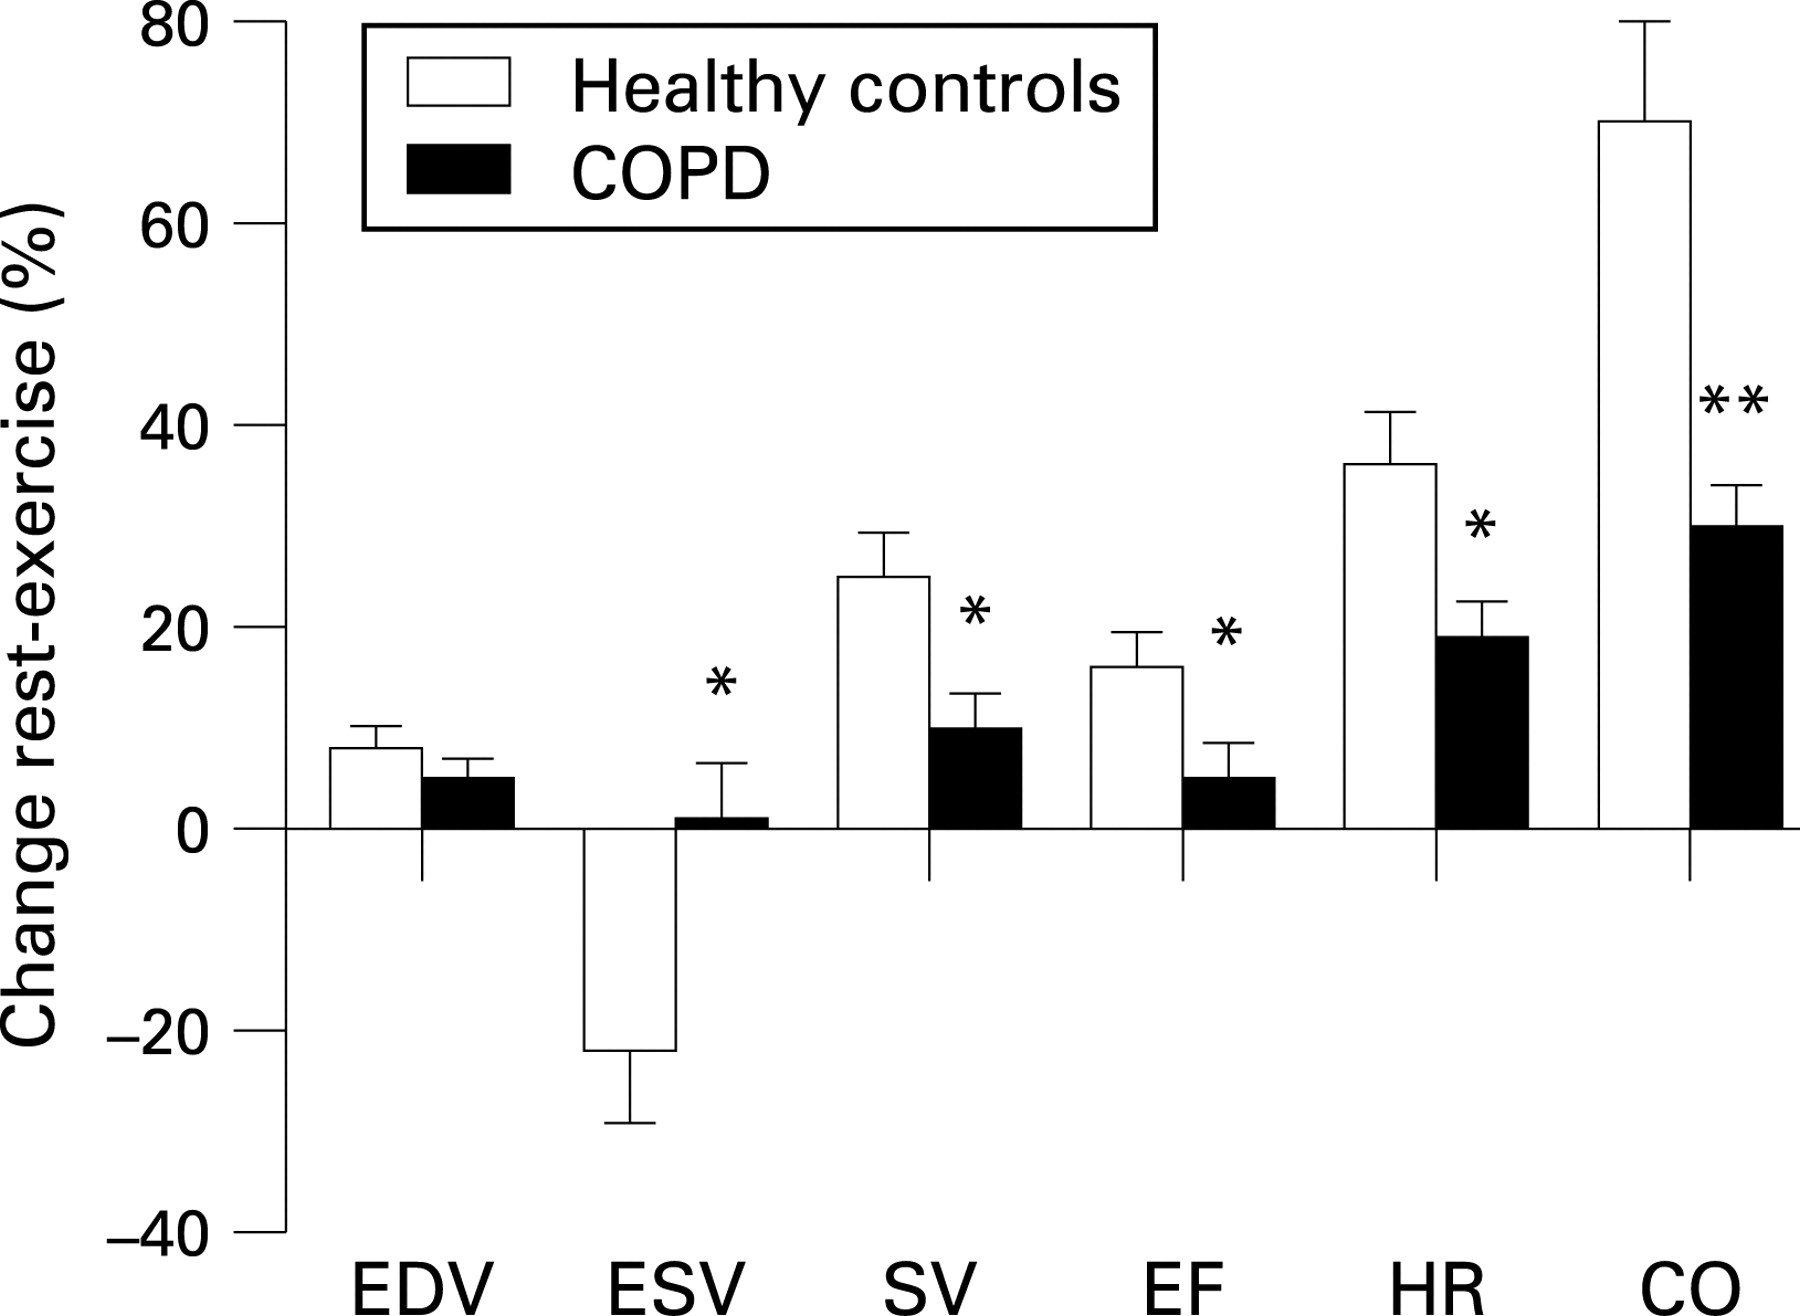
All patients and healthy subjects were able to perform the MRI exercise test at 40% of their maximal workload. Right and left ventricular characteristics at rest and during exercise of both groups are presented in table 3. Both heart rate and stroke volume were significantly augmented in exercise. However, the changes were significantly larger in the control group, and, as a consequence, cardiac output increased much more in the control group.
Figure 2 demonstrates the differences in right ventricular response to submaximal exercise between healthy controls and COPD patients. In the patient group, right ventricular end-diastolic volume (RVEDV) and SV increased significantly from rest to exercise, but RV end-systolic volume and RVEF did not. While in the COPD group SV is solely increased because of an increased RVEDV, SV in healthy controls is raised by both an increased RVEDV and a reduced RVESV. Stroke volume at rest and during exercise was significantly smaller in the patient group in comparison with healthy controls.
When the absolute change to exercise (exercise minus resting values) in SV is plotted against the absolute change in RVESV (fig 3), it shows that in three patients RVESV is increased and SV is reduced during exercise. These three patients demonstrated increased levels of Ppa at rest. In all COPD patients without PH at rest or during exercise SV was increased by exercise. Almost half the patients showed an augmentation of both RVESV and SV. As shown in figure 3, there is a significant inverse relation between the absolute change in exercise in both SV and RVESV (r = −0.56, p<0.03).

Relation pulmonary artery pressure and cardiac function
To investigate the predictive value of mPpa at rest on right ventricular structure and function during exercise, we assessed the relation between resting mPpa and SV, RVEDV and RVEF during exercise. Resting mPpa was inversely related to SV during exercise (r = −0.59, p<0.02). Furthermore, mPpa at rest showed a correlation with both RVEDV and RVEF during exercise (r = 0.75, p<0.001 and r = −0.80, p<0.001, respectively). In addition, a high mPpa during exercise is associated with a large RVESV during exercise.
DISCUSSION
This is the first cardiovascular MR study to show the mechanism by which right ventriclular stroke volume is augmented during exercise in COPD patients. The results show a limited increase in stroke volume to submaximal exercise, mainly resulting from larger EDV. In healthy controls, stroke volume augmentation to exercise was the result of both an increased right ventricular end-diastolic volume and a reduction in end-systolic volume. In addition, we found that in COPD a high resting mPpa was predictive for a low stroke volume during exercise.
Pulmonary artery pressure and stroke volume
Whereas pulmonary artery pressures may be elevated during daily activities in COPD patients,3 20 in general pulmonary hypertension at rest is only mild to moderate.21 Although, pulmonary artery pressures are modestly increased at rest, our results together with earlier studies showed that COPD patients have a reduced SV at rest.1 However, SV at rest was similar between controls and COPD patients when indexed for body surface area (41 (10) ml vs 34 (7) ml, p = 0.14, respectively). In addition, exercise leads to a rapid increase in pulmonary artery pressure even in patients with normal resting pressures. This increase in Ppa results from increased PVR as a consequence of hypoxic pulmonary vasoconstriction and a reduced pulmonary capillary bed.21 High Ppa levels may furthermore be explained by an increase in pulmonary vascular closure that can be accounted for by volume-induced stretching of alveolar vessels and by increased alveolar pressures as a consequence of dynamic hyperinflation. Hypoxic pulmonary vasoconstriction and remodelling could also lead to pulmonary vascular closure, and hence increased right ventricular afterload.22 One of the major findings of our study is that an increased pulmonary artery pressure at rest is related to a low stroke volume during exercise. In patients with idiopathic pulmonary artery hypotension (mPpa at rest = 51 (18) mm Hg) we have previously shown that, in spite of a small increase in RVEDV, SV was not augmented and LVEDV was decreased to exercise.15 Although, SV increased in the COPD group, this increase was modest and absent in three out of four COPD patients with PH at rest. In contrast to patients with idiopathic PH, increased RV preload during exercise did not affect left ventricular end-diastolic volume in the present patient group. The results suggest that cardiac performance during exercise in COPD patients can be staged between healthy controls and patients with advanced types of pulmonary arterial hypertension.
Right ventricular function
In the literature, there are few data concerning the effects of exercise on right ventricular function in both healthy subjects and COPD patients. An earlier study in young healthy adults has revealed that an increase in stroke volume during submaximal exercise in upright position is mainly caused by an increased preload of both the right and left ventricle.23 During supine maximal exercise, however, it was shown that in healthy controls SV was enhanced owing to a decrease in RVESV.24 25 The latter authors conclude that the enhanced right ventricular SV during progressive supine exercise seems more related to increased contractility than to the Frank-Starling mechanism. Mahler and co-workers used a combined haemodynamic and radionuclide approach to study RV performance during upright exercise in 12 COPD patients.7 Their data showed that RVEF remained unchanged during exercise, despite considerable changes in RVEDV and RVESV in individual patients. This finding is in agreement with our study. However, in Mahler’s study changes in right ventricle volumes during exercise were not related to stroke volume. In a group of 25 stable COPD patients, Biernacki and co-workers6 analysed the slope of the right ventricular end-systolic pressure-volume relation at rest and during exercise and concluded from their findings that despite the presence of PH right ventricular contractility remained relatively normal. In addition, in agreement with the present study, left ventricular function was shown to be preserved at rest1 and during exercise,8 whereas RVEF and mPpa were found to be related in COPD patients.26 What is new in our study is that we sought to find the relation between changes in SV and right ventricular volumes in order to gain a better understanding of the mechanism of impaired stroke volume response to exercise in COPD patients.
Our data showed that the elderly age-matched controls increase their stroke volume during exercise in supine position by increasing RVEDV and reducing RVESV. Although an increase in RVEDV was observed in the COPD patients, these patients failed to reduce RVESV. Consequently, stroke volume response was augmented whereas RVEF remained unaltered during exercise in these patients.
Based on these findings we conclude that both controls and COPD patients use the Frank Starling mechanism to augment SV in response to exercise. In controls RV contractility increased, Ppa remained unaltered and RVESV decreased. In COPD patients RV contractility was also increased, which would normally decrease RVESV, but the simultaneous increase in Ppa impedes ejection, resulting in an unchanged RVESV. The increase in Ppa is in part the result of the PVR that remains constant during exercise. Therefore, in contrast to controls the SV change to exercise results from an increase in preload only. To generate these high pressures and to maintain SV during exercise, the work of the right ventricle is disproportionally increased in COPD patients in comparison with healthy controls. Note that as a consequence of the study design (that is, different exercise levels between patients and healthy controls) we were able to show differences in the mechanism by which a maximal SV is induced during exercise; however, from our results we cannot conclude whether this RV response is normal or abnormal in the patient group.
Study limitations
Simultaneous pressure measurements and cardiac MRI could not be performed in our institute. Both measurements were therefore performed within 24 hours. A maximal supine exercise test appeared to be difficult to perform during MRI and too uncomfortable for the patients during right heart catheterisation. Therefore, a submaximal exercise level of 40% of previously determined maximal exercise level was used to assure a maximal stroke volume response.27 The same exercise level and bicycle ergometer was used during both tests.
Conclusion
In conclusion, in COPD patients SV increase is limited and results from an increase in end-diastolic volume only, and not from a reduced end-systolic volume. Impaired right ventricular contractility is related to pulmonary artery pressure.
REFERENCES
Footnotes
-
Funding: None.
-
Competing interests: None.