Article Text

Abstract
OBJECTIVE To determine whether oscillations in the cerebrovascular circulation undergo autonomic modulation in the same way as cardiovascular oscillations.
DESIGN Cardiovascular and cerebrovascular oscillations were monitored at rest and during sympathetic stimulation (head up tilt). The association with and transmission of the oscillations in the sympathetic (low frequency, LF) and respiratory (high frequency, HF) bands was assessed.
SUBJECTS 13 healthy volunteers, 10 subjects with vasovagal syncope, and 12 patients with complicated non-insulin dependent diabetes mellitus.
MAIN OUTCOME MEASURES Power spectrum analysis of cerebral blood flow velocity, arterial blood pressure, and heart rate. Coherence analysis was used to study the association between each pair of oscillations. Phase analysis showed the delay of the oscillations in the cardiovascular signals with respect to the cerebrovascular signals.
RESULTS The power in the sympathetic (LF) components in all the oscillations increased during head up tilt (p < 0.01) in the controls and in the subjects with vasovagal syncope, but not in patients with diabetes. Significant coherence (> 0.5) in the LF band was present between cerebrovascular and cardiovascular oscillations in most of the controls and in subjects with vasovagal syncope, but not in the diabetic patients (< 50% of the patients). In the LF band, cerebrovascular oscillations preceded the cardiovascular oscillations (p < 0.05) at rest in all groups: the phase shifts were reduced (p < 0.05) during head up tilt for all cardiovascular signals in healthy and syncopal subjects, but only for heart rate in diabetic patients.
CONCLUSIONS The cerebrovascular resistance vessels are subject to autonomic modulation; low frequency oscillations in cerebral blood flow velocity precede the resulting fluctuations in other cardiovascular signals. Autonomic neuropathy and microvascular stiffness in diabetic patients reduces this modulation.
- autonomic nervous system
- cerebral circulation
- syncope
- diabetes mellitus
Statistics from Altmetric.com
Although changes in carbon dioxide are known to be the main determinant of cerebral blood flow, under resting conditions the stability in carbon dioxide levels allows other mechanisms to operate in controlling the short term fluctuations in cerebral blood flow. The extent to which these mechanisms might be similar to those operating at heart level and in the peripheral circulation is at present largely unknown. In the peripheral circulation short term regulation mainly reflects the effect of arterial baroreceptors or central mechanisms, or both.1-3 This results in the generation of fluctuations in the range of 6 cycles/min (0.1 Hz) in the heart rate, peripheral blood pressure, and skin microcirculation. In addition, fluctuations caused by the effect of breathing are commonly observed in the heart and peripheral vessels.4-6 The use of power spectrum analysis has provided a powerful tool to describe both the spontaneous oscillations in the circulation,4 ,7-10 and, by using bivariate algorithms, the phase relation between pairs of oscillations.2 ,6 ,11 The coherence (that is, the strength of the relations) and their phase difference have proved useful in determining the association and the origin of the various fluctuations and their respective influences throughout the cardiovascular and respiratory systems.6
In the present study we have characterised the cardiovascular and cerebrovascular fluctuations in order to establish the extent to which the fluctuations in cerebral blood flow represent passive transmission from the rest of circulation or are an expression of peripherally generated mechanisms (local or distant) of vascular regulation. For this purpose we studied a group of healthy subjects and a representative selection of patients with different types of impaired cardiovascular control: non-insulin dependent diabetes mellitus, as an example of neural autonomic damage, and vasovagal syncope in otherwise healthy subjects, as an example of functional abnormality in cardiovascular control. The subjects were studied supine and during sympathetic activation induced by head up tilt.
We used the coherence and phase analysis to evaluate, respectively, the strength of the association between pairs of fluctuations and the timing of appearance of each oscillation in the different parts of the circulatory system. We reasoned that the finding of a consistent time relation between oscillations in cerebrovascular and cardiovascular signals (that is, blood pressure and heart rate) would indicate that the cerebrovascular fluctuations were driven by the same central mechanism rather than (or in addition to) a local regulatory mechanism.
Furthermore, if such blood pressure related cerebrovascular fluctuations preceded those in blood pressure, this might indicate that changes in tone in cerebral resistance vessels feed back to the central circulation and then influence general cardiovascular regulatory mechanisms, as has been found for the skin microcirculation.6 On the other hand, if cerebrovascular fluctuations follow blood pressure fluctuations, this would indicate that there is passive transmission from the central circulation.
Finally, if these cerebrovascular fluctuations were autonomically (sympathetically) mediated in the presence of intact baroreflex control, we reasoned that autonomic neuropathy should reduce the reflex increase in sympathetically related cerebrovascular fluctuations in response to manoeuvres stimulating sympathetic activity (for example, head up tilt), whereas no abnormality should be found in subjects with functional disorders (for example, vasovagal syncope). On the other hand, similar behaviour in both patients and healthy subjects, together with a lack of change in response to sympathetic activation in all subjects, would indicate that cerebrovascular fluctuations are primarily of local origin and hence relatively independent of autonomic control.
Methods
SUBJECTS
The local ethics committee approved the protocol for the study, and all subjects gave informed consent for their participation.
Investigations were carried out in 13 healthy volunteers (mean (SD) age 46.3 (5.8) years), in 10 subjects with vasovagal syncope (31.2 (4.5) years) diagnosed by clinical criteria and a positive response (hypotension and bradycardia) to head up tilt, and in 12 patients with non-insulin dependent diabetes mellitus (51.1 (5.3) years), who had had the disease for a long time (mean duration 8 (5) years) and were suffering from late complications (table 1). The presence of arterial hypertension was assessed by evaluating the averaged values of mean arterial blood pressure (calculated as: [diastolic pressure + pulse pressure]/3) measured on three separate occasions. Cardiovascular autonomic damage was assessed by the combined results of five standard tests based on cardiovascular reflexes12; the threshold for abnormal results of these tests was chosen in according to the results described by Ewing.13
Late complications in the patients with non-insulin dependent diabetes mellitus
PRE-EVALUATION OF THE SUBJECTS
Before the study, all subjects underwent transcranial Doppler (TCD) examination. Preliminary continuous wave Doppler investigations had assessed that all were free from haemodynamic stenosis of the extracranial carotid arteries. Recordings from the main basal intracranial arteries were performed with a 2 MHz probe (Multidop S, DWL, Sipplingen, Germany). Inadequate ultrasonic windows, intracranial stenosis, active intracranial collateral pathways, and interhemispheric asymmetry were considered to be criteria for exclusion.14The presence of vasomotor reactivity was assessed by calculating the per cent change in time-averaged mean blood flow velocity in the right middle cerebral artery of the dominant hemisphere before and at the end of breath holding.15 If the relative mean cerebral blood flow velocity increase during breath holding reached at least 15% above the normocapnic value, inadequate vasomotor reactivity was excluded.16 None of the subjects had abnormal TCD findings or inadequate vasomotor reactivity.
STUDY PROTOCOL
Data collection
The following signals were recorded directly and continuously on a personal computer (Macintosh IIx, Apple, Coupertino, USA) by a 12 bit analogue to digital converter (NB-Mio-16 board, National Instruments, Austin, Texas, USA; sampling rate 500 samples/s/channel): ECG (lead II), respiration (by an inductive thoracic belt), non-invasive arterial blood pressure (Finapres, Ohmeda 2300, Englewood, USA), and time-averaged mean cerebral blood flow velocity as above. Each subject was placed supine on a tilt table (Electro-Werk, type 1.73-0006, Hanning, Germany) in a quiet room. Temperature was kept constant at 20–22°C and the subjects were breathing room air. After 20–30 minutes of supine rest and familiarisation with the laboratory, recordings were performed in the supine position before tilting and in passive orthostasis, at least five minutes after tilting, over 20 minute periods.
Cerebrovascular monitoring
Cerebral haemodynamics were investigated by the same device described above, in the middle cerebral artery of the dominant hemisphere, as previous validation studies have shown that changes in mean cerebral blood flow velocity correlate highly with changes in cerebral blood flow.17 ,18 In order to avoid shifts of the probe from the appropriate position, and thus changes in the insonation angle, the 2 MHz probe was maintained in position by a specially designed holder, capable of varying the orientation of the probe, and fixed to an elastic band that was fastened around the skull. Further care was taken to avoid any contact between the probe holder and the surface of the tilt table—this could be achieved by using a properly shaped support placed on the table under the subject’s occiput, which did not contact the elastic band of the probe holder. Insonation depth was set between 51 and 60 mm, depending on the position that ensured maximum signal intensity. Sample volume axial length was 10 mm, and horizontal sweep speed was 10 seconds.
Head upright tilt has been claimed to induce dilatation of the middle cerebral artery,19 but such calibre changes have been shown to be negligible,20 and thus allow reliable interpretation of TCD data during head up tilt.
Owing to the tilt induced changes of respiratory activity, blood flow velocity data can be influenced by carbon dioxide changes during head up tilt21: during changing carbon dioxide concentrations the mean cerebral blood flow velocity bears a linear correlation with the changes in carbon dioxide.22 This is not relevant in the present study because the TCD signal was collected within two different steady states (supine rest and the standing position) when end tidal carbon dioxide monitoring showed steady values, and we did not compare between absolute mean cerebral blood flow velocity values in each of the steady states. Furthermore, data were not influenced by calibre changes of the insonated trunk of the middle cerebral artery because the carbon dioxide effect is restricted to the peripheral cerebrovascular bed, without affecting middle cerebral artery diameter to any appreciable extent.23 Finally, in a preliminary set of experiments, we tried to assess whether the slight downward shift of the brain structures during head up tilt might cause significant changes in the insonation angle. To do this, we studied 12 healthy volunteers during a head up tilt and evaluated the differences between the TCD mean velocity signal recorded with the probe fixed by the elastic device and the values obtained by manually searching for the best signal intensity at the same depth in 12 healthy volunteers. The maximum difference noted between the two measurements was 7%, thus indicating that this mechanical factor will cause only minimal errors in measurement.
DATA ANALYSIS
A “C” language program identified all the QRS complexes in each sequence, and then located the peak of each R wave. From these data, the RR interval time series were obtained, the respiratory signal was evaluated at the occurrence of the QRS peak, and systolic and diastolic blood pressure time series were also obtained. Linear detrending was applied to the data to remove slow baseline drifts. Premature beats were eliminated by linear interpolation.
Power spectrum analysis
Power spectrum analysis was applied to all signals using an autoregressive model.5 ,7 ,24 Spectral components were obtained by a decomposition method to measure the area below each spectral peak, and to obtain the distribution of “low,” “high,” and “very low” frequency components.5 ,7 ,24 The power spectrum of all signals except respiration shows at least two separate peaks5-9: the higher frequency peak is similar in both shape and central frequency to that of respiration. Although in the RR interval sequence this peak seems mostly to reflect the parasympathetic efferent activity, in the circulatory signals it is interpreted as a mainly mechanical result of respiration.5-9 ,25 This respiratory (high frequency, HF) component was identified by its coincidence with the peak of the respiratory spectrum, which served as a reference. It has been suggested that the low frequency (LF) component (between 0.03 and 0.15 Hz, with a peak normally at about 0.10 Hz in the RR interval), when unrelated to slow respiration, reflects changes in sympathetic tone,5-9 25-27 particularly in blood pressure. Finally, the oscillatory components between 0.001 and 0.03 Hz (called very low frequency, VLF), the origin of which is still unclear, were also measured but not considered in this report. The spectral powers of the RR intervals were expressed as normalised units, as previously described, and the LF/HF ratio was then calculated.5 ,10 This allowed comparisons of spectra from different individuals, even when wide differences in total power were present.
Coherence and phase analysis
The fact that two signals oscillate at the same frequency and that these oscillations undergo similar changes under different experimental settings suggests a common control mechanism. Nevertheless, oscillations might have the same frequency without being linked to one another in a stable way (that is, by a common origin). In order to verify the presence of a stable relation between the oscillations of pairs of signals, we measured their phase lag and performed a coherence analysis between the various signals obtained at baseline. The “squared coherence” function determines if two signals oscillating at the same frequency maintain a stable phase relation. This function spans from 0 (that is, no association) to 1 (maximum association). If a significant (> 0.5) coherence is found, then the two signals have a stable phase relation for a given frequency of oscillation, and hence are to be considered as synchronised to each other. In this case, it is possible to calculate the phase delay (measured in radians) between pairs of coherent oscillations. To compute the coherence function and phase shift we used the autoregressive method described by Baselliet al.28
STATISTICAL ANALYSIS
The results are given as means (SD). As the power spectrum of the various signals showed a skewed distribution, descriptive statistics were calculated after natural logarithm transformation. Comparison of results was obtained by factorial or repeated measures analysis of variance and, if a significant (p < 0.05) overall difference was obtained, Sheffe’s test was used to assess differences between various signals. Coherence function was used as a statistical test for each pair of oscillations. Linear regression analysis was used to assess the relation between the oscillations obtained in different body areas and between different signals. The frequency of significant coherences was compared in different groups or positions by the χ2 test with Yates correction, and by Fisher’s contingency tables when there was more than 1 degree of freedom (df). Comparisons between groups and positions for the phase shift values were made byt tests for independent and paired data respectively.
Results
RELATION BETWEEN CEREBROVASCULAR AND OTHER CARDIOVASCULAR FLUCTUATIONS
In general, we found a significant association (that is, coherence > 0.5) between fluctuations in cerebrovascular and other cardiovascular signals. Coherence data for low frequency and high frequency fluctuations in healthy, syncopal, and diabetic subjects are shown in table 2.
Coherence analysis between mean blood flow velocity and the other monitored variables
In the LF band, fluctuation in mean cerebral blood flow velocity in the supine healthy subjects was coherent (that is, statistically associated) with most of the cardiovascular signals (RR interval, diastolic blood pressure, systolic blood pressure). During tilting there was a slight increase in the number of subjects with significant coherence. Similar results were obtained in the subjects with vasovagal syncope (table 2). In the diabetic subjects significant coherence between mean cerebral blood flow velocity and the other signals was found less often than in the other two groups.
Because, as expected, there were no respiratory fluctuations in the LF band, no coherence was found between cerebral blood flow velocity and respiration.
In the HF (respiratory) band, significant coherence with cerebral blood flow velocity was present in most healthy and syncopal subjects, whereas it was less often observed in the diabetic subjects (table 2).
TIMING OF CEREBROVASCULAR FLUCTUATIONS
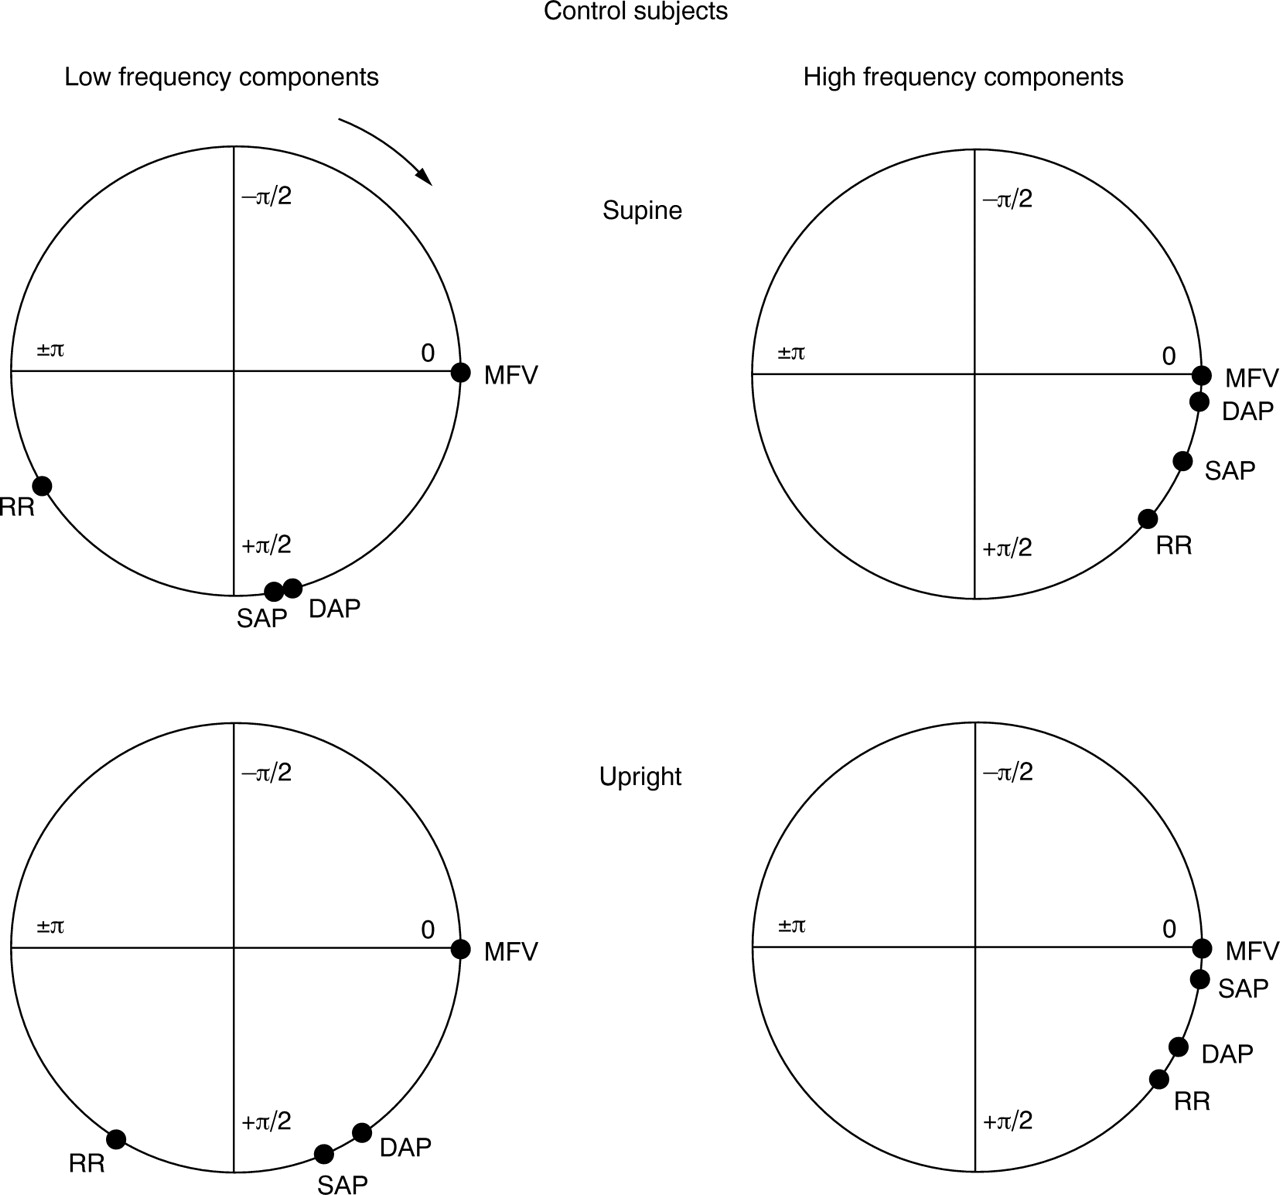
The significant coherence described above enabled us to calculate the phase delay between the oscillations in cerebrovascular and other cardiovascular signals. In general, we found that fluctuations in mean cerebral blood flow velocity preceded those in other cardiovascular signals (figs 1 and 2). Phase data for low frequency and high frequency fluctuations in healthy, syncopal, and diabetic subjects are shown in table 3.

Schematic diagrams of phase relations between cerebrovascular (as mean cerebral blood flow velocity, MFV), diastolic and systolic arterial pressure, and heart rate fluctuations in healthy controls. Signals were evaluated in the supine (upper diagrams) and upright (lower diagrams) positions, in the low frequency (LF) bands (left diagrams) and the high frequency (HF) bands (right diagrams). Taking MFV as reference (0 rad), delay in the same fluctuation for each signal is reported on the circumference (equivalent to a complete fluctuation period, that is, 2 π) at a distance corresponding to the phase delay with respect to MFV. If a signal is positioned clockwise with respect to MFV, its fluctuations lag behind those of MFV. In the LF band in the supine position, arterial pressure fluctuations significantly lagged behind those in MFV, but preceded those in heart rate: these phase lags decrease in the upright position. Slight phase shifts can be observed in the respiratory band. DAP, diastolic arterial pressure; MFV, mean cerebral blood flow velocity; RR, RR interval of the ECG; SAP, systolic arterial pressure.

Schematic diagrams of phase relations between cerebrovascular (as mean cerebral artery blood flow velocity, MFV), diastolic and systolic arterial pressure, and heart rate fluctuations in diabetic patients. In the low frequency (LF) band in the supine position, the phase lag of arterial pressure fluctuations with respect to MFV is shorter than in the controls (fig 1). In the upright position, there is only a slight reduction of the phase delay of heart rate fluctuations in comparison with those in MFV. DAP, diastolic arterial pressure; MFV, mean cerebral blood flow velocity; RR, RR interval of the ECG; SAP, systolic arterial pressure.
Phase shift (radians) between mean blood flow velocity and the other monitored variables
In the LF band in both controls and syncopal subjects, fluctuations in cerebral blood flow velocity preceded those of the other cardiovascular signals (fig 1). During tilting there was a significant shortening of the phase shift between mean cerebral blood flow velocity and other cardiovascular signals (table 3). Also, in the diabetic group the cerebral blood flow velocity fluctuations in the LF band (table 3) preceded those of the cardiovascular signals. However, with respect to diastolic and systolic blood pressure, the delay was shorter than in the other groups, and during tilting there was no significant shortening of the phase lag of the blood pressure values in relation to the cerebral blood flow velocity (fig 2). Phase shift shortening was only observed between mean cerebral blood flow velocity and RR interval (table 3).
In contrast to the LF band, in the HF (respiratory) band, cerebral blood flow velocity did not precede the other signals: all data in the three groups were concentrated at near zero phase lag with respect to mean cerebral blood flow velocity (table 3). During tilting there was no change of the phase lag between the various signals with respect to cerebral blood flow velocity (table 3).
AUTONOMIC NEUROPATHY AND SYMPATHETIC ACTIVATION
In controls and in subjects with vasovagal syncope the mean cerebral blood flow velocity power in the LF band increased during tilting, as did the LF power of the RR interval (in normalised units), systolic blood pressure, and diastolic blood pressure (table 4). In these subjects, the RR interval variability in LF and HF decreased, and heart rate and LF/HF ratio increased with tilting, owing to a decrease in the HF component (in normalised units) of the RR interval variability (table 4). In contrast, subjects with autonomic neuropathy (the diabetic group), unlike the other groups, did not show any significant increase in LF power with tilting (table4).
Power spectrum analysis in the supine and standing positions
Discussion
Oscillations of cardiac rhythm and of diastolic and systolic blood pressure waves have been known for a century.29Mathematical techniques for the analysis of oscillatory phenomena have led to the discovery that heart rate and blood pressure undergo similar fluctuations, which are regulated by the autonomic nervous system—probably to a large (though not exclusive) extent through the baroreceptor reflex arc.25 ,27 Because of their relative stability, these fluctuations can be described by spectrum analysis techniques, which have provided a new tool for investigating the autonomic system.
SPONTANEOUS OSCILLATIONS IN THE NORMAL SUBJECTS
The first result of our work was to show the presence of oscillations in mean cerebral blood flow velocity—in addition to oscillations in RR interval and systolic and diastolic blood pressures—which can be analysed by spectral analysis and that show a consistent association with oscillations in other cardiovascular signals. The low frequency oscillations from the vascular bed are considered a marker of sympathetic efferent activity to the vessels, which is dependent on intact baroreflex control (through the sympathetic efferent branch).5 ,8 ,25 ,27 The finding of low frequency oscillations in the mean cerebral blood flow velocity can be also considered as a marker of sympathetic modulation in these structures (through baroreflex activity). However, these slow oscillations could be independent of central control and may be the result of local oscillatory phenomena in vascular smooth muscle. To assess this point we performed bivariate spectral analysis of mean cerebral blood flow velocity and RR interval, systolic blood pressure, and diastolic blood pressure signals. The coherence function was used to establish whether or not there was a stable phase relation between oscillations at the same frequency, common to the mean cerebral blood flow velocity and other cardiovascular signals.
We found that the low frequency oscillations of mean cerebral blood flow velocity were related to the low frequency oscillations present in the RR interval and in the blood pressure in most control subjects in the supine position. This suggests there is indeed a strong relation between low frequency oscillations in the mean cerebral blood flow velocity and in the other signals, although it does not specify whether this is the result of passive transmission from the central arteries (for example, the aorta) or has an independent peripheral origin. Phase analysis consistently showed that the low frequency oscillations in the cerebral vessels preceded those in blood pressure and RR interval, indicating that passive transmission of such fluctuations from the blood pressure to the more distal vessels is unlikely. This finding is similar to recent reports on the skin microvessels,2 ,6and suggests that the low frequency oscillations may have a peripheral origin (nervous) in the arterioles (including cutaneous and cerebral vessels) and can be then transmitted “upstream” back to the larger arteries. This important finding indicates that the low frequency oscillations seen in the cerebral blood flow are most likely originate in the cerebral circulation as a result of autonomic (probably sympathetic) modulation.
In the respiratory fluctuation band, the vascular signals appeared to be highly interrelated (table 3), but the phase shifts of the RR interval and of systolic and diastolic blood pressure with respect to cerebral blood flow velocity were negligible. This does not support the hypothesis of a peripheral origin of these fluctuations, which in this case may instead be related to passive transmission from the aorta to the peripheral arteries. This again confirms similar findings in the skin microvessels,2 ,6 and indicates that the respiratory fluctuations present in the vascular signals most probably reflect alterations in stroke volume caused by respiration induced changes in venous return.
CHANGES INDUCED BY TILT IN THE NORMAL SUBJECTS
Changing from the supine to the standing position causes sympathetic activation which can be detected by an increase in the LF band of the RR interval and blood pressure fluctuations.5 ,26 Thus the simultaneous increase in low frequency oscillations of cerebral blood flow velocity and blood pressure suggests that the cerebral flow velocity waveform is also sensitive to sympathetic activation. In orthostasis, the coherence function between all the cardiovascular signals was more often significant, thus suggesting a general synchronisation of the cardiovascular system in the LF band. The lack of coherence observed in some subjects in the supine position and when standing might be the result either of a low sympathetic activity or of the predominant influence of local control mechanisms, which dominate the autoregulatory pattern under these circumstances.6
In the upright posture we observed a significant shortening of the phase delay between mean cerebral blood flow velocity and blood pressure fluctuations in the control subjects. Although the present study cannot offer an explanation for this phenomenon, it is possible that this shortening reflects stiffening of the distal vessels as a result of the sympathetic activation.
As the efferent sympathetic control occurs at the arteriolar level,30 the low frequency fluctuations found in cerebral blood flow velocity could be an index of sympathetic modulation in the vascular territory of the middle cerebral artery. The ability to increase sympathetic tone when assuming the upright posture can therefore provide information on the integrity of the sympathetic efferent branch of the baroreflex control of the cerebral circulation. These results might thus form the basis of a clinical tool for evaluating the autonomic regulation of cerebral blood flow; an early impairment of vascular control has reported in diverse diseases such as diabetes,31-33 cirrhosis of the liver,34 and hypertension.35
VASOVAGAL SYNCOPE AND DIABETES
The study of the coherence and phase shift in the LF band indicates a different pattern of abnormalities in vasovagal syncope and in diabetic patients, and suggests that there is no abnormality in cerebral vascular control in people with vasovagal syncope. The high coherence between cerebral blood flow velocity and the other signals in the LF band in subjects with vasovagal syncope also indicates that the control of the cerebral circulation in these subjects is essentially normal. Hence, the reason for the occurrence of vasovagal syncope might lie in other vascular domains.36-38 In support of this, we have previously show that low frequency oscillations of the diastolic blood pressure are reduced minutes before the onset of vasovagal syncope in adolescents,36 and, in agreement with Hayoz et al,37 that the sympathetic drive to the lower limb muscle vessels is reduced before the onset of vasovagal syncope.38
The relations between low frequency oscillations of cerebral blood flow velocity, blood pressure, and the RR interval are less well seen in diabetic patients. In addition, the phase shift between mean cerebral blood flow velocity and blood pressure is reduced and remains unchanged with head up tilt. Owing to the presence of a high degree of both vascular and autonomic abnormalities in these subjects, it is difficult to determine the precise mechanism of the changes observed. However, while they are evidently the result of the impaired ability of diabetic patients to adapt their control mechanisms to a changes in posture, it is also possible that increased stiffening of the vessels typical of the diabetic atherosclerosis—together with the reduced sympathetic activation evident in these patients in this and previous studies,39 ,40—might have determined both a reduced phase delay at rest and a lack of shortening during a manoeuvre supposed to increase sympathetic activity. Therefore, this lack of change in phase shift can be interpreted as the result of a loss of autonomic regulation and indicates that abnormalities in the autonomic nervous system present in diabetes can also affect the control of the cerebral circulation.
CONCLUSIONS
Our data show that cerebral blood flow is similar to the flow in other peripheral vessels in terms of autonomic regulation. Under resting conditions, with stable carbon dioxide levels and avoiding stepwise changes of blood pressure, neural modulation of the fluctuations in the cerebrovascular signals seems generally to predominate over local autoregulatory mechanisms. Our data also indicate that the low frequency oscillations present in cerebral blood flow velocity reflect sympathetic activity in the presence of intact baroreflex control, and are caused by the action of the sympathetic nervous system on the vascular smooth muscle in the cerebral vessels. This activity is transmitted back to the larger arteries. The phase delay between these low frequency oscillations and similar low frequency oscillations present in other signals lessens with head up tilt, probably because of sympathetically induced stiffening of the distal vessels. These changes were preserved in subjects with vasovagal syncope but were absent in diabetic patients with vascular and autonomic abnormalities. This suggests that the underlying abnormalities in patients with vasovagal syncope might not be related primarily to the autonomic control of cerebral vessels, although this could be a further adverse factor in the development of cerebral vascular accidents in subjects with diabetic neuropathy or microangiopathy.