Article Text

Abstract
Objective Pre-capillary pulmonary hypertension (PHT) is characterised by progressive pulmonary vascular obliteration and loss of vascular reserves. In health, regional lung perfusion redistributes under the influence of gravity due to the presence of recruitable vessels. We investigated a combined single photon emission computed tomography/CT (SPECT/CT) method for assessing the pulmonary circulation by quantifying the gravity dependent redistribution of lung perfusion.
Design Characterisation of patients versus healthy controls.
Patients 15 patients with pre-capillary PHT and 11 healthy controls.
Setting University hospital clinic.
Intervention Regional lung perfusion was measured using SPECT/CT in two different postures (supine vs upright). A perfusion redistribution index (PRI) was used to quantify the cranial–caudal shift in regional lung perfusion resulting from gravitational (postural) change.
Main outcome measure PRI was compared between cases and controls, and correlated with markers of disease severity in cases.
Results Patients with pre-capillary PHT had notably reduced PRI compared to controls (0.02±0.06 vs 0.28±0.15 normalised perfusion/cm, p<0.0001). PRI was significantly associated with prognostic parameters such as 6 min walk distance (r=0.60, p=0.018), functional class (p=0.008), and tricuspid annular plane systolic excursion (r=0.58, p=0.022). The receiver operating characteristic curve showed that PRI differentiated patients with pre-capillary PHT from controls with AUC=0.94 (p<0.001).
Conclusions With SPECT/CT, gravity dependent redistribution of lung perfusion can be quantified using the PRI derived from supine and upright perfusion analysis. The potential utility of PRI for the non-invasive detection of PHT and assessment of disease severity warrants further study.
Statistics from Altmetric.com
Introduction
Pulmonary vascular disease is characterised by progressive obliteration and remodelling of the pulmonary arteries resulting in loss of vascular reserves and the development of pre-capillary pulmonary hypertension (PHT).1 The normal pulmonary circulation is a low resistance, high capacitance circuit with the ability to accommodate the entire cardiac output at low arterial pressure.2 An important feature of the normal pulmonary circulation is the presence of vascular reserves that are available for recruitment.3 In the upright posture, the majority of vascular reserves reside in the apical vessels due to the effect of gravity on regional lung perfusion.4 ,5 In the supine posture, perfusion redistributes towards the vascular reserves located in the lung apices resulting in a more homogeneous cranial–caudal perfusion profile.6 Hence, lung perfusion normally redistributes under the influence of gravity, and is related to the presence of functional vascular reserves.
Single photon emission computed tomography (SPECT) has been applied for many years to the study of lung perfusion in vivo, and in the diagnosis of pulmonary embolism.6–8 With SPECT, regional lung perfusion can be studied using radiotracers that remain temporarily trapped in the pulmonary circulation immediately following administration. Thus, the effect of gravity (or posture) on regional lung perfusion can be studied via injection of radiotracers during upright and supine body positioning.
The purpose of this study was to evaluate an objective quantitative measure of gravity dependent perfusion redistribution using SPECT/CT perfusion imaging. We hypothesised that the gravity dependent redistribution of lung perfusion would be attenuated in patients with pre-capillary PHT, compared to healthy controls. Furthermore, we aimed to assess whether quantifying perfusion redistribution could accurately differentiate healthy controls from patients with pre-capillary PHT, and evaluated the relationship between perfusion redistribution and markers of disease severity.
Methods
Study subjects
A total of 26 subjects underwent SPECT/CT perfusion imaging with supine and upright radiotracer injections. Eleven healthy subjects who were all non-smokers with no history of cardiac or respiratory illnesses served as controls. Fifteen subjects with pre-capillary PHT (determined invasively at right heart catheterisation (RHC) by a mean pulmonary artery pressure (PAP) ≥25 mm Hg and pulmonary capillary wedge pressure <15 mm Hg) were recruited from the Royal Prince Alfred Hospital PHT Clinic. Ten subjects had pulmonary arterial hypertension (PAH) and five had chronic thromboembolic PHT (CTEPH) according to diagnostic categories from recent European Society of Cardiology/European Respiratory Society guidelines.9 Patients with significant intrinsic lung disease (forced expiratory volume in 1 s (FEV1) <70% predicted or forced vital capacity <70% predicted) were excluded from the study. The median time between SPECT/CT imaging and last RHC was 34 months (IQR 12–42 months). Echocardiography and 6 min walk distance (6MWD) were both obtained within 1 week of SPECT/CT imaging. Echocardiography parameters included systolic PAP derived from peak tricuspid regurgitation velocity and tricuspid annular plane systolic excursion (TAPSE) as a measurement of right ventricular contractile function. The study protocol was approved by the local ethics committee and was designed to keep total radiation dose to all subjects less than the limit suggested in national guidelines. All subjects provided informed consent to participate in the study.
Radiotracer administration
Each subject underwent SPECT acquisitions with supine and upright radiotracer administrations, in randomised order. For supine administration subjects were initially instructed to lie supine for at least 3 min. This was followed by inhalation of 99mTc-Technegas (Technegas, CycloMedica, Sydney, Australia) during tidal breathing to achieve 25–35 MBq of radioactivity within the lungs. Following acquisition of the SPECT ventilation data, subjects remained in the same supine position and 100–110 MBq of 99mTc macroaggregated albumin (MAA) (DraxImage MAA, Jubilant DraxImage Inc, Quebec, Canada) was injected intravenously to obtain the perfusion data. For upright administration, subjects were seated upright for 3 min before inhalation of Technegas, and remained upright for 2 min following inhalation before reclining to a supine position for acquisition of the ventilation SPECT data. Subjects were then instructed to sit upright as before for 3 min before intravenous injection of 99mTc-MAA. Similarly, subjects remained upright for 2 min following injection before lying supine for scanning. Subjects were instructed to maintain normal tidal breathing during radiotracer administrations. As both Technegas and 99mTc-MAA become rapidly trapped and fixed in the lungs after administration, supine and upright radiotracer administrations will capture the representative pulmonary physiology of the injection posture. The supine and upright SPECT datasets were acquired at least 48 h apart, to allow complete elimination of radiotracer activity.
SPECT/CT acquisition and image reconstruction
SPECT was acquired with dual detector gamma cameras using a 128×128 matrix at 15 s per projection for 120 projections (60 per detector, 3° radial increments) fitted with low energy, high resolution collimators. This was followed by a CT scan at functional residual volume using a beam current of 30 mA, a tube voltage of 130 kVp, and a pitch of 1.5 giving a slice thickness of 4 mm. SPECT images were acquired using either a SymbiaE gamma camera (Siemens Healthcare, Malvern, USA) or a SKYLight gamma camera (Philips, Milpitas, USA) followed by a CT acquired on either a PQ5000 CT scanner (Picker Corp, Cleveland, USA) or a Biograph mCT.S/64 CT (Siemens Healthcare, Malvern, USA).
Studies were reconstructed using an iterative reconstruction using the ‘ordered subset expectation–maximisation’ algorithm with eight subsets of the projection data and four iterations.10 After reconstruction, the data were filtered with a 3D Butterworth filter (order of 1.2 and cut-off of 0.8 cycles/pixel). Attenuation and scatter correction were performed using a CT derived attenuation map that was generated by converting the CT Hounsfield units to the linear attenuation coefficients (μ) for 99mTc to provide quantitatively accurate SPECT images.11 A transmission dependent scatter correction method using the CT data was used to correct for scatter in the projection data.12 After image reconstruction, all image sets were spatially aligned by co-registration to the CT scan, thereby permitting volume based comparison. The total effective dose of radiation for each subject undergoing SPECT/CT was ∼4 mSv (low dose CT, 1.1 mSv; SPECT (supine + upright), 2.95 mSv).
Perfusion gradients and perfusion redistribution
SPECT datasets were analysed using custom software developed using the Interactive Data Language programming platform (IDL, ITT, Boulder, USA). The perfusion data were corrected for the remaining ventilation activity by an automated image subtraction procedure after decay correction. Ventilation data were acquired to ensure that our current subjects did not have perfusion defects resulting from significant ventilation abnormalities, and for the potential ability to analyse regional V/Q ratios (data not presented). Given that the total ventilation activity is approximately four times lower than the total perfusion activity, this subtraction algorithm has minimal impact on the perfusion images when combined with radioactive decay.13
As subjects have different lung heights, we chose a pre-specified region of interest (ROI) spanning 14 cm along the cranial–caudal plane for analysis. Using the co-registered CT scan for anatomical co-localisation, this ROI was centred on a reference plane aligned to the midpoint of the bronchus intermedius, which approximates the mid-plane along the cranial–caudal axis of the lungs. The ROI also avoided inclusion of perfusion data at the extreme uppermost and lowermost lung regions due to edge effects (figure 1).

Acquisition of SPECT/CT perfusion data. Subjects underwent supine and upright radiotracer injections (in randomised order) to obtain perfusion maps of the corresponding posture. A region of interest (ROI) along the cranial–caudal axis was selected for perfusion data analysis. This ROI was centred along a reference plane which corresponded to the mid-plane of the lung along its cranial–caudal axis.
Axial CT slices were manually segmented by visual delineation of lung margins combined with an in-house software algorithm which automatically extracted the lungs from the CT data. The volume of each lung slice was determined from cross sectional area and slice thickness. Given the slightly different actual doses of 99mTc-MAA delivered for each scan and different degrees of gamma photon absorption for subjects of different sizes, the total detected radioactivity events varied. Normalisation of perfusion data was achieved firstly by dividing the reconstructed events for each slice over the total events recorded over the lung ROI. This provided ‘fractional perfusion per lung slice’ (ie, the total will sum to 100%). As each slice was 4 mm in thickness, each transverse slice was then multiplied by 1/0.4 in order to derive the final normalised perfusion data which represented ‘fractional perfusion per cm’. Linear regression was used to calculate upper-to-lower zone perfusion gradients for respective postures.
In order to quantify the degree of lung perfusion redistribution between supine and upright postures, the normalised perfusion plot of the supine scan was subtracted from the normalised perfusion plot of the upright scan (for each corresponding lung slice) to generate a Δ(supine−upright) normalised perfusion plot. The Δ(supine−upright) normalised perfusion plot quantifies the degree of perfusion redistribution related to postural change. An increasingly positive slope of the Δ(supine−upright) plot represents redistribution of perfusion to the lung bases when upright. Linear regression was performed on the Δ(supine−upright) plot with the slope defined as the perfusion redistribution index (PRI) (figure 2).

Representative perfusion plots from study subjects. A plot of the normalised perfusion for each axial lung slice was generated along the region of interest . On the x axis, 0 cm refers to the reference mid-plane of the lung, with caudal regions to the left and cranial regions to the right. The supine perfusion plot (red), upright perfusion plot (blue) and Δsupine−upright perfusion plot (green) are shown for the left and right lungs. The slope of the Δsupine−upright perfusion plot was defined as the perfusion redistribution index (PRI). The PRI was then adjusted for the differential perfusion contribution from the left and right lungs. (Upper panels) In a healthy control, supine and upright perfusion plots are clearly different, resulting in a Δsupine−upright perfusion plot with a significantly positive slope indicating redistribution of pulmonary perfusion resulting from postural change (PRI=0.26 normalised perfusion/cm). (Middle panels) A patient with pulmonary arterial hypertension (PAH) demonstrating almost identical supine and upright perfusion plots, resulting in a Δsupine−upright perfusion plot with a slope close to zero, indicating loss of perfusion redistribution (PRI=0.01 normalised perfusion/cm). (Lower panels) A patient with chronic thromboembolic pulmonary hypertension (CTEPH) with similar reduction in perfusion redistribution (PRI=0.06 normalised perfusion/cm). Due to large vessel vascular obstruction in different arterial territories, the supine (and upright) perfusion profiles are inhomogeneous.
A weighted average PRI for each subject was then calculated adjusting for the proportion of total lung perfusion supplying each of the left and right lungs:
PRI=PRIleft×(% total perfusion to left lung)+PRIright×(% total perfusion to right lung)
Analysis
All results are presented as mean±SD, unless otherwise stated. The primary outcome measure was the difference in PRI between healthy controls and patients with pre-capillary PHT. A pre-specified subgroup analysis based on PHT subtype (PAH or CTEPH) was also performed. Comparisons between groups were performed using one-way analysis of variance (ANOVA) and, if significant, subgroups were compared using independent t test analysis. Mann-Whitney U test was used if data deviated from normality. The association between PRI and clinical variables (6MWD, PAP, and TAPSE) were obtained from Spearman's correlations. Receiver operating characteristic (ROC) curve was used to assess the ability of PRI to discriminate between controls and cases. A multiple linear regression model was used to examine the association between PHT and PRI, with adjustment for other covariates. Statistical significance was inferred at a two-sided p value <0.05, and analyses were performed on SPSS V.15.0 (SPSS Inc, Chicago, USA).
Results
The clinical characteristics of study subjects are summarised in table 1. The control subjects’ baseline demographics were not significantly different to those with pre-capillary PHT. Subjects with pre-capillary PHT displayed a range of disease severity from mild to severe disease as indicated by their range of functional class, 6MWD, and haemodynamic derangement.
Baseline demographics and physiological data of study subjects
Patterns of regional lung perfusion
For control subjects in the upright posture, perfusion plots generally revealed increasing perfusion towards the lung bases, although variations in upper-to-lower zone perfusion gradient were seen between subjects. The mean upright perfusion gradient was 0.29±0.21 normalised perfusion/cm for the left lung, and 0.23±0.22 normalised perfusion/cm for the right lung (p=0.001 and 0.003 vs zero gradient, respectively). In the supine position, perfusion was shifted towards the apices resulting in mean upper-to-lower zone gradients of −0.02±0.13 normalised perfusion/cm for the left lung, and −0.01±0.13 normalised perfusion/cm for the right lung, both of which were not significantly different to zero gradient (p=0.58 and 0.78 vs zero gradient, respectively).
In the pre-capillary PHT group, visual inspection of the perfusion profiles revealed distinct differences between PAH and CTEPH subjects. As a result of large vessel obstruction in different geographical regions in CTEPH, the cranial–caudal perfusion profiles were inhomogeneous and differed between the left and the right lungs. PAH subjects, on the other, demonstrated a more homogeneous perfusion profile (figure 2).
Gravity dependent perfusion redistribution
Patients with pre-capillary PHT displayed a notably attenuated PRI compared to controls (0.02±0.06 vs 0.28±0.15 normalised perfusion/cm, p<0.0001). When stratified according to PHT subtypes, the PRI of PAH and CTEPH groups both remained significantly lower than controls (0.03±0.07 and 0.01±0.05 normalised perfusion/cm, respectively, p<0.05 for both compared to controls) (figure 3A). Following adjustment for age, sex, body mass index, and lung volume, the presence of pre-capillary PHT remained an independent predictor of PRI (table 2).
The effects of covariates on perfusion redistribution index (PRI) in multivariate linear regression model (n=26)
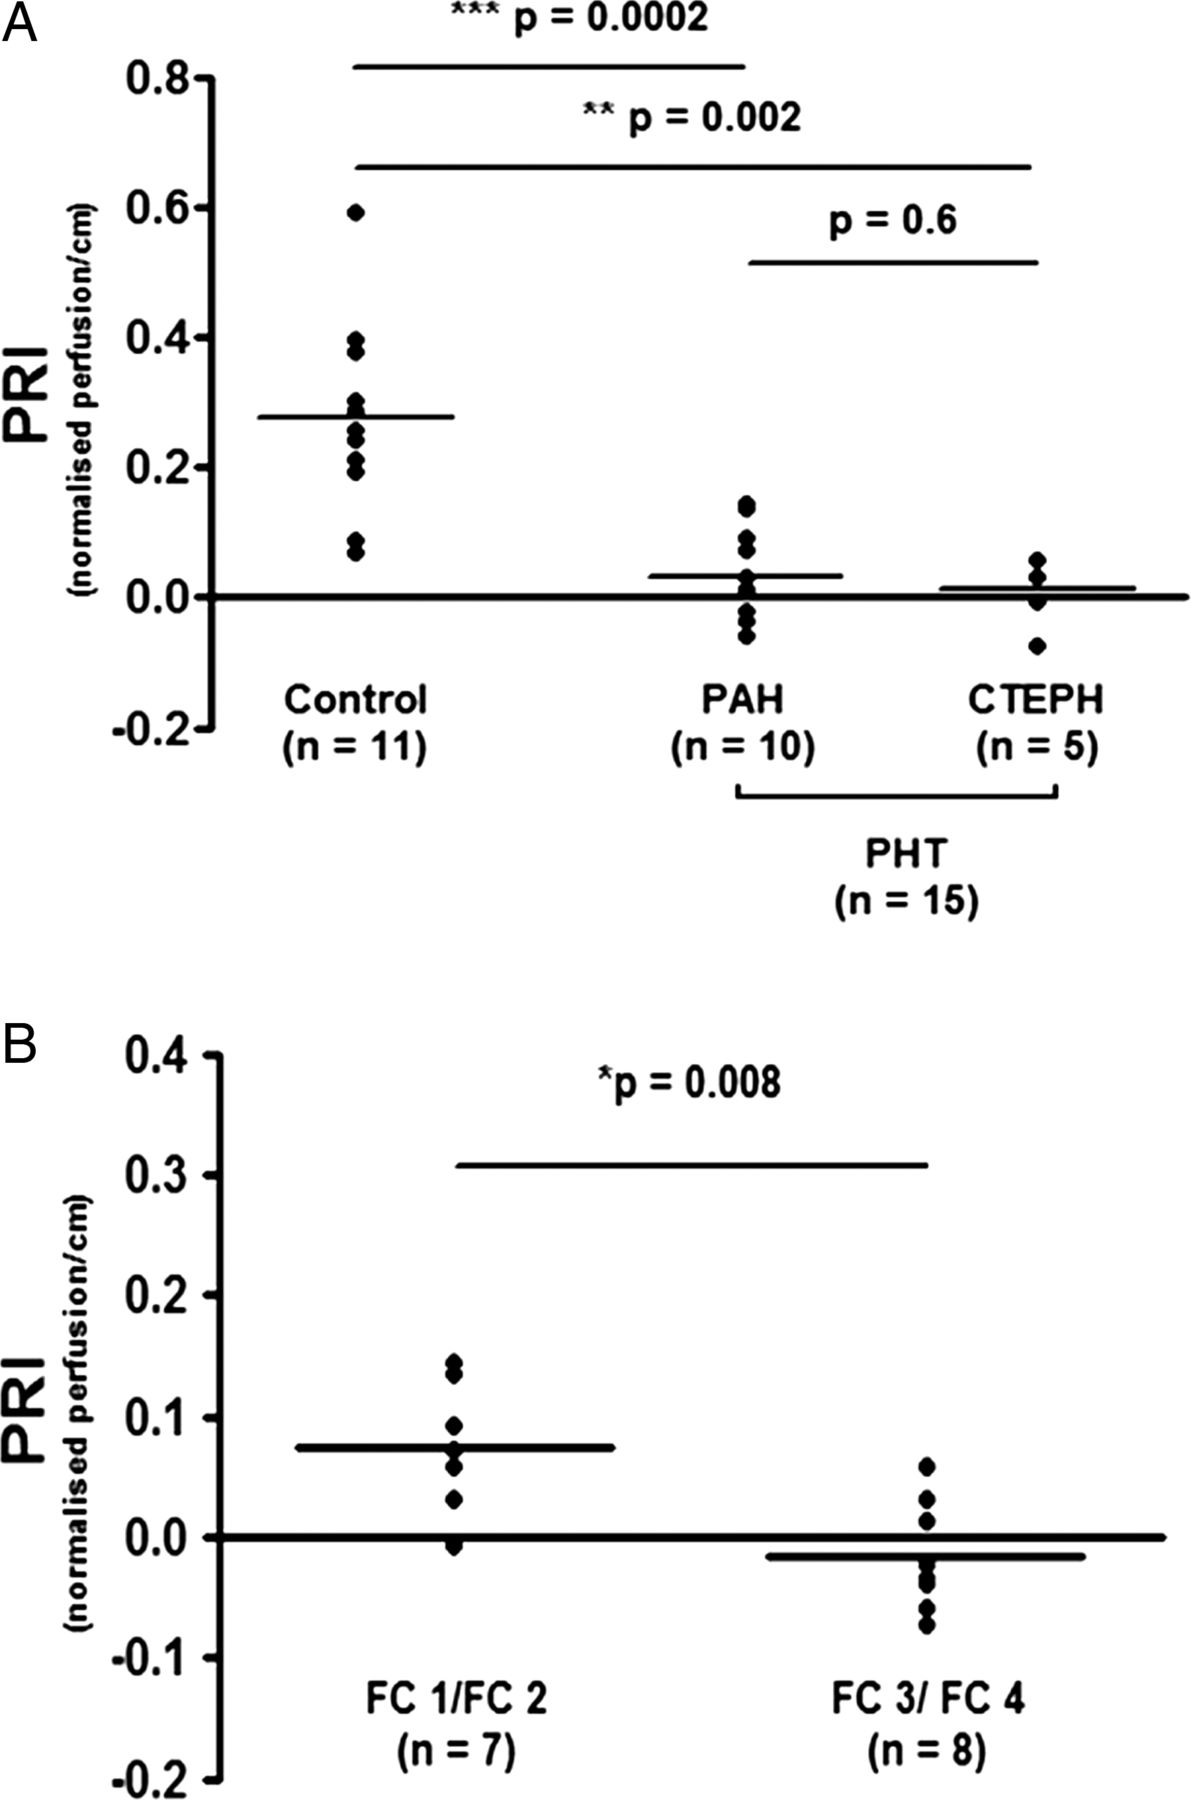
(Upper panel) Perfusion redistribution index (PRI) in controls and pre-capillary pulmonary hypertension subjects. Individual data points and the groups’ mean for PRI are shown. PRI in controls was 0.28±0.15 normalised perfusion/cm, compared to 0.03±0.07 normalised perfusion/cm in the pulmonary arterial hypertension (PAH) group (p=0.0002 vs controls) and 0.01±0.05 normalised perfusion/cm in the chronic thromboembolic pulmonary hypertension (CTEPH) group (p=0.002 vs controls). PRI in PAH and CTEPH groups were not significantly different (p=0.6). (Lower panel) PRI according to WHO functional class (FC) status. Pre-capillary pulmonary hypertension patients in better FC status (WHO 1 or 2) had higher PRI compared to those in lower FC (WHO 3) (0.08±0.05 vs −0.01±0.05 normalised perfusion/cm, p=0.008).
Correlation between PRI and markers of disease severity in PHT
Among the PHT subjects, PRI correlated positively with 6MWD (r=0.60, p=0.018) and TAPSE (r=0.58, p=0.022). PRI did not correlate with echocardiography determined systolic PAP (r=−0.40, p=0.14). PRI was higher in WHO functional class 1 or 2 patients compared to functional class 3 (0.08±0.05 vs −0.01±0.05 normalised perfusion/cm, p=0.008) (figure 3B).
ROC of PRI compared to upright perfusion gradient analysis
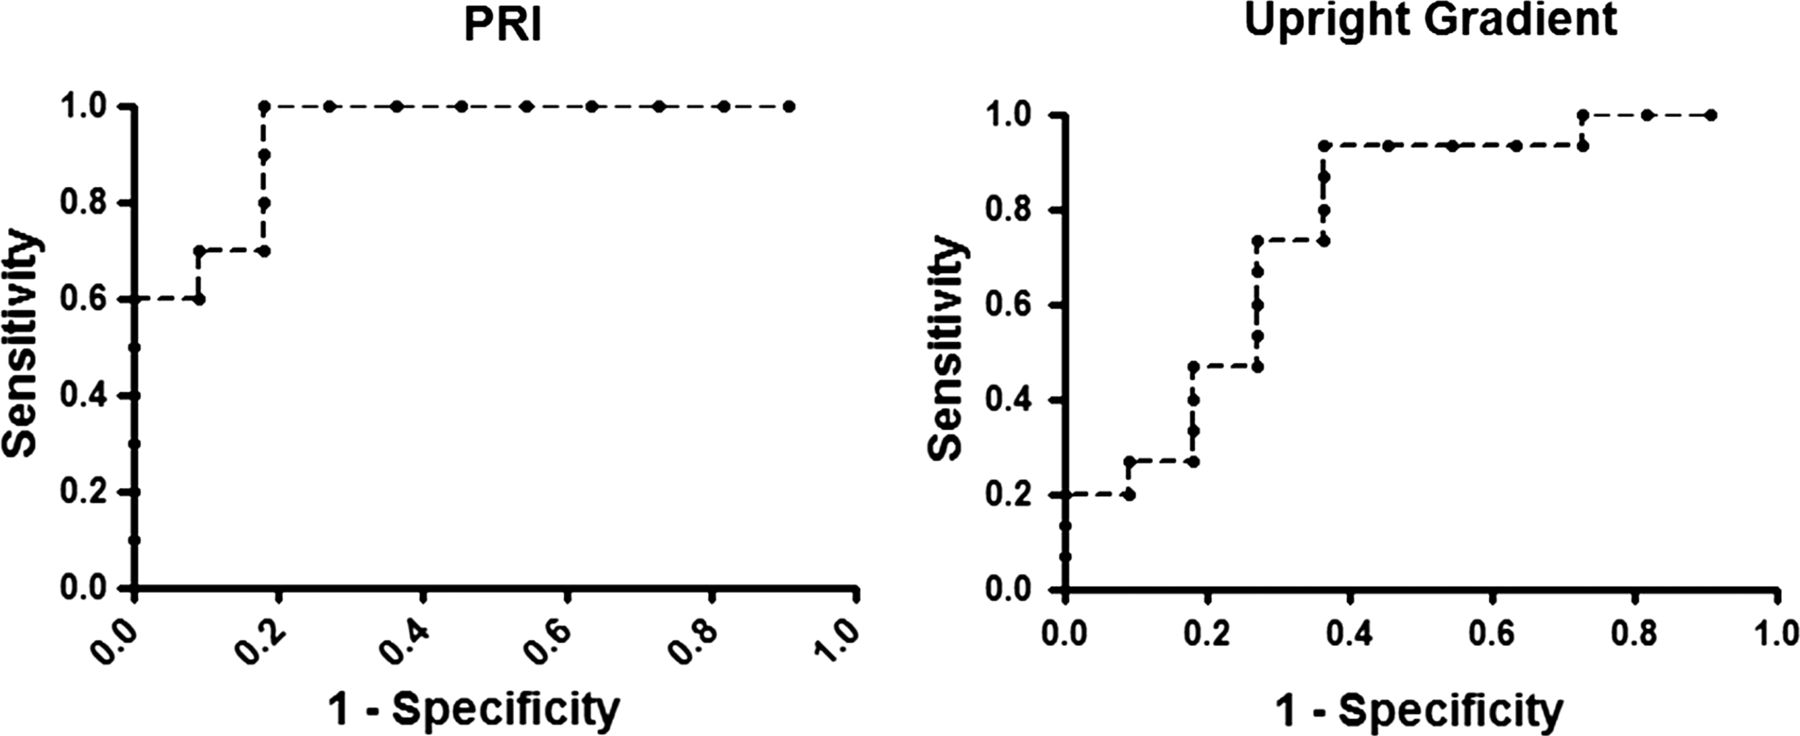
ROC curve analysis indicated excellent ability of PRI to discriminate between pre-capillary PHT and control groups (AUC=0.94, p<0.001). When the groups were compared by analysis of their upper-to-lower zone perfusion gradients in the upright position only, discrimination was reduced (AUC=0.76, p=0.02) (figure 4).
Receiver operating characteristic (ROC) curve comparing perfusion redistribution index (PRI) versus upright perfusion gradient for the presence of pre-capillary pulmonary hypertension. Using the PRI, the ROC curve showed excellent discrimination between control and pre-capillary pulmonary hypertension (PHT) groups (AUC=0.94, p<0.001). However, if the upper-to-lower zone perfusion gradient (obtained from upright measurements only) was used, discrimination between subjects with and without pre-capillary PHT was diminished (AUC=0.76, p=0.02).
Discussion
In the present study, we report a SPECT/CT technique for the assessment of the gravity dependent redistribution of pulmonary perfusion as a marker of pulmonary vascular disease. We demonstrate that subjects with pre-capillary PHT display a pronounced attenuation in the normal gravity dependent redistribution of lung perfusion.
The influence of gravity on regional lung perfusion was first described by West et al14 over 50 years ago and has subsequently been confirmed by other investigators.6 ,15–18 In this gravity dependent model, pulmonary perfusion is determined by the interplay of pulmonary arterial, pulmonary venous, and alveolar pressures. Although the relative contribution of gravity and arterial geometry in determining pulmonary perfusion distribution is still subject to debate,19–21 there is consensus that gravity plays an important governing role in pulmonary vascular flow distribution in healthy subjects.
When perfusion redistribution was quantified using the PRI, subjects with pre-capillary PHT have a strikingly reduced PRI compared to controls, indicating near absence of gravity dependent perfusion redistribution. Furthermore, this technique was sensitive at detecting the loss of perfusion redistribution regardless of large vessel or small vessel disease, when PAH and CTEPH groups were compared separately.
Gravity dependent perfusion redistribution is reliant on low resting arterial pressure (normal mean PAP is ∼15 mm Hg) and the ability to distend and/or recruit previously under-perfused vessels. However, as PAP increases, the influence of gravity on regional lung perfusion becomes proportionally less important.14 Importantly, the loss of vascular reserves resulting from obstructive vasculopathy diminishes the ability for vessel recruitment and hence flow redistribution. Thus, the likely underlying pathophysiological mechanism leading to loss of perfusion redistribution in pre-capillary PHT subjects is the loss of recruitable vascular reserves.
Previous nuclear studies using traditional planar techniques have provided conflicting evidence on the utility of analysing regional lung perfusion for the detection of PHT.22–28 In general, these studies mostly enrolled subject with post-capillary PHT due to left heart disease and evaluated perfusion in the upright position only. A study using planar imaging and 131I-MAA specifically examined the PAH population and found that the upper-to-lower zone perfusion ratio of the upright right lung in PAH was increased compared to controls (the left lung could not be assessed due to interference of cardiac chambers with the technique used in this study).28 However, the observations from our study suggest that relying on upright perfusion analysis can be potentially misleading. We found that there was significant overlap between controls and cases if the upper-to-lower zone perfusion gradient derived from upright measurement was solely considered. This was due to the relatively large dispersion in upright perfusion gradients in both controls and cases. However, our results indicate that the use of PRI significantly improved the discrimination between controls and those with pre-capillary PHT, as indicated by the ROC curves. This suggests that the assessment of posture related perfusion redistribution (by comparing upright and supine perfusion measurements) is superior to analysis of regional perfusion from upright measurement for the detection of pulmonary vascular disease. The use of SPECT/CT imaging also enables improved accuracy in the quantification of regional lung perfusion compared to planar technique. In our study, regional perfusion counts were adjusted for lung volumes based on co-registered anatomical CT images, which is not possible with planar techniques.
We found PRI to correlate significantly with TAPSE (a marker of right ventricular contractility), 6MWD, and WHO functional class status. As these parameters are known to be markers for disease severity and prognosis,9 it suggests the PRI potentially conveys relevant information regarding the functional state of the pulmonary circulation. Interestingly, PRI was not significantly associated with systolic PAP on echocardiography. The lack of association with systolic PAP may be explained by the possible inaccuracies of echocardiography in the assessment of PAP,29 and the fact that PAP has not been shown to be an important prognostic marker in pre-capillary PHT in previous studies.9 We did not attempt to analyse the relationships between PRI and invasive haemodynamic parameters, as SPECT/CT imaging was performed at varying time periods following the initial diagnostic RHC.
Recent interest has focused on using MRI and electron beam CT in the physiological imaging of lung perfusion, given the higher spatial resolution of these techniques in comparison to SPECT. Both MRI and electron beam CT studies have demonstrated a loss of ventral-to-dorsal perfusion gradient in PHT subjects lying supine.30 ,31 However, the major advantage of SPECT is that pulmonary physiology can be studied in any body positions by radiotracer administration in the corresponding position of interest. In contrast, MRI and CT techniques only allow perfusion imaging in horizontal body positions. Thus, studying the redistribution of lung perfusion between supine and upright positions is only possible using radionucleotide techniques.
Our study must be interpreted in the context of the following limitations. This was a proof-of-principle study designed to determine whether pre-capillary PHT (due to PAH or CTEPH) leads to a loss of gravity dependent perfusion redistribution, using a quantitative SPECT/CT technique. Our study was relatively small and we compared healthy controls to subjects with established disease. We did enrich our study population with milder disease, with seven out of 15 patients being in either functional class 1 or 2 status. However, the utility of this technique for the detection of pre-capillary PHT (particularly early disease) is unproven and requires prospective validation from an independent cohort of subjects presenting with breathlessness or suspected pulmonary vascular disease. The performance of this SPECT/CT technique requires comparison with conventional modalities such as Doppler echocardiogram, which currently remains the standard non-invasive tool for the detection of PHT.
Our present study did not enrol patients with post-capillary (or passive) PHT due to left heart disease. Therefore, we cannot determine whether PRI is diminished in those with pulmonary venous hypertension but without pulmonary arterial vasculopathy specifically. However, in the setting of elevated pulmonary venous pressure, there is recruitment of the pulmonary microcirculation such that the effect of gravity on regional perfusion is reduced, with the lung being mostly under zone 3 conditions32—implying that PRI may also be attenuated in the setting of post-capillary PHT. It would also be of interest to study perfusion redistribution in patients with intrinsic lung disease with and without established PHT. Finally, all of our subjects with pre-capillary PHT were on specific vasodilator therapy. However, it is unlikely that pulmonary vasodilators would have accounted for the loss of gravity dependent perfusion redistribution seen in the disease group.
In conclusion, subjects with pre-capillary PHT display pronounced impairment of gravity dependent redistribution of pulmonary perfusion and this pathophysiological change can be measured objectively by a novel SPECT/CT derived index. Quantifying the degree of perfusion redistribution may allow insights into the functional vascular reserves of the pulmonary circulation. The utility of PRI for the non-invasive detection of early pre-capillary PHT and assessment of disease severity warrants further study.
Key messages
-
What is already known on this subject
-
The normal pulmonary circulation has a large reserve of recruitable vessels. Pre-capillary pulmonary hypertension is characterised by progressive pulmonary vascular obliteration and loss of vascular reserves.
-
What this study adds
-
A perfusion redistribution index (PRI), derived from nuclear SPECT/CT imaging, was used to quantify the gravity dependent shifts in regional lung perfusion as a marker of pulmonary vascular reserves. PRI was notably attenuated in pre-capillary pulmonary hypertension and was associated with markers of disease severity.
-
How might this impact on clinical practice
-
PRI may provide insights into the functional reserves of the pulmonary circulation. The potential utility of PRI for detection of pulmonary hypertension warrants further study.
References
Footnotes
-
Contributors EMTL contributed to study design, recruitment, data collection, data analysis, interpretation of results, and drafting, review and final approval of the manuscript. He is also responsible for the accuracy of data and integrity of the study. DLB contributed to study design, data analysis, interpretation of results, and drafting, review and approval of the manuscript. EAB contributed to recruitment, data collection, review and approval of the manuscript. PJT contributed to recruitment, interpretation of results, review and approval of the manuscript. PJR and GPS contributed to study design, review and approval of the manuscript. TJC contributed to study design, interpretation of results, and drafting, review and approval of the manuscript. DSC contributed to study design, data analysis, interpretation of results, and drafting, review and approval of the manuscript.
-
Funding National Health and Medical Research Council (NHMRC) Project Grant 512404;NHMRC/Heart Foundation Postgraduate Scholarship 633136.
-
Competing interests None.
-
Patient consent Obtained.
-
Ethics approval Ethics Review Committee (RPA Zone).
-
Provenance and peer review Not commissioned; externally peer reviewed.