Article Text

Abstract
Objectives We aimed to investigate the effects of meteorological factors and air pollutants on out-of-hospital cardiac arrest (OHCA) according to seasonal variations because the roles of these factors remain controversial to date.
Methods A total of 38 928 OHCAs of cardiac origin that occurred within eight metropolitan areas between 2012 and 2016 were identified from the Korean nationwide emergency medical service database. A time series multilevel approach based on Poisson analysis following a Granger causality test was used to analyse the influence of air pollution and 13 meteorological variables on OHCA occurrence.
Results Particulate matter (PM) ≤2.5 µm (PM2.5), average temperature, daily temperature range and humidity were significantly associated with a higher daily OHCA risk (PM2.5: 1.59%; 95% CI: 1.51% to 1.66% per 10µg/m3, average temperature 0.73%, 95% CI: 0.63% to 0.84% per 1°C, daily temperature range: 1.05%, 95% CI: 0.63% to 1.48% per 1°C, humidity −0.48, 95% CI: −0.40 to −0.56 per 1%) on lag day 1. In terms of the impact of these four risk factors in different seasons, average temperature and daily temperature range were highly associated with OHCA in the summer and winter, respectively. However, only PM2.5 elevation (to varying extents) was an independent and consistent OHCA risk factor irrespective of the season.
Conclusions PM2.5, average temperature, daily temperature range and humidity were independently associated with OHCA occurrence in a season-dependent manner. Importantly, PM2.5 was the only independent risk factor for OHCA occurrence irrespective of seasonal changes.
- cardiac arrest
- epidemiology
Statistics from Altmetric.com
Introduction
Out-of-hospital cardiac arrest (OHCA), which is the cessation of cardiac mechanical activity in a person outside of a hospital setting, is a serious event with a low survival rate (7.6%).1 2 The global incidence of OHCA ranges from 52.5 to 112.9 per 100 000 person-years, and varies widely among locales.1
Meteorological factors such as extremely high or low ambient temperature, and humidity were associated with OHCA.3–5 Recent studies on air pollution as measured by particulate matter (PM) ≤2.5 µm (PM2.5) and PM ≤10 µm (PM10), revealed that a high PM level was a main risk factor for OHCA6 7; however, other studies found no such associations.8 9 Notably, whether PM influenced OHCA appears to depend on the geographic area, even within a single country. For example, PM2.5 exposure was associated with an increased OHCA risk in the American cities of New York and Houston but not in Seattle or western Washington State.2 9–11 As such, data from studies on the association between air pollution and OHCA occurrence remain equivocal, perhaps because previous studies were performed in single cities, had small sample sizes and/or investigated only a limited number of meteorological factors without considering their complex associations with each other.
Thus, the aim of our study was to identify meteorological factors and air pollutants (MFAP) that affect OHCA occurrence after adjusting for all relevant meteorological variables. Furthermore, we sought to explore variations in such risk factors among seasons.
Materials and methods
Study population and out-of-hospital records
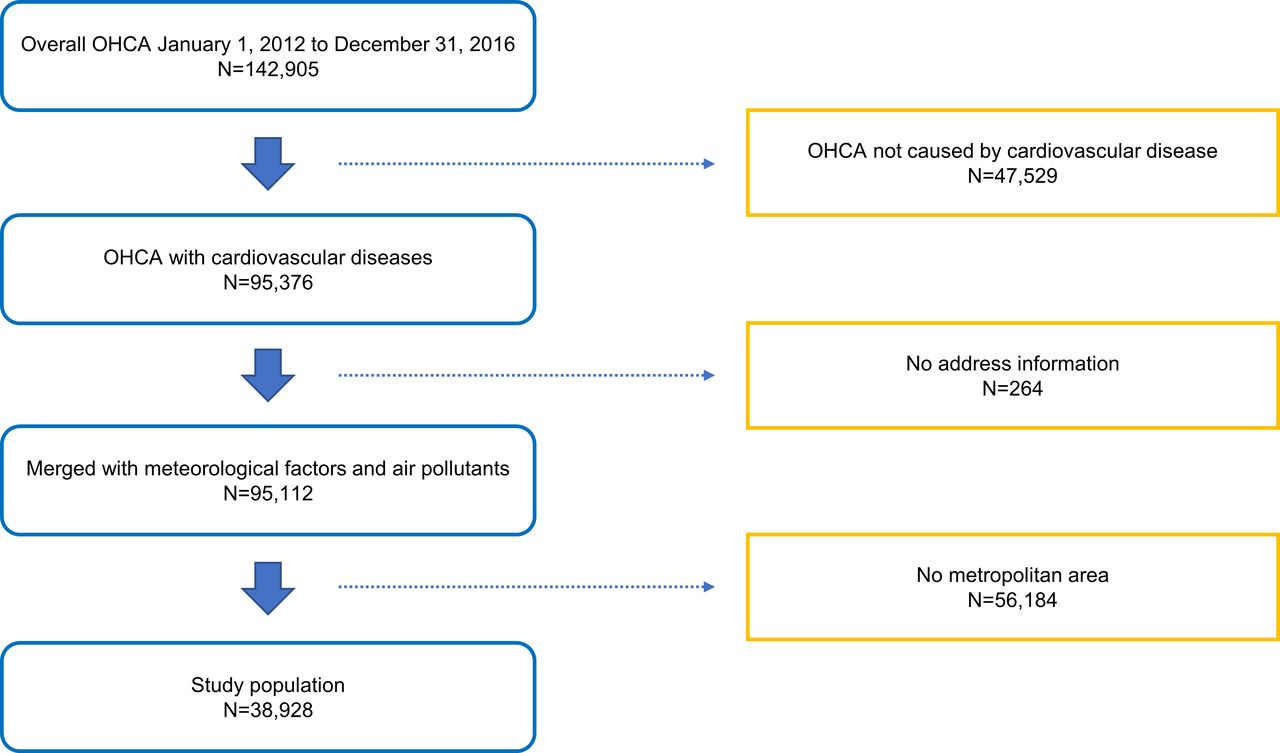
This study investigated daily OHCA occurrences in eight metropolitan areas with dense manner which distance between weather stations and population is close, to clearly analyse the association between OHCA and MFAP, including Seoul, Inchon, Daejeon, Gwangju, Daegu, Ulsan, Busan and Jeju, between January 2012 and December 2016. Data were obtained from the Korea Centres for Disease Control and Prevention (KCDC) (online supplementary figure 1). A total of 38 928 cases ultimately met the inclusion criteria (figure 1). The OHCA database is constructed from emergency medical service data collected from ambulance run sheets and hospital medical records including Utstein templates. All ambulance run sheet data are recorded in the OHCA database once patients are transported to the emergency department; these data are then stored by the National Emergency Management.
Supplemental material

Flow chart of out-of-hospital cardiac arrest (OHCA) case selection.
Meteorological factors and air pollutants
We obtained information on all 13 available meteorological factors from the Korea Meteorological Administration.12 All meteorological factors were measured hourly by automated equipment at 77 manned stations installed on high mountains or in central cities; each station covers approximately 67 km2. The mean daily values for these meteorological factors were calculated based on timed measurements obtained throughout the day. Additionally, data of air pollutants such as PM10 (µg/m3), PM2.5 (µg/m3), NO2 (parts-per-billion (ppb)), SO2 (ppb), CO (parts-per-million) and O3 (ppb) were obtained from AirKorea.13 SO2 was measured accurately using ultraviolet pulse fluorescence, CO using the non-dispersive infrared method, NO2 using chemiluminescence and O3 using ultraviolet photometry. These values were calculated as the 8 hour maximum per time period. Both the PM2.5 and PM10 were determined using the beta-ray absorption method.
Statistical analysis
We modelled the number of daily OHCA occurrences relative to the MFAP in the eight metropolitan areas during the same study period. Our study consisted of four analysis phases: 1) in the first step, we identified single exposure variables among the MFAP using a Poisson regression model and generalised additive model (GAM) owing to the non-linearity of meteorological factors; 2) next, we used the Granger causality (GC) test to build a multiple MFAP model. In the GC test, the Wald test is performed and the df of the model are presented. In this process, models can be compared using the Akaike Information Criterion (AIC)14 15; 3) third, multivariable GAM was performed on the MFAPs determined in the previous step. Multivariable GAM is expected to effectively control the interaction between MFAPs; 4) we analysed the impulse response function for the logged number of daily OHCAs and identified meteorological factors to estimate the lag effects. The impulse response describes the reaction of shock as a function of time in the dynamic system.16
Generalised additive model
GAM commonly used smoothers, such as natural splines, smoothing splines, kernel smoothers and locally estimated polynomial regression functions for controlling non-parametric measures and to allow for greater flexibility. In our test, we selected natural splines of GAM with the Poisson distribution for non-linear relationships between daily OHCA cases and MFAPs.
In time-series analyses, weather variables generally showed systematic variation in time as seasonality so that it is necessary to remove these patterns, and it may also occur time lags. Daily OHCA cases have a serial correlation with MFAPs and were observed to have partial autocorrelation with the residuals of the model. Thus, we inserted the sum of the autocorrelations on the GAM model in order to take the serial correlation into account after checking the time lags. The sum of the autocorrelation should be close to zero and its residuals will be a white noise. Our model structure was as follows: Log(E[Y])=
 +
+  (average temperature, df=3)+
 (daily temperature range, df=1)+
 (PM2.5, df=11)+δ(day of the week)+δ(year)+
 , where E[Y] was the expected number of daily OHCA cases; α
0 was the intercept; S
n were the smooth functions of selected meteorological factors using natural cubic splines to control for confounding factors; δ was the indicator variable for the day of the week and year and AR
1,…, AR
j were autocorrelation terms.
, where E[Y] was the expected number of daily OHCA cases; α
0 was the intercept; S
n were the smooth functions of selected meteorological factors using natural cubic splines to control for confounding factors; δ was the indicator variable for the day of the week and year and AR
1,…, AR
j were autocorrelation terms.
Since the GAM model using a spliner can change the direction of the slope of the curve, it is difficult to use a simplified representation of the relative risks (RR) that are commonly used in clinical studies. If there is an exposure that has a U-shape effect, it is impossible to represent it as a linear RR concept. However, this study measured the change in average risk per unit change in MFAP for better understanding. Relative risk and 95% CIs were calculated by using a Poisson regression coefficient (β) with the following equation:
RR=exp[β], excess risk=(exp[β]–1) × 100 and 95% CI=(exp[β]–1 ± 1.96 × SE).
GC test
The GC test shows how well different time series predict each other. The presence of GC means that one time series can predict another. We used the GC test to show the complex inter-relationships between MFAP (figure 2) and OHCA and to build prediction models using multiple MFAPs. However, we did not require prediction accuracy for meteorological factors and considered only causality and AIC values; the final model comprised the lowest AIC values.

Granger causality graph of the number of out-of-hospital cardiac arrests (OHCAs) and related meteorological factors in Korea. The figure shows the direct (two-way) causality between OHCA and meteorological factors. The blue and red lines show positive and negative relationships, respectively; the purple colour represents the selected meteorological factors on OHCA.
Impulse response function
After determining causality among the meteorological factors via the GC test, we assessed how each selected meteorological factor affected the number of OHCAs in a time-dependent manner. In general, the weather does not induce diseases immediately; therefore, identifying the lag effects of selected meteorological factors on the number of OHCAs is essential. The impulse response function shows the response of one variable to an impulse from another variable in a multivariable system. A response of one variable that is higher than zero indicates that impulse reactions are present, whereas a response closer to zero indicates there is no longer a reaction.
Statistical analyses were performed using SAS V.9.4 for Windows (SAS Institute, Cary, North Carolina, USA). A p value <0.05 was considered to be statistically significant.
Results
Baseline cohort characteristics
Male patients accounted for 62.9% of our subjects, over half of whom were 70 years of age or older; the median age was 72 years (table 1). Most OHCAs occurred in private homes and not public places. Moreover, 19.4% of patients required defibrillation in the emergency room; 80% eventually died.
Summary statistics for study population of out-of-hospital patients who experienced cardiac arrest in Korea, 2012–2016
Meteorological factors and air pollutants
Table 2 summarises the number of daily OHCA cases and related MFAP during the study period. The daily mean number of OHCA occurrences was 6.1; the average temperature was 12.8°C, the mean daily temperature range was 8.4°C and the mean daily PM2.5 was 15.6 µg/m3.
Summary statistics for the number of out-of-hospital cardiac arrests as well as meteorological and air pollutant data in Korea, 2012–2016.
Meteorological factors generally correlate strongly with each other; however, we inquired about which of these factors were most causative of OHCA. First, we investigated all causalities between meteorological factors and OHCA and found that most meteorological variables had two-way direct causalities, indicating that the relationships between meteorological variables and OHCA represent direct feedback (figure 2). Second, we selected crucial factors among all meteorological variables through the lowest AIC value (which indicates a better predictive fit or estimation of future values). According to the GAM, AIC functions also indicate the likelihood of OHCA based on treating spline coefficients; while the df is the number of smoothing parameters with the number of fixed effects. From two stages, we finally selected four meteorological factors to investigate their relationship with OHCA: average temperature, daily temperature range, humidity and PM2.5 (figure 2, purple boxes).
Online supplementary table 1 presents the GC test results for the selected meteorological factors versus OHCA. The four included variables had significantly higher χ2 values. Online supplementary table 2 shows that there was no overdispersion problems in the GAM model, but there was a positive autocorrelation. However, the sum of autocorrelation was close to zero, so it did not affect the results.
Figure 3 shows the result of GAM model analysis with cubic splines to determine the influence of selected meteorological factors on the number of daily OHCAs. The average temperature had a U-shaped relationship; below 0°C, the number of OHCA cases rapidly increased as they did above 22°C, whereas the number of OHCA incidents did not change at average temperatures between 0°C and 21°C. Humidity had a positive relative risk at 45%–70%, as did the daily temperature range at 7.5°C–12°C. Moreover, PM2.5 showed a positive relative risk between 2 and 30 µg/m3.

Generalised additive model with cubic splines for the effects of selected meteorological factors on the number of out-of-hospital cardiac arrests (OHCA). The bold line estimates the relative effect sizes for OHCA, and the blue area estimates 95% CIs. The X-axis represents selected meteorological factors. The Y-axis shows the relative effect sizes for OHCA. PM2.5, particulate matter ≤2.5 µm.
We assessed the lag effects of the selected meteorological factors with respect to the number of OHCA events using orthogonalised impulse response functions. Because we found 3-day lag effects of meteorological factors on the number of OHCAs, both univariate and multivariable GAM Poisson regression analyses allowed for more than >3-day lag effects (online supplementary figure 2).
Risk factors for annual OHCA occurrences
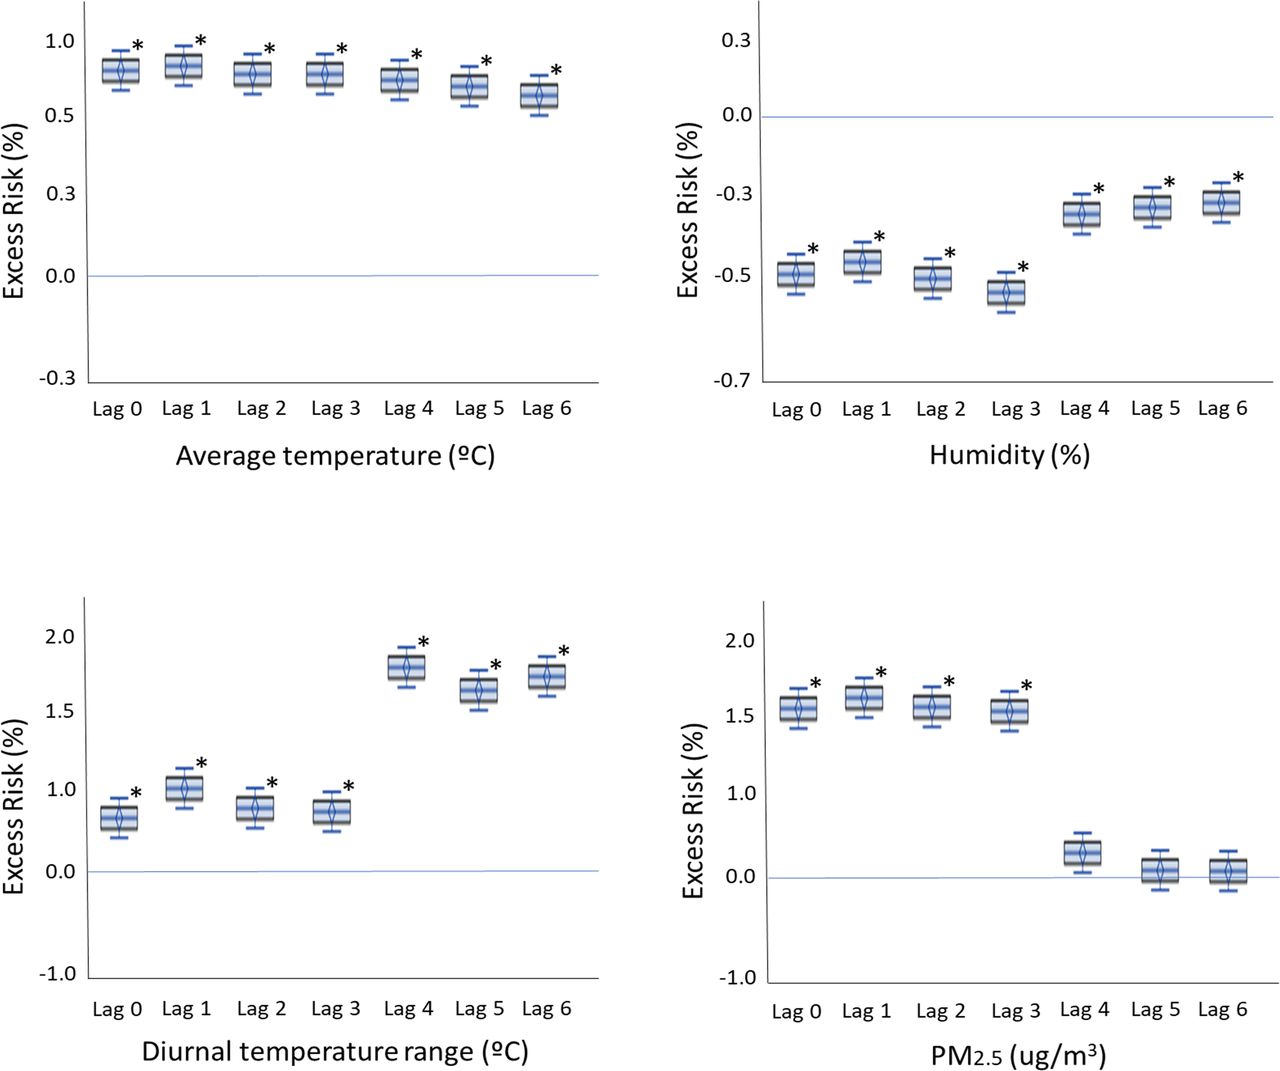
Table 3 shows both the univariate and multivariable analysis results for the annual OHCA events using the GAM model. On multivariable analysis, an elevation in the PM2.5 by 10 µg/m3 significantly increased the risk of OHCA by 1.59% (95% CI: 1.51% to 1.66%) on lag day 1. Furthermore, a rise in the average temperature and daily temperature range by 1°C were both associated with an increased risk of annual OHCA events by 0.73% (95% CI: 0.62 to 0.83) and 1.05% (95% CI: 0.63 to 1.48) on lag day 1. In contrast, a 1% increase in humidity was associated with a −0.57% (95% CI: −0.49 to −0.65) maximum decrease on lag day 3. Overall, average temperature, daily temperature range and PM2.5 were positively associated with OHCA, whereas humidity was negatively associated with the same, on all lag days. Figure 4 shows box plot models of the estimated risk of OHCA with respect to the four meteorological variables with 3-day lags; all differences were significant.
The results of univariate and multivariable analyses for OHCA as a function of time using the generalised additive model with cubic splines, 2012–2016

Level of selected meteorological factors and the adjusted excess risk of out-of-hospital cardiac arrest: (A) average temperature, (b) humidity, (c) daily temperature range and (d) particulate matter ≤2.5 µm (PM2.5). The Y-axis shows the percentage of adjusted excess risk with 95% CIs; *p<0.05.
Seasonal variation and OHCA occurrence
The impact of each risk factor on the occurrence of OHCA varied per season (table 4). In the summer, a daily temperature range increase was highly associated with OHCA; a large daily temperature range was the strongest risk factor (excess risk 6.48%, 95% CI 1.052% to 1.077%) on lag day 3. The average temperature was not a significant factor. As the daily temperature range increased, so did the risk of OHCA occurrence in the summer. In contrast, the average temperature in the winter season was a strong risk factor for OHCA, while humidity and daily temperature range were not. A low average temperature was strongly related with a high risk of OHCA occurrence on lag day 2 (excess risk 3.93%, 95% CI 1.035 to 1.043). As the average temperature decreased, the risk of OHCA occurrence increased during the winter. In the spring and autumn seasons, humidity and PM2.5 were significant risk factors for OHCA. Unlike the other three factors, PM2.5 elevation was the only independent risk factor for OHCA occurrence continuously throughout the year (ie, regardless of seasonal variation).
The results of seasonal multivariable analyses for OHCA using the generalised additive model with cubic splines, 2012–2016
Discussion
The major findings of our study using data from the National Institute of Health Sciences were as follows: (i) meteorological factors affected OHCA development in a variety of ways; (ii) the risk factors for developing OHCA were average temperature, daily temperature range, humidity and PM2.5; (iii) the impact of each risk factor varied according to season and (iv) regardless of seasonal differences, PM2.5 remained an independent risk factor for OHCA.
The interconnectivity of meteorological factors complicates investigating their roles in OHCA occurrence, especially as lag effects should also be considered. Moreover, socioeconomic, cultural and environmental differences for each region need to be considered. Despite these obstacles, our findings ought to provide an important basis for future research on the association between meteorological factors and human health.
The relationship between ambient temperature and OHCA is known to be U-shaped or V-shaped, as our own results have shown (figure 3).17 18 Extreme cold and heat exposure are significantly associated with OHCA, and daily temperature fluctuations on a single day can increase the risk of myocardial infarction.17 18 Tobaldini et al reported a synergistic effect between PM and temperature in terms of triggering cardiac events.4 The novelty of our study is that we showed that the effects of meteorological factors on OHCA occurrence varied according to seasonal changes. In the summer, the daily temperature range was the strongest risk factor for OHCA occurrence (the larger the range, the higher the risk of OHCA occurrence). In contrast, the average temperature, which was not a significant factor for OHCA occurrence in the summer, was strongly so in the winter. Moreover, humidity (which has been not well-studied in terms of OHCA) was identified as an important factor in our study. Because Korea is a peninsula, the humidity changes seasonally and is therefore an important meteorological factor. Hensel et al reported that dry air (ie, a humidity level below 75%) was associated with an increased risk of OHCA occurrence in the German city of Hamburg.5 Furthermore, another study found that low humidity may play an important role in the pathogenesis of angina.19
PM is a complex mixture of many chemicals; smaller particles have deeper penetration into the lungs, with PM10 invading the trachea and PM2.5 lodging in airways and the alveoli.7 20 Previous studies found that PM may trigger acute cardiovascular events such as myocardial infarction and congestive heart failure via autonomic alteration, systemic inflammation or hypercoagulability.21–23 In particular, PM2.5 exposure was associated with triggering clinically consequential changes in cardiac electrophysiology, causing ventricular arrhythmia and atrial fibrillation.24–26
The risk of annual OHCA increased by 1.59% per 10 µg/m3 of PM2.5 on lag day 1, which was relatively higher than previously reported values (1.04%–1.30%).7 27–29 This may be owing to our large sample size and dedicated statistical analyses that adjusted for meteorological factors. This also suggests that the independent risk of PM2.5 for developing OHCA may be higher than previously reported. Above all, our data revealed the differences in risks according to seasonal variations. The effect of PM2.5 on OHCA risk also varied between spring/autumn (2.57%), summer (1.84%) and winter (1.55%); therefore, patients can be instructed to pay attention to high levels of PM2.5. Moreover, while the effects of average temperature and daily temperature range were lower or non-existent in some seasons, PM2.5 was the only independent risk factor maintained throughout all seasons. Based on this result, efforts to reduce or suppress PM2.5 should be emphasised by national healthcare systems.
This study had several strengths. It encompassed the capital city and seven other areas in Korea, which minimised the effect of region-specific variables such as race, culture, socioeconomics and climate. Second, as we analysed national-level data from the KCDC, our sample size of 38 928 was much larger than that of other studies. Third, we analysed the interactions between all 13 MFAP described by the Korean Meteorological Agency. This allowed for an accurate analysis of the real-world effects of PM2.5 relative to various meteorological factors. Fourth, our study was the first to investigate the influence of meteorological factors according to seasonal differences; most previous studies performed annual analyses and did not adjust for seasonal changes. Fifth, we used a time series multilevel approach based on Poisson analysis with GAM after GC testing, which is a high-end statistical method, to consider the interaction among meteorological factors in terms of OHCA development.
There were also some limitations in our study. First, this study was conducted in eight metropolitan cities. Therefore, the population of each city was exposed to the same environment, which means that our research has the inherent characteristics of an ecological study. Therefore, our research has the possibility of ecological fallacy. In particular, since the individual lifestyle and cardiovascular risk factors were not included, a confirmative study in consideration of this should be conducted. Furthermore, special weather forecasts such as activation of the fine dust warning system could have introduced bias if citizens refrained from venturing outdoors on days with high levels of fine dust. Additionally, the actual residential areas and weather stations were not perfectly matched and may have been two or three miles away. Lastly, some unusual climate factors like daily snow, cloudiness and dew point temperatures have wide CIs.
Conclusion
Average temperature, daily temperature range and humidity were found to be independently associated with annual OHCA occurrence, although with seasonal variations. Furthermore, PM2.5 was the only independent risk factor to affect OHCA occurrence continuously throughout the year.
Key questions
What is already known on this subject?
Various meteorological factors and air pollutants (MFAP) are known to affect out-of-hospital cardiac arrest (OHCA).
However, the complex relationship between MFAP and OHCA is unclear, especially in terms of seasonal variation.
What might this study add?
MFAP affects OHCA in a variety of ways.
Particulate matter ≤2.5 µm (PM2.5), average temperature, daily temperature range and humidity were significantly associated with OHCA occurrence, with variations among seasons.
PM2.5 was the only independent risk factor for OHCA occurrence across all seasons.
How might this impact on clinical practice?
Our data emphasise the importance of following weather forecasts to obtain information about meteorological factors that may influence OHCA during a given period, as well as that on PM2.5 year-round.
Our results also provide a basis for future research on the relationship between human healthcare and MFAP.
Footnotes
J-HK and JH contributed equally.
Contributors Design of the work: JJ, JI. Data acquisition: JI. Data analysis and interpretation: JH. Drafing the work: J-HK, JJ, JH. Final approval: all.
Funding This study was supported by grants from the Korea Health Technology R&D Project through the Korea Health Industry Development Institute (KHIDI), funded by the Ministry of Health and Welfare, Korea (Grant number: HI14C1135); and the Gachon University Gil Medical Center (Grant number: 2018-17).
Competing interests None declared.
Patient and public involvement Patients and/or the public were not involved in the design, conduct, reporting or dissemination plans of this research.
Patient consent for publication Not required.
Ethics approval The study was approved by the Institutional Review Board of the Gachon University Gil Medical Center, which provided a waiver of consent (IRB No. GFIRB2019-313).
Provenance and peer review Not commissioned; externally peer reviewed.
Data availability statement Data are available on reasonable request.