Article Text

Abstract
Cardiopulmonary exercise testing (CPET) has become an important clinical tool to evaluate exercise capacity and predict outcome in patients with heart failure and other cardiac conditions. It provides assessment of the integrative exercise responses involving the pulmonary, cardiovascular and skeletal muscle systems, which are not adequately reflected through the measurement of individual organ system function. CPET is being used increasingly in a wide spectrum of clinical applications for evaluation of undiagnosed exercise intolerance and for objective determination of functional capacity and impairment. This review focuses on the exercise physiology and physiological basis for functional exercise testing and discusses the methodology, indications, contraindications and interpretation of CPET in normal people and in patients with heart failure.
- exercise test
- heart failure
- cardiopulmonary exercise testing
- exercise physiology
- anaerobic threshold
Statistics from Altmetric.com
Cardiopulmonary exercise testing (CPET) provides assessment of the integrative exercise responses involving the pulmonary, cardiovascular, haematopoietic, neuropsychological, and skeletal muscle systems, which are not adequately reflected through the measurement of individual organ system function. This non-invasive, dynamic physiological overview permits the evaluation of both submaximal and peak exercise responses, providing the doctor with relevant information for clinical decision making. CPET is increasingly being used in a wide spectrum of clinical applications for the evaluation of undiagnosed exercise intolerance and for the objective determination of functional capacity and impairment. Its use in patient management is increasing with the understanding that resting pulmonary and cardiac function testing cannot reliably predict exercise performance and functional capacity and that overall health status correlates better with exercise tolerance than with resting measurements.1
CPET involves measurements of respiratory oxygen uptake (Vo2), carbon dioxide production (Vco2), and ventilatory measures during a symptom-limited exercise test.
PHYSIOLOGY OF EXERCISE
Peak exercise capacity is defined as “the maximum ability of the cardiovascular system to deliver oxygen to exercising skeletal muscle and of the exercising muscle to extract oxygen from the blood”.2 Consequently, exercise tolerance is determined by three factors: pulmonary gas exchange; cardiovascular performance, including the peripheral vascular tree; and skeletal muscle metabolism.
The Fick equation
Understanding the Fick equation is of paramount importance for appreciating the utility of functional exercise testing. At rest, the Fick equation states that oxygen uptake (Vo2) equals cardiac output times the arterial minus mixed venous oxygen content:
Vo2 = (SV × HR) × (Cao2 − Cvo2)
where SV is the stroke volume, HR is the heart rate, Cao2 is the arterial oxygen content, and Cvo2 is the mixed venous oxygen content. Oxygen uptake is often normalised for body weight and expressed in units of ml O2/kg/min. One metabolic equivalent (MET) is the resting oxygen uptake in a sitting position and equals 3.5 ml/kg/min.
At maximal exercise, the Fick equation is expressed as follows:
Vo2max = (SVmax × HRmax) × (Cao2max − Cvo2max)
This reflects the maximal ability of a person to take in, transport and use oxygen. It defines that person’s functional aerobic capacity. Vo2max has become the preferred laboratory measure of cardiorespiratory fitness and is the most important measurement during functional exercise testing. In healthy people, a Vo2 plateau occurs at near maximal exercise. This plateau in Vo2 has traditionally been used as the best evidence of Vo2max. It represents the maximal achievable level of oxidative metabolism involving large muscle groups. However, in clinical testing, a clear plateau may not be achieved before symptom limitation of exercise. Consequently, peak Vo2 (PVo2) is often used as an estimate of Vo2max.3
Exercise intolerance
Exercise intolerance (functional aerobic impairment) is defined as an abnormally low Vo2max. This can occur with any factor that affects one or more of the four variables of the Fick equation that determine Vo2max: a reduction in maximal heart rate, maximal stroke volume, or maximal Cao2; or an increase in rest Cvo2. As an example, one of the factors limiting Vo2max in patients with congestive heart failure (CHF) is the marked reduction in stroke volume response to exercise with smaller reductions in maximal heart rate and maximal arterial minus mixed venous oxygen content (Cao2max − Cvo2max).4–6 On the other hand, diseases of the lungs, skeletal muscles and haematological system often have a profound effect on Vo2max by affecting arterial or mixed venous oxygen content.
Exercise training in healthy people
Several important changes occur in the Fick equation as a healthy person goes from rest to maximal exercise before and after exercise training7:
The Vo2max response to exercise is linear until maximal Vo2 is achieved. In many people, a plateau is reached at near maximal exercise, beyond which the Vo2 does not change. Exercise training enables the person to achieve a greater maximal workload and a higher Vo2max.
After training, the heart rate is lower at rest and at each stage of exercise, but the maximal heart rate does not change. This approximates “220 bpm – age”.7
The stroke volume response is curvilinear, increasing early in exercise with little change thereafter. The training effect increases the resting stroke volume and the stroke volume at each workload.
The a−v O2 content difference widens as the mixed venous O2 content falls since arterial O2 content does not change in normal subjects. The maximal a−v O2 content difference increases after training.
CARDIOPULMONARY EXERCISE TESTING
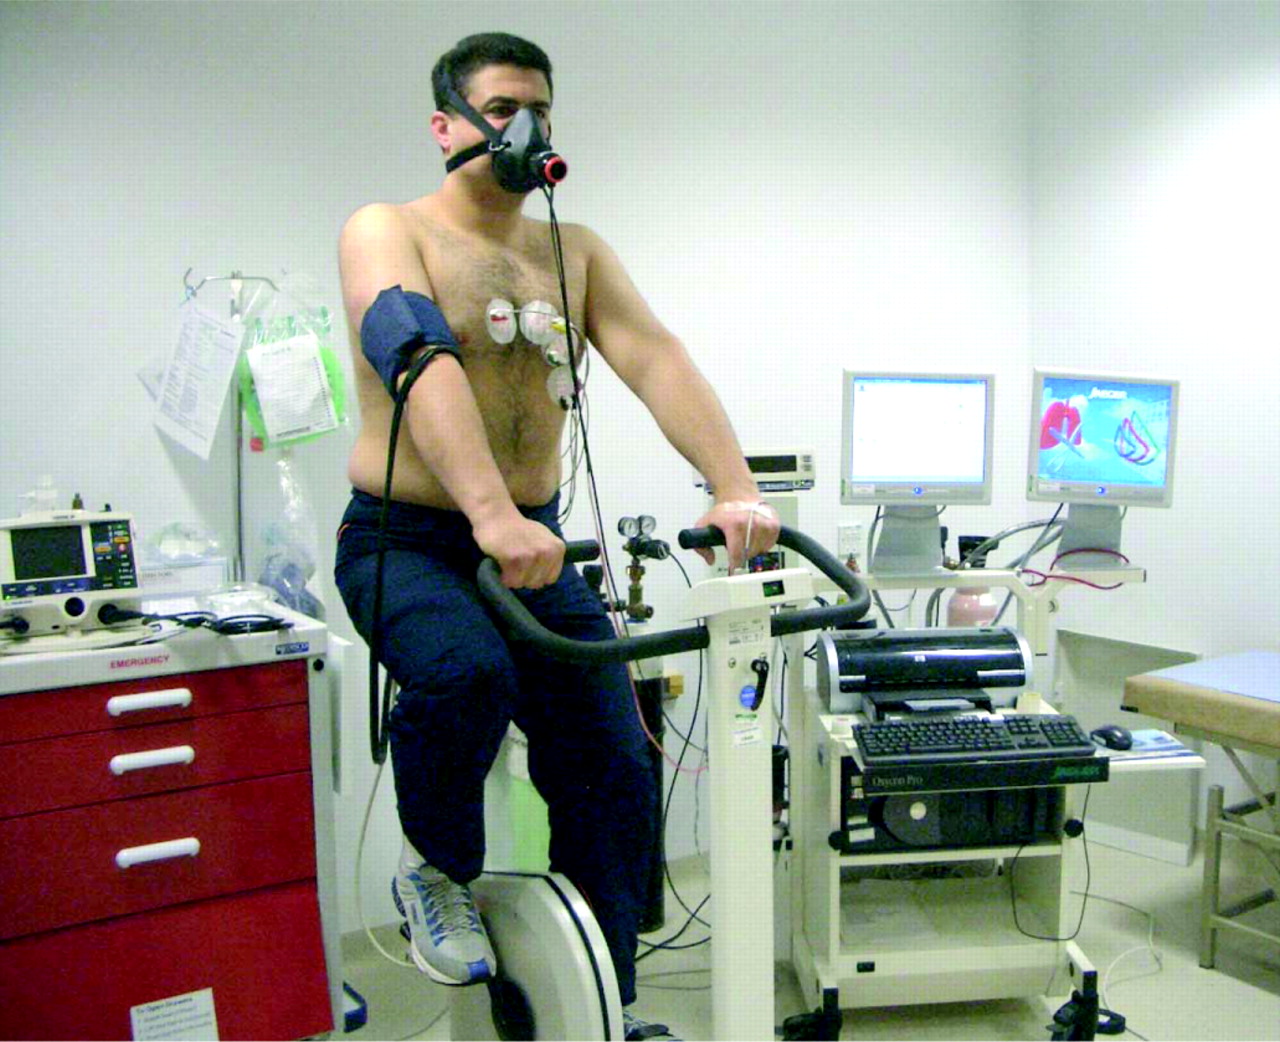
Several different methods exist for measuring ventilation and respiratory gas parameters during exercise. Most clinical systems rely on breath-by-breath analysis techniques because they provide the best measures of the metabolic response to exercise. A non-rebreathing valve is connected to a mouthpiece to prevent mixing of inspired and expired air (fig 1). Oxygen and carbon dioxide gas analysers are usually incorporated in a “metabolic cart” designed specifically for functional testing. Respiratory volumes are computed by integrating the air flow signals over the time of inspiration and expiration. Average minute volumes are derived from the breath-by-breath data multiplied by the respiratory rate.
CPET protocols
Many different protocols are used for functional testing. The purpose of the test and the functional capabilities of the patient determine the choice of protocol. In evaluating patients with CHF, both bicycle and treadmill protocols have been used. The rate of workload progression is somewhat arbitrary, although it has been suggested that optimal exercise duration for functional assessment on the bicycle is between 8 and 17 minutes.8 Bicycle work is quantified in watts (W) or in kilopod metres/min (kpm/min; 1 W = ∼6 kpm/min). The initial workload for patients with patients with CHF is usually 20–25 W and increased by 15–25 W every 2 minutes until maximal exertion is reached. Alternatively, the workload can be computer controlled for electronically braked bicycle ergometers, and a ramp protocol (eg, 10 W/min) is often used. The modified Naughton protocol is recommended for treadmill exercise testing in patients with heart failure.9 This protocol is designed to increase the workload by approximately 1 MET (3.5 ml O2/kg/min) for each 2-minute stage.
Treadmill exercise testing has several advantages over cycle ergometry (table 1),1,10 and for most people, treadmill walking is a more familiar activity than cycling. It involves a larger muscle mass and more work against gravity. Consequently, PVo2 is, on average, 5–10% higher on the treadmill than on a cycle ergometer. Holding onto the treadmill handrails usually decreases the metabolic cost of treadmill walking and should be discouraged if possible. A cycle ergometer is less prone to induce noise artefacts with better quantification of the metabolic cost. Generally it is less expensive and requires less space than the treadmill.
Patients with heart disease require continuous ECG monitoring and frequent blood pressure measurements during exercise testing. Since verbal communication is usually not possible with the mouthpiece apparatus, hand signals are usually used by the patient during exercise.
Oxygen uptake and peak oxygen uptake
Oxygen uptake (Vo2) is determined by cellular O2 demand up to some level that equates to maximal rate of O2 transport, which then is determined by that maximal rate of transport. As Vo2 increases with increasing external work, one or more of the determinants of Vo2 approach limitations (eg, stroke volume, heart rate, or tissue extraction), and Vo2 versus work rate may begin to plateau. This plateau in Vo2 has traditionally been used as the best evidence of Vo2max.
The main determinants of a normal PVo2 are genetic factors, quantity of exercising muscle, age, sex and body size. It can also be affected by training and patient motivation. PVo2 should be expressed in absolute values (l/min) and as a percentage of the predicted value. Vo2 can increase from a resting value of about 3.5 ml/kg/min (about 250 ml/min in an average person) to PVo2 values about 15 times the resting value (30–50 ml/kg/min). Athletes may attain values over 20 times their resting values (up to 80 ml/kg/min).
Figure 2 is an example of a normal CPET using the Bruce protocol. Table 2 shows the normal values of variables derived from CPET.1

Respiratory exchange ratio
The ratio of carbon dioxide output/oxygen uptake (Vco2/Vo2) is called the gas exchange ratio or respiratory exchange ratio (RER). Under steady state conditions, the RER equals the respiratory quotient (RQ). The RQ value is determined by the fuels used for metabolic processes. An RQ of 1 indicates metabolism primarily of carbohydrates, whereas an RQ of <1 indicates a mixture of carbohydrates with fat (RQ about 0.7) or protein (RQ about 0.8). The term “RQ” is often reserved for expressing events at the tissue level which are difficult to measure. The term “RER” is usually measured by gas exchange at the mouth and in true steady state, the blood and gas transport systems keep pace with tissue metabolism; thus, the RER can be used as a rough index of metabolic events (RQ). RER increases during exercise owing to either the buffered lactic acid or hyperventilation (usually towards the end of exercise).
Ventilatory anaerobic threshold
The ventilatory anaerobic threshold (VAT), formerly referred to as the anaerobic threshold, is an index used to estimate exercise capacity. During the initial (aerobic) phase of CPET, which lasts until 50–60% of Vo2max is reached, expired ventilation (VE) increases linearly with Vo2 and reflects aerobically produced CO2 in the muscles. Blood lactate levels do not change substantially during this phase, since muscle lactic acid production is minimal.
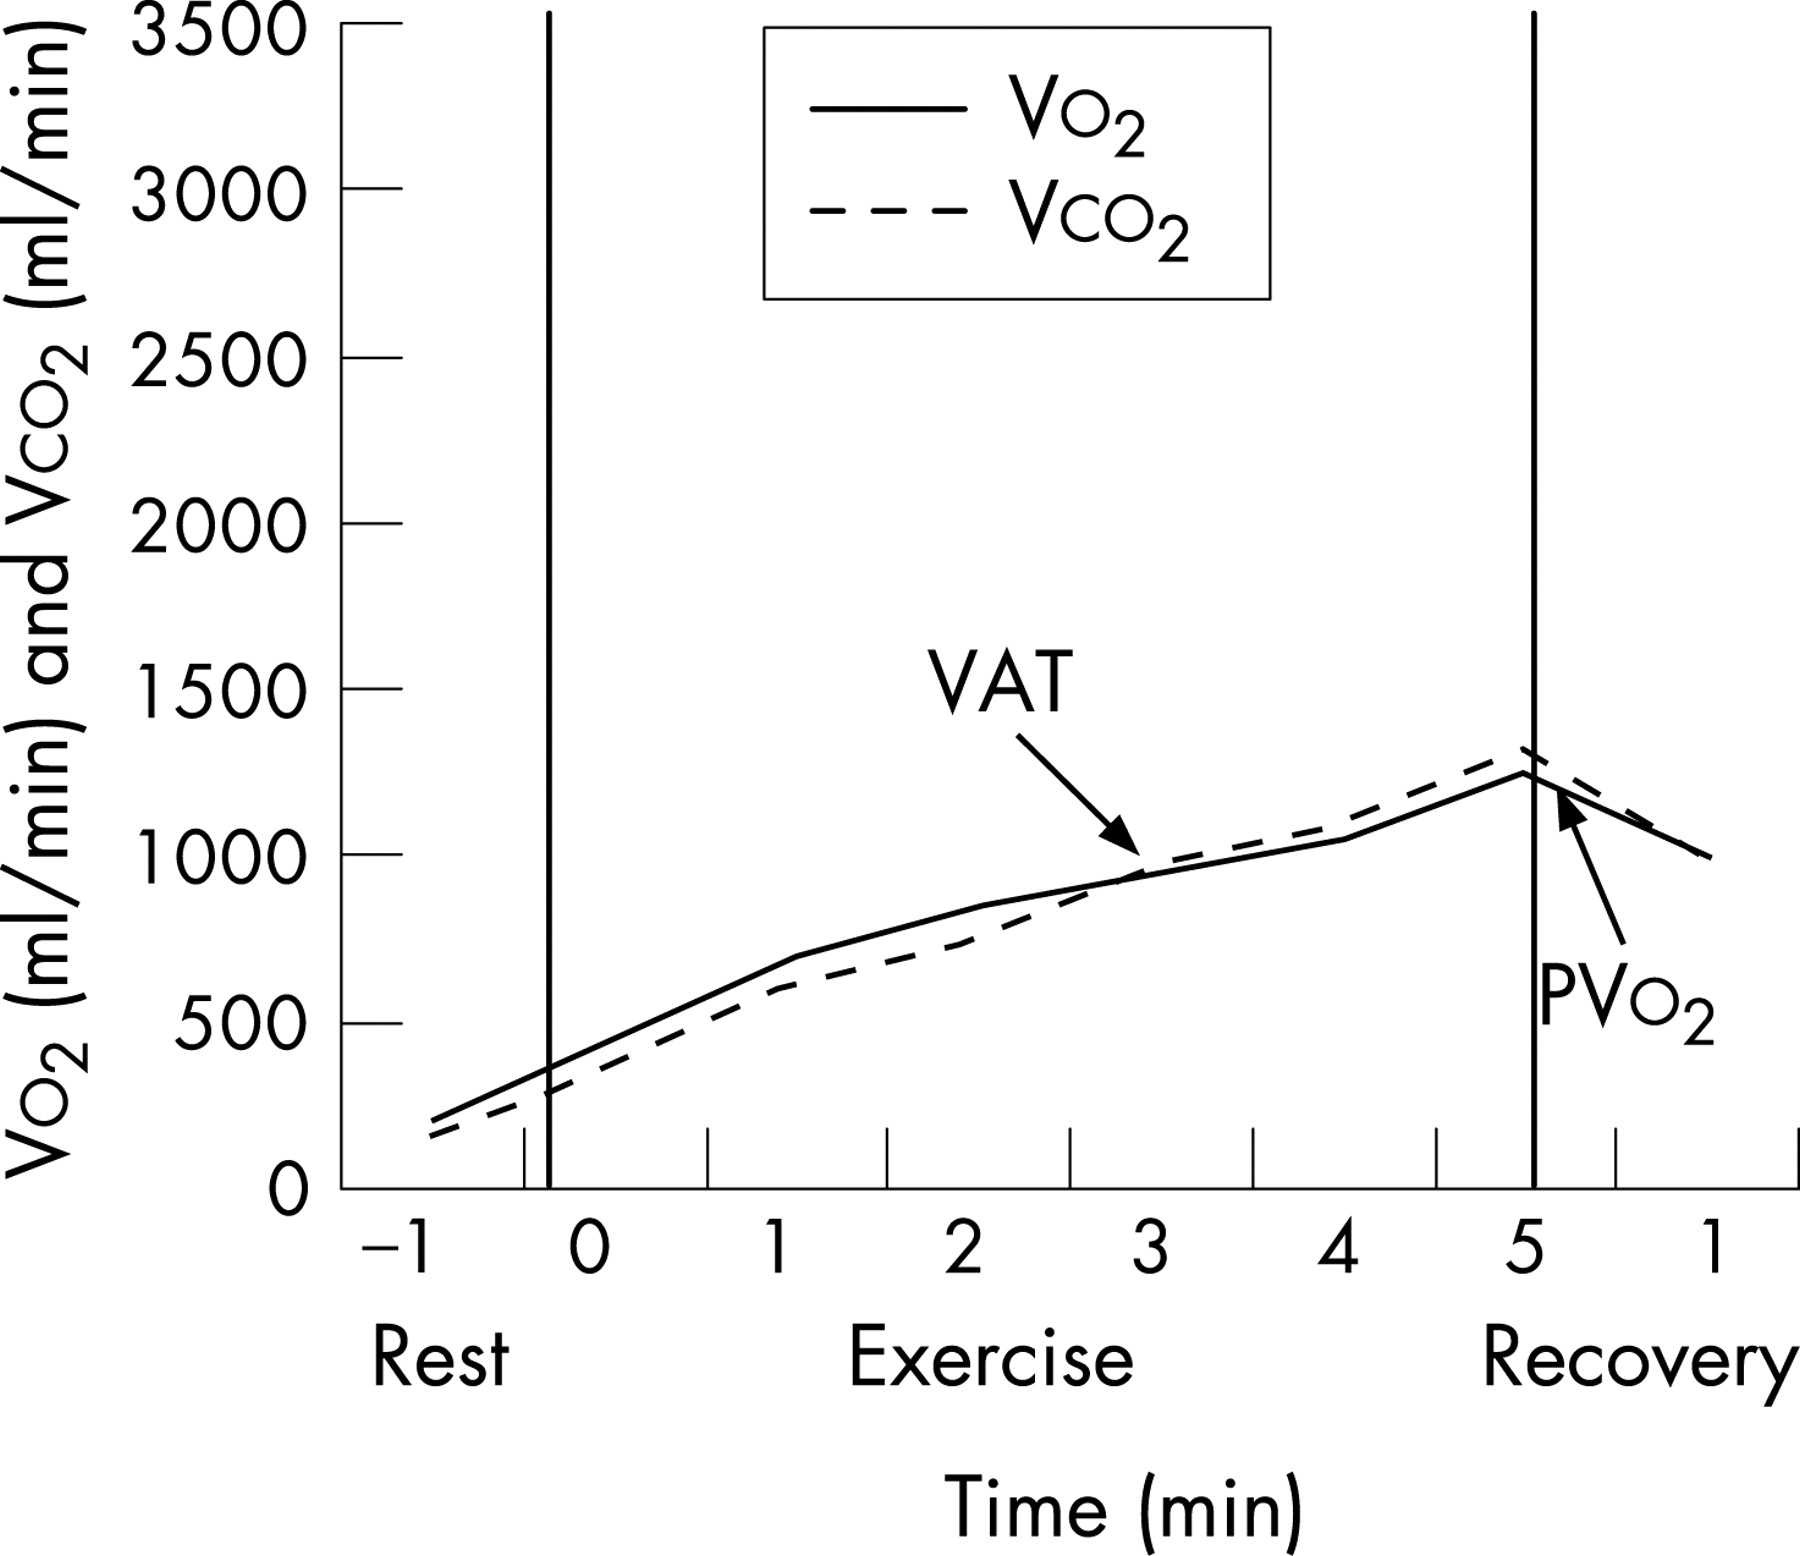
During the latter half of exercise, anaerobic metabolism occurs because oxygen supply cannot keep up with the increasing metabolic requirements of exercising muscles. At this time, there is a significant increase in lactic acid production in the muscles and in the blood lactate concentration. The Vo2 at the onset of blood lactate accumulation is called the lactate threshold or the VAT. The VAT is also defined as the point at which minute ventilation increases disproportionately relative to Vo2, a response that is generally seen at 60–70% of Vo2max.
The VAT is a useful measure as work below this level encompasses most daily living activities. The ability to achieve the VAT can help distinguish cardiac and non-cardiac (pulmonary or musculoskeletal) causes of exercise limitation, since patients who fatigue before reaching VAT are likely to have a non-cardiac problem.11 12 This is not universally true, as patients with mitral stenosis, for instance, often stop exercising before reaching VAT, while on the other hand patients with chronic obstructive pulmonary disease commonly pass the VAT.
Several methods are available to determine the VAT, and these can be classified as either invasive (measurement of lactic acid or bicarbonate) or non-invasive. Invasive estimation of the VAT is usually done by direct blood sampling and is rarely used in a clinical setting since determination of the point of rise in lactate (or the reciprocal drop in bicarbonate) requires multiple blood samples. When this method is used, the “VAT” is defined as the Vo2 at which blood lactate level increases or, alternatively, when the bicarbonate starts to drop. However, the precise definition remains controversial.1 Non-invasive methods require observing the pattern of change in Vco2 and VE relative to Vo2 as exercise intensity increases. The two main non-invasive methods for estimating the VAT are:13
The ventilatory equivalents method (fig 3): the VAT is the Vo2 at which the ventilatory equivalent for O2 (VE/Vo2 ratio) and end-tidal oxygen tension (PET O2) begin to increase systematically without an immediate increase in the ventilatory equivalent for CO2 (VE/Vco2) and end-tidal CO2 tension (PET CO2).
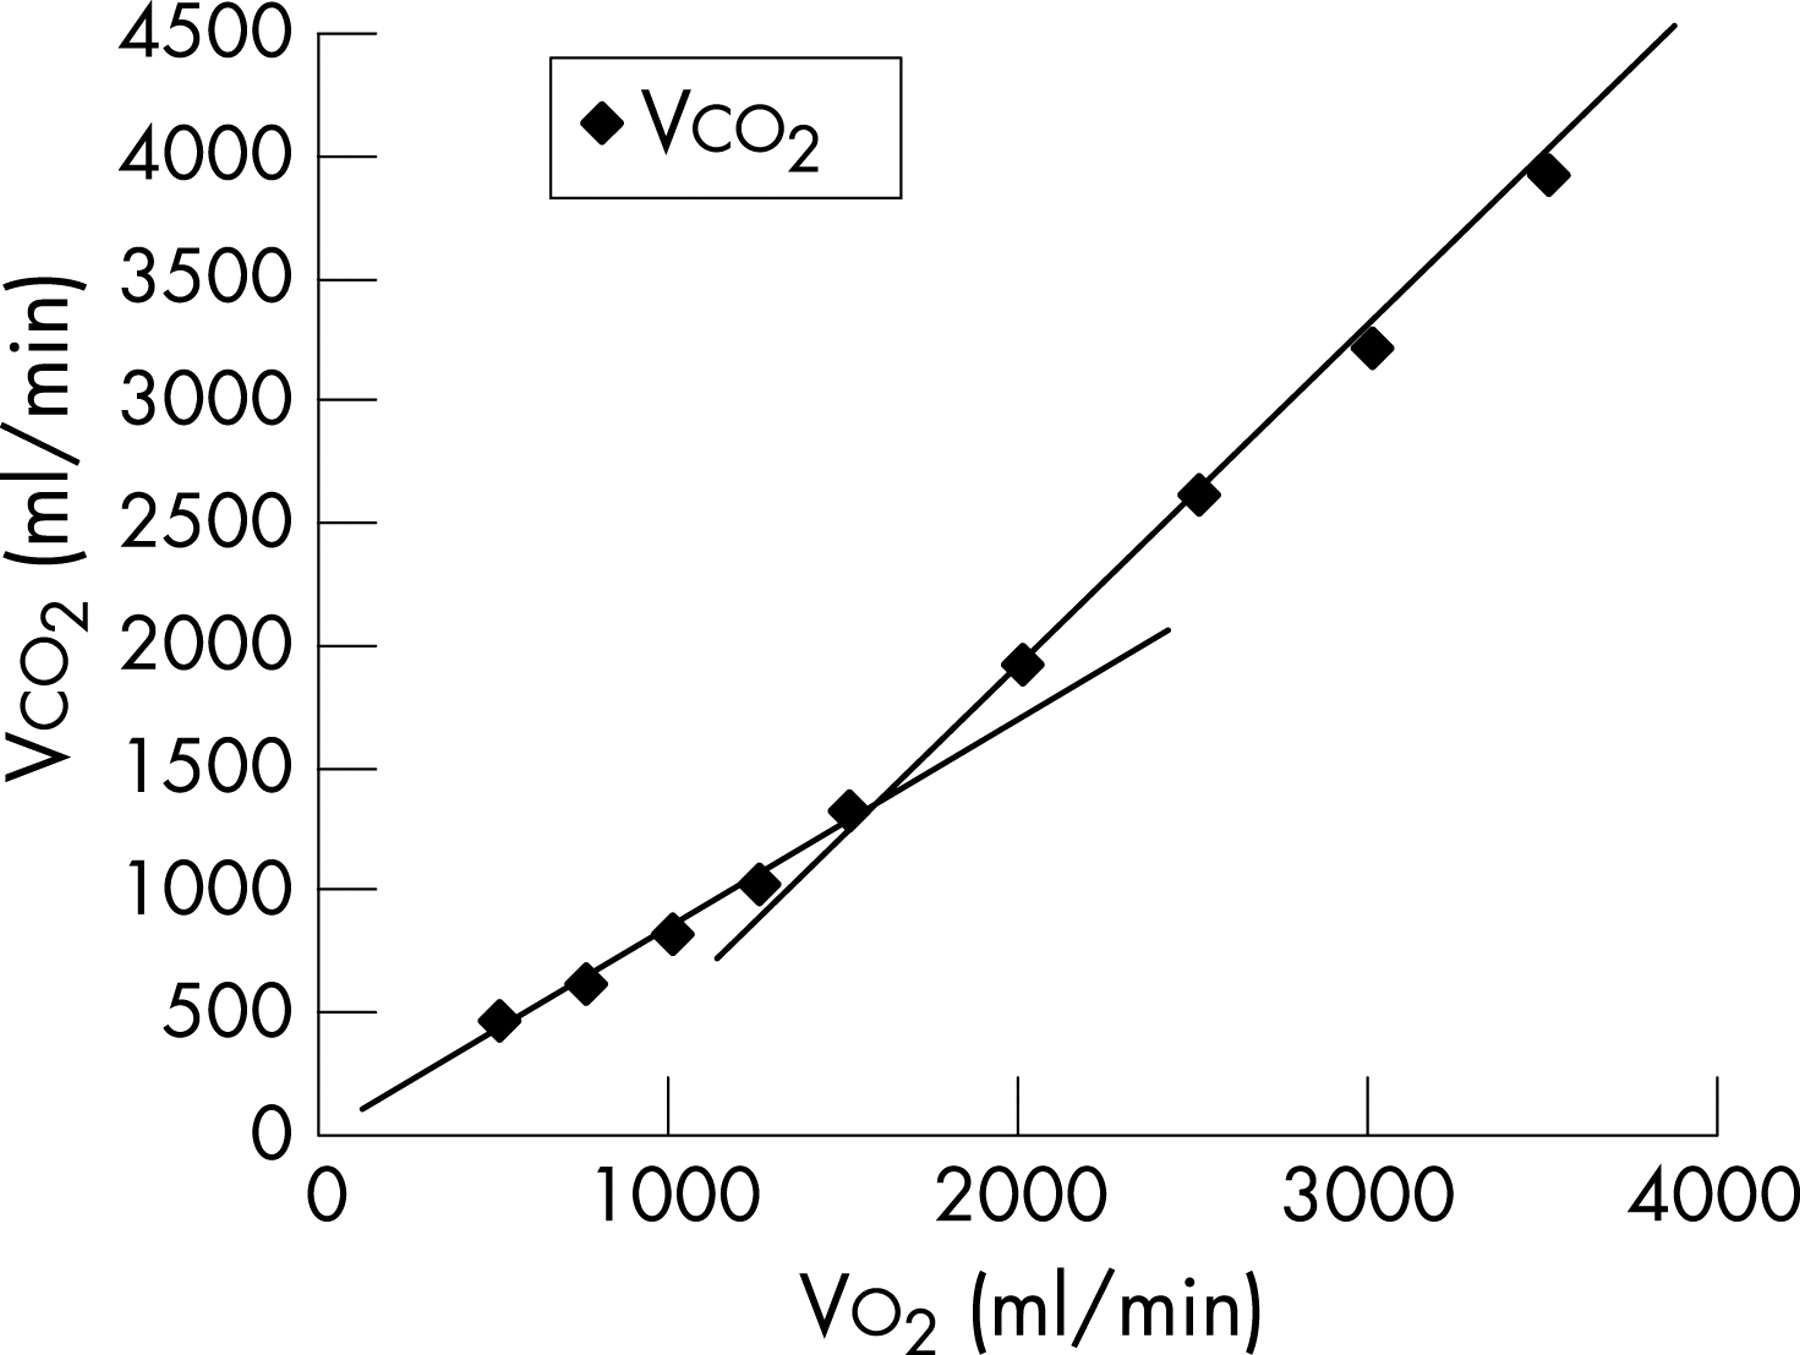
The V-slope method (fig 4): the VAT is defined as the Vo2 at which the rate of increase in Vco2 relative to Vo2 increases in the absence of hyperventilation.14 The VAT determined by this method is a more reproducible estimate.

Unfortunately, there is considerable inter- and intraobserver variability in the visual detection of the onset of anaerobic metabolism from the breath-by-breath data.15
INDICATIONS AND CONTRAINDICATIONS OF CPET
The ACC/AHA Update of Practice Guidelines for Exercise Testing, published in 2002, listed the indications for ordering a functional Vo2 exercise test (table 3).16 17 Contraindications for CPET are listed in (table 4). Although CPET provides excellent risk stratification in primary pulmonary hypertension, caution is advised when exercising these patients owing to the increased risk of sudden death as pulmonary pressure increases with exercise.18
INDICATIONS FOR TERMINATING CPET
Symptoms at maximal exercise that result in test termination include muscle fatigue, exhaustion, extreme dyspnoea, and light-headedness. Cardiac arrhythmias are usually not an indication to stop the test unless sustained tachyarrhythmias develop.
A decrease in systolic blood pressure below the resting pressure is a sign of insufficient increase in cardiac output to compensate for the exercise-induced systemic vasodilatation, and is an indication to stop the test. Other indications for CPET termination are given in (table 5).
CPET AND HEART FAILURE (HF)
Exercise intolerance is one of the main manifestations of HF, varying directly with the severity of the disease. Thus, decreased maximal exercise capacity is associated with higher New York Heart Association (NYHA) functional class, worse symptoms, poor quality of life and decreased patient survival. Exercise training may increase functional capacity and therefore improve the quality of life. Its effect on survival is unclear at present.19
Exercise capacity is reduced even in mild HF. The cardiac output may be relatively normal at rest, but usually does not increase adequately with even mild exertion.20 As in normal subjects, PVo2 in HF is directly related to cardiac output and muscle blood flow at peak exercise. However, the inability to appropriately increase cardiac output results in insufficient increase in perfusion to exercising muscles, which can cause early anaerobic metabolism, muscle fatigue, and eventually can contribute to muscle wasting.21 Patients with HF typically do not achieve a true Vo2max, therefore the term “peak Vo2” is more appropriate and is more often used. Figure 5 shows a typical example of CPET in a patient with HF.
CPET has an important role in the diagnosis, quantification of symptoms, prognosis and assessment of the success of therapeutic interventions in patients with HF.22 23
Factors contributing to exercise intolerance in HF
Several factors may contribute to exercise intolerance in patients with HF:24
The inotropic and chronotropic response to catecholamines is reduced; this defect is due, at least in part, to downregulation of β-receptors in the presence of chronically raised circulating catecholamine levels.
Augmentation of stroke volume by the Starling mechanism may be limited by diastolic dysfunction or pericardial constraint.
In contrast with normal subjects, exercise is associated with a higher increase in the pulmonary wedge pressure. This can exacerbate pulmonary congestion, thereby causing dyspnoea and limiting exercise capacity.
The presence of pulmonary hypertension and increased pulmonary vascular resistance can reduce the cardiac output response to exercise, leading to impaired exercise capacity.25
Concurrent mitral regurgitation.
Peripheral factors affecting skeletal muscles are often present, limiting the metabolic capacity of these muscles. This includes abnormalities of the endothelial function, ergoreflex activation, vasodilatory capacity and distribution of cardiac output.26
Use of CPET in assessing HF severity
The CPET is a global test of a patient’s cardiorespiratory capacity, since it reflects the entire oxygen transport system beginning with the lungs and ending with the skeletal muscles. This objective assessment offers advantages over other methods in assessing the severity of HF:
The NYHA classification of functional impairment in HF is not always accurate since it is subjective rather than objective.
Resting central haemodynamics do not always correlate well with functional impairment measured during exercise testing.
The symptoms of exercise intolerance in HF, such as dyspnoea, fatigue, or both, result from a complex interplay of mechanisms originating from both the central and peripheral components of the oxygen transport system. These symptoms are non-specific and may also be due to the side effects of the drugs or to other coexisting conditions that may or may not be related to the underlying heart disease.
Therefore, CPET is often helpful for classifying disease severity for treatment decisions and in the differential diagnosis of exercise intolerance and symptoms of dyspnoea and fatigue (table 6).1
CPET in predicting the prognosis in HF
The identification of patients at high risk of HF is of utmost importance in order to guide their pharmacological and non-pharmacological treatment (device-related treatments, heart transplantation).27–29 CPET, when properly performed, provides the best objective measurement of peak functional capacity, and has become an important clinical tool in defining the severity of HF and in predicting outcome.30 The most relevant measures derived from CPET which have direct impact on decision making and the management plan in patients with HF are as follows:31
Peak oxygen consumption (PVo2)
There is extensive evidence supporting the use of PVo2 in stratifying the risk in patients with chronic HF. The study by Mancini et al is considered to be the cornerstone of the documentation of the prognostic power of PVo2 in this group of patents.32 In the study 116 consecutive male patients with CHF referred for heart transplantation were divided into the following three groups:
Patients with PVo2 of <14 ml/kg/min who had been accepted for heart transplantation.
Patients with PVo2 of ⩾14 ml/kg/min who were considered too well for transplantation.
Patients with PVo2 of <14 ml/kg/min but with significant comorbidity that precluded heart transplantation.
The 1-year survival rates in groups 1, 2 and 3 were 48%, 94% and 47%, respectively. Of note, a PVo2 of <10 ml/kg/min was associated with significantly poorer predicted survival. The results of this study were adopted by the AHA/ACC consensus statement on the selection and treatment of candidates for heart transplantation.33 This consensus statement emphasised that once maximal treatment has been instituted and maintained, PVo2 has a predictive role and that for patients with PVo2 <14 ml/kg/min, it is important to prove that exercise testing was truly maximal by documenting achievement of the VAT at approximately 50–70% of PVo2.
As the value of PVo2 can be influenced by many factors other than the severity of CHF, the PVo2 value adjusted for these factors should theoretically improve the predictive accuracy. Stelken et al34 retrospectively studied 181 patients with CHF in order to compare the percentage achieved of the predicted PVo2, taking into account age, gender, and weight, with the traditionally used absolute PVo2 measured in ml/kg/min. During the 12-month follow-up, non-survivors achieved a lower percentage of the predicted PVo2 and a lower absolute PVo2 than survivors, and multivariate analysis showed that a value <50% of the predicted PVo2 was the strongest predictor of cardiac events, better than the cut-off absolute value of PVo2 of <14 ml/kg/min. Aaronson and Mancini refuted these results in another study.35 Osman et al have documented that the adjustment of PVo2 to lean body weight provides greater prognostic value than the traditional standard PVo2. Lean PVo2, either as a continuous variable or using a cut-off value of ⩽19 ml/kg/min, was a better predictor of outcome than unadjusted PVo2 in 225 patients with chronic HF.36
Ventilatory anaerobic threshold
The VAT has been proposed as a submaximal index of exercise capacity, independent of the patient’s motivation. A failure to reach the VAT strongly suggests poor motivation or non-cardiovascular limitation of exercise tolerance. The VAT is undetectable in a large proportion of patients with CHF, especially in those with reduced exercise tolerance, restricting the prognostic and decisional value of PVo2.37
Opasich et al evaluated the predictive role of PVo2 in 505 male patients with CHF in whom VAT had and had not been identified.38 When the VAT was detected, the cardiac event rates were:
59% in patients with PVo2 values of ⩽10 ml/kg/min
32% in patients with PVo2 values of >10 to ⩽14 ml/kg/min
32% in patients with PVo2 values of >14 to ⩽18 ml/kg/min
15% in patients with PVo2 values of >18 ml/kg/min.
Therefore, when VAT is detected, patients with a PVo2 of <10 ml/kg/min have a high event rate, whereas those with a PVo2 of >18 ml/kg/min have a good prognosis. Patients with intermediate functional capacity (PVo2 10–18 ml/kg/min) fall into a range in which PVo2 does not provide predictive or decisional information.
When VAT was not detected, the event rate was 46% in patients with PVo2 of ⩽10 ml/kg/min, and was almost identical among those with PVo2 values of >10 to ⩽14 ml/kg/min, >14 to ⩽18 ml/kg/min, and >18 ml/kg/min (29%, 23% and 22%, respectively). Thus, When the VAT is undetectable, patients with PVo2 of <10 ml/kg/min have a high risk of events; and for those with PVo2 >10 ml/kg/min, the risk stratification is considered to be inconclusive and the replication of CPET is recommended.
Ventilatory expired gas parameters (VE/Vco2slope)
Recently, the VE/Vco2 slope has been proposed as an alternative prognostic indicator in patients with CHF. This dimensionless ratio indicates how many litres of air are being breathed to eliminate 1 litre of CO2. An abnormally high relationship between minute ventilation (VE) and carbon dioxide output (Vco2) (VE/Vco2 slope) is associated with a poor outcome. Chua et al reported that a VE/Vco2 slope of >34 was associated with worse prognosis in 173 patients with chronic HF,39 and Kleber et al selected a VE/Vco2 slope that was >130% of the age adjusted and sex-adjusted value as the best predictive cut-off point in 142 patients.40 MacGowan et al substantiated that the combination of a peak VE/Vco2 slope of >50 and a peak Vo2 of ⩽15 ml/kg/min was associated with an 82% mortality rate in 104 patients with chronic HF.41 Finally, Robbins et al found that a VE/Vco2 slope of ⩾44.7 at peak exercise was better than a peak Vo2 of ⩽13.9 ml/kg/min in predicting 18-month survival.42
Recommended risk stratification algorithm
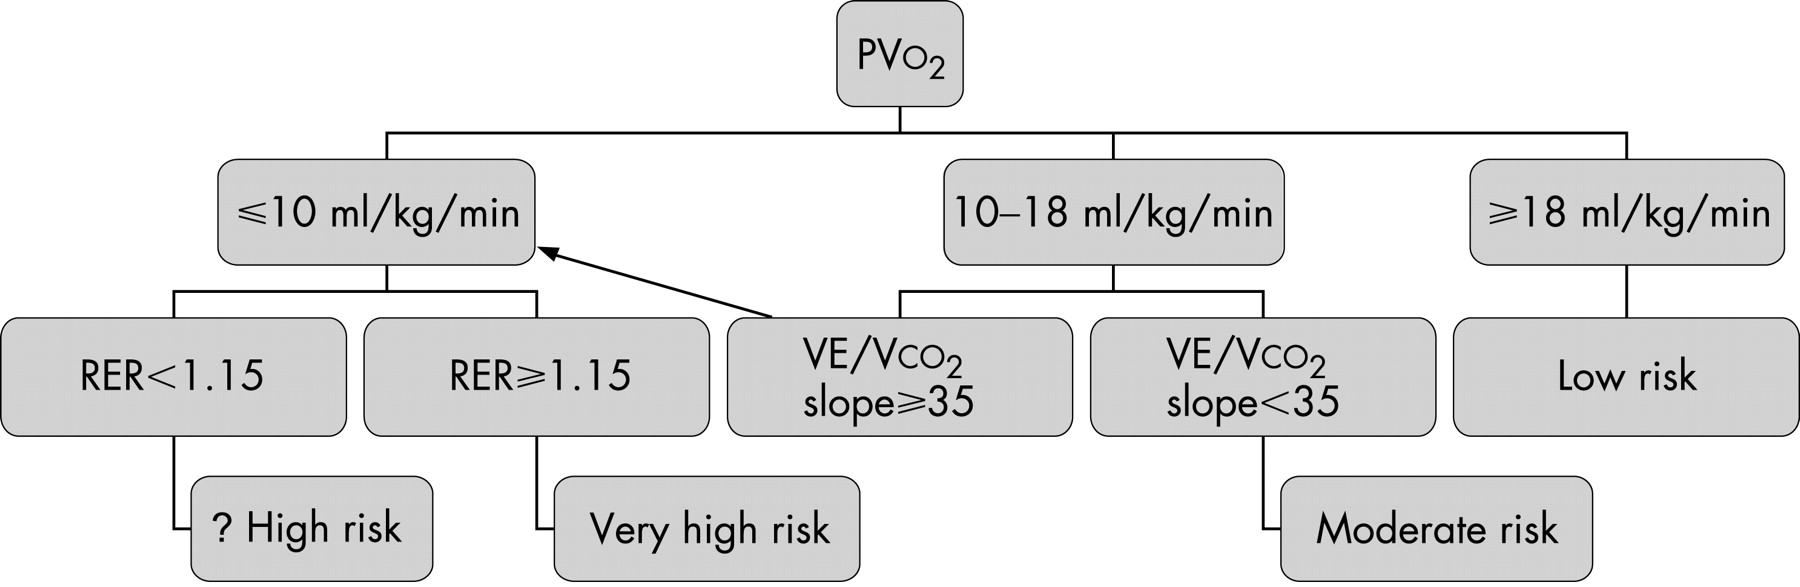
Taking into account the above mentioned measures derived from CPET to stratify risk for patients with HF and results from other trials,43–45 Corra and Mezzani proposed a new risk stratification algorithm (fig 6).31 This algorithm is structured on a multiparametric decoding scrutiny employing the stepwise introduction of PVo2, VE/Vco2slope, and peak RER. They divided patients with CHF into the following three groups:

PVo2 of ⩽10 ml/kg/min identifies high-risk patients. The peak RER can correctly discriminate outcome, as those reaching an RER of at least 1.15 at peak effort have a higher risk, whereas those who do not attain a peak RER of 1.15 have a prognosis comparable to that of patients with a better functional capacity.
PVo2 of ⩾18 ml/kg/min is compatible with a fairly good long-term prognosis.
PVo2 between 10 and 18 ml/kg/min indicates a moderate risk of cardiac events. A VE/Vco2slope of ⩾35 allows the identification of those patients with worse outcomes.
The VE/Vco2 slope yields an efficient predictive contribution for almost one-quarter of patients with moderate chronic HF. The attainment of a peak RER of ⩾1.15 allows the identification of nearly half of patients with severe exercise intolerance with “true” low peak aerobic power, who are thus at high risk. This stepwise process can assist doctors in clinical decision making by describing a reliable risk for the individual patient.
CPET DATA AND ITS REPORTING
The reporting of CPET should clearly show the indication as well as the beginning and end of exercise. Table 7 summarises the information that should be included in the final report, and an example of a CPET data report is available online as supplementary material (see http://heart.bmj.com/supplemental).
CONCLUSIONS
CPET is a global test of the cardiorespiratory capacity that reflects the entire oxygen transport system starting with the lungs and ending with the skeletal muscles. Interpretation of CPET can be a complex task; however, PVo2 derived from CPET is a strong and independent factor in determining the prognosis of patients with CHF. In the past few years, it has been discovered that a single arbitrary cut-off point for PVo2 may be unlikely to describe the true risk of events, and that a stepwise approach may be more helpful. Specific research is still needed to confirm the importance of a stepwise multiparametric interpretation of CPET. Finally, CPET has an important role as part of a holistic approach to the assessment and management of cardiac patients.
Supplementary material available online at http://heart.bmj.com/supplemental
REFERENCES
Supplementary materials
Files in this Data Supplement:
Footnotes
Conflict of interest: None declared.
- Abbreviations:
- CHF
- congestive heart failure
- CPET
- cardiopulmonary exercise testing
- HF
- heart failure
- MET
- metabolic equivalent
- NYHA
- New York Heart Association
- PVo2
- peak Vo2
- RER
- respiratory exchange ratio
- RQ
- respiratory quotient
- VAT
- ventilatory anaerobic threshold