Article Text

Abstract
Objectives To assess the completeness and representativeness of body mass index (BMI) data in the Clinical Practice Research Datalink (CPRD), and determine an optimal strategy for their use.
Design Descriptive study.
Setting Electronic healthcare records from primary care.
Participants A million patient random sample from the UK CPRD primary care database, aged ≥16 years.
Primary and secondary outcome measures BMI completeness in CPRD was evaluated by age, sex and calendar period. CPRD-based summary BMI statistics for each calendar year (2003–2010) were age-standardised and sex-standardised and compared with equivalent statistics from the Health Survey for England (HSE).
Results BMI completeness increased over calendar time from 37% in 1990–1994 to 77% in 2005–2011, was higher among females and increased with age. When BMI at specific time points was assigned based on the most recent record, calendar–year-specific mean BMI statistics underestimated equivalent HSE statistics by 0.75–1.1 kg/m2. Restriction to those with a recent (≤3 years) BMI resulted in mean BMI estimates closer to HSE (≤0.28 kg/m2 underestimation), but excluded up to 47% of patients. An alternative strategy of imputing up-to-date BMI based on modelled changes in BMI over time since the last available record also led to mean BMI estimates that were close to HSE (≤0.37 kg/m2 underestimation).
Conclusions Completeness of BMI in CPRD increased over time and varied by age and sex. At a given point in time, a large proportion of the most recent BMIs are unlikely to reflect current BMI; consequent BMI misclassification might be reduced by employing model-based imputation of current BMI.
- Epidemiology
- Primary Care
- Statistics & Research Methods
This is an Open Access article distributed in accordance with the Creative Commons Attribution Non Commercial (CC BY-NC 3.0) license, which permits others to distribute, remix, adapt, build upon this work non-commercially, and license their derivative works on different terms, provided the original work is properly cited and the use is non-commercial. See: http://creativecommons.org/licenses/by-nc/3.0/
Statistics from Altmetric.com
Article summary
Strengths and limitations of this study
-
The results presented here are based on a large random sample from Clinical Practice Research Datalink (CPRD); therefore, we can confidently generalise the findings to the whole CPRD database and to similar databases based on the UK primary care records.
-
To assess the representativeness of CPRD body mass index (BMI) data, we compared with data from the Health Survey for England, which is based on a large nationally representative sample and includes BMI information measured by trained interviewers.
-
Our study did not look at BMI recordings among children as this would require a different strategy.
Introduction
Overweight and obesity are major contributors to global disease burden1 and are associated with substantial excess mortality.2 The prevalence of obesity is increasing in developed and developing countries3 ,4 and is a growing concern for policy makers. In England, the prevalence of obesity rose steadily from 1993 to 2010: from 13 to 26% in men, and from 16 to 26% in women.5 Owing to its association with various diseases and health outcomes, body mass index (BMI, the metric most widely used to classify overweight and obesity) is an important factor in many epidemiological studies, both as an exposure and as a potential confounder.
Databases of routinely collected electronic healthcare records are becoming an increasingly valuable resource in epidemiology, allowing population-level research on large, representative samples. The UK Clinical Practice Research Datalink (CPRD) (formerly the General Practice Research Database or GPRD) is widely used and contains comprehensive medical records for approximately 8% of the UK population,6 allowing epidemiological studies to be carried out on a range of topics and with much greater statistical power than is typically available in traditional cohort studies. However, a shortcoming of these databases is that lifestyle data, such as BMI, tend to be opportunistically recorded (ie, recorded when the patient is attending for other reasons or when the matter is of direct clinical importance) and can be incomplete. Furthermore, those with non-missing lifestyle data may be unrepresentative of the general population. BMI has been an important covariate in many published studies based on CPRD,7–14 but the completeness and representativeness of the BMI data have not been previously documented.
Our aim was to undertake an in-depth investigation of BMI recordings in CPRD, including quantifying the completeness of BMI data, and assessing their representativeness by comparing summary statistics based on CPRD data with equivalent statistics from a representative general population survey. We also aimed to suggest and discuss how to deal with the limitations of these routinely collected BMI data.
Methods
Data sources
Clinical Practice Research Datalink (CPRD
CPRD is a clinical database comprising anonymised computerised medical records from general practitioners (GPs) in the UK. Approximately 8% of the UK population are currently included and the database is broadly representative of the UK population.15 ,16 Registration with a GP is near universal in the UK,17 and GPs act as gatekeepers to the health system so that the CPRD data form a comprehensive health record, comprising demographic information, clinically relevant lifestyle data, prescription details, clinical events, preventive care provided, specialist referrals and hospital admissions and their major outcomes. Data undergo quality checks and practices are designated as ‘up to standard’ in CPRD from the date that they meet specified data entry quality criteria. For this study, we obtained a random sample of one million CPRD patients, because carrying out the analysis on the full CPRD database would be computationally difficult and the reduction in precision of our estimates that would arise by restricting our analysis to a one million random sample is extremely small.
BMI index data in CPRD
Height and weight measurements are recorded in CPRD whenever measured as part of routine care. We obtained all height and weight records and calculated BMI (BMI=weight/height2). Records without any measurements or with implausible measurements were excluded (figure 1).
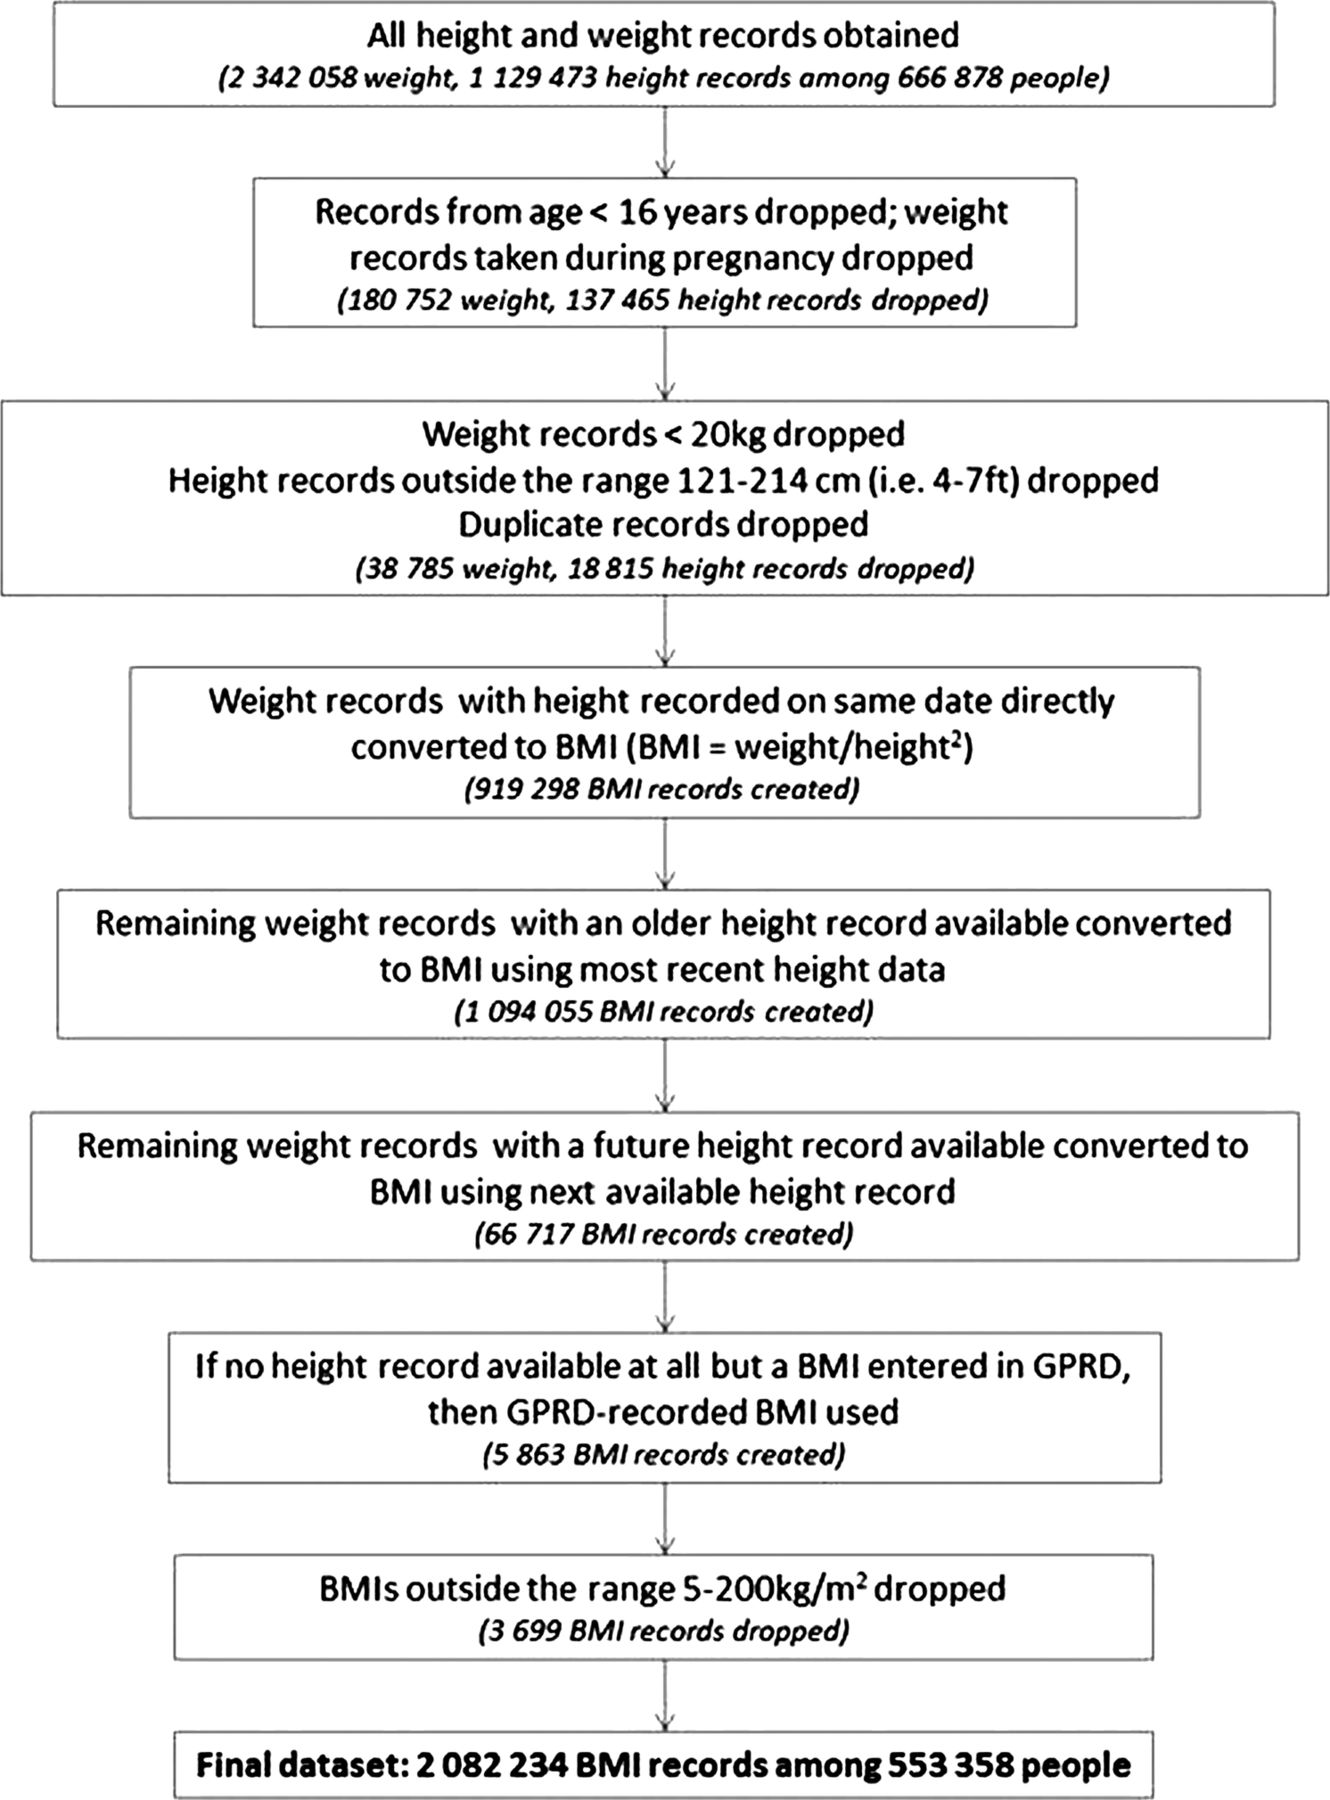
Initial data processing to generate body mass index for analysis.
Health survey for England
We obtained published Health Survey for England (HSE) data for BMI from the National Health Service (NHS) Information Centre.18 HSE is an annual survey designed to produce a representative sample of the adult population aged ≥16 years and living in private households (sample size 14 836 in 2003 and 8420 in 2010). Surveys were interviewer administered with interviewers measuring the weight and height of all participants. Data from 2003 to 2010 were obtained, and these data have been weighted to reduce bias from non-response, based on a logistic regression model incorporating age, sex, household type (based on the number of adults and children living in a household), Strategic Health Authority region and social class (defined using the National Statistics Socioeconomic Classification system). The methods are described in more detail elsewhere.19
Statistical methods
Completeness of BMI data in CPRD
In the main analyses, BMI completeness data in CPRD were estimated by calendar period (1990–1994, 1995–1999, 2000–2004, 2005–2011). To calculate completeness for a particular calendar period, all individuals from the one million sample who were registered, aged ≥16 years and under follow-up in ‘up to standard’ practices on the midpoint of the period were identified and included in the denominator. Among these individuals, the numerator comprised either those with any previous BMI available in their electronic record regardless of how long ago it was entered or those with a BMI available up to 3 years prior to this date. Completeness data were generated by age group, sex and among those for whom, for clinical reasons, BMI should be routinely monitored (those with type 2 diabetes, schizophrenia/other psychoses and ≥2 recent (last 6 months) statin prescriptions). We also investigated whether completeness could be improved by searching for clinical codes (‘Read codes’) indicating the BMI category. We have not presented CIs for these descriptive statistics because the sample size made sampling error negligible (eg,SEs for the proportions with complete BMI data in the age and calendar-year subgroups were all <0.5%).
Comparison of CPRD BMI data with HSE data
We compared mean BMI over calendar time based on complete CPRD BMI data with equivalent HSE figures, for the period 2003–2010 (since, from 2003 onwards, HSE data were adjusted for non-response). CPRD mean BMI was based on patients registered and under up-to-standard follow-up at the midpoint of the calendar-year. We produced two sets of CPRD mean BMI statistics: first, we used the last BMI observation carried forward (regardless of how long ago it was recorded); second, we restricted our study to patients with a recent BMI available (up to 3 years before the midpoint of the calendar year). As stated above, CIs are not presented because there was negligible sampling error (maximum SE=0.02 kg/m2). To make like-with-like comparisons with HSE, CPRD data were restricted to English practices (for comparisons with HSE data only), and mean BMI was age-standardised and sex-standardised to the HSE population structure. Proportions classified as obese (BMI≥30 kg/m2) over time and based on CPRD and HSE data were also compared.
Model-based imputation of up-to-date BMI measures in CPRD
We explored whether outdated BMI measures in CPRD could be usefully updated by imputation based on a model predicting changes in individual-level BMI over time. We used data from individuals with multiple BMI records to model the expected change in BMI as a function of time since the BMI recording (restricting to individuals with BMI records ≤10 years apart). We fitted a linear regression model with change in BMI as the outcome; the main covariate predicting change in BMI was elapsed time, which was included as a three knot cubic spline to allow for non-linearity; we also included interactions between the spline basis variables and indicator variables for age and sex. Feasible weighted least squares estimation was used to allow for heteroscedasticity.20
Having specified a model for change in BMI over time, we first explored its performance among individuals with at least two BMIs entered in CPRD, by predicting the most recent BMI based on the previous BMI record and the elapsed time; we compared the distribution of the errors from this approach with the distribution of the errors by simply using the last observation carried forward. We then repeated the comparison with the HSE mean BMI data for each calendar year. This time, we included all individuals with a BMI record in the previous 10 years and used the model described above to impute current BMI at the midpoint of the calendar year by predicting the change in BMI since the last available BMI record. We did this within a multiple imputation framework (using five imputations) to account for uncertainty in the modelled changes over time.21
Results
Completeness of BMI data in CPRD
In 1990–1994, 37% of individuals had at least one previously recorded BMI, and the proportion increased to 77% by 2005–2011(table 1).The proportion of individuals with a recent BMI (recorded in the previous 3 years) was lower in each calendar-period (35% in 1990–1994 rising to 51% in 2005–2011). BMI completeness generally increased with age up to 75 years, with a lower proportion in the oldest age group having data available. Data for single calendar years are shown in online supplementary appendix table A1 and illustrate similar patterns. BMI data appeared to be consistently more widely available among women than men (figure 2). As expected, BMI completeness was higher in particular clinical subgroups: in total, 97% of patients with a record of type II diabetes had a recent BMI recorded, along with over 78% of those with a diagnosis of schizophrenia/psychoses (see online supplementary appendix table A2). This is in line with the quality and outcomes framework (QOF), which has encouraged BMI monitoring in these conditions since 2004.22 BMI completeness was also high among current statin users (82% with a recent BMI available).
Completeness of BMI data in the CPRD, by age and calendar period

Completeness of body mass index data in Clinical Practice Research Datalink, by gender and calendar–period.
There was little extra information available in clinical (‘Read’) codes relating to BMI. In the most recent calendar period, of 75 518 individuals with no previous BMI record available, only 1222 (1.6%) had ever had a clinical code that would enable classification into BMI categories (underweight, normal, overweight/obese). Furthermore, for those with a previous BMI, only a small proportion had more recent information related to BMI recorded in a clinical code (7675/250 430=3.0% in the most recent period).
Summary statistics using complete CPRD BMI data and comparison with HSE
We found that age-standardised and sex-standardised mean BMI based on CPRD data was consistently and substantially lower (by up to 1.1 kg/m2) than in the HSE data (mean BMI in CPRD=25.7 kg/m2 in 2003 rising to 26.3 in 2010, compared with 26.8 kg/m2 (95% CI 26.7 to 26.9) and 27.3 (27.1 to 27.5), respectively, in HSE; figure 3).

Mean body mass index (BMI) over calendar time comparing those with BMI recorded in Clinical Practice Research Datalink (English practices) with the Health Survey for England 2010 data.
When BMI entries more than 3 years old were discarded, between 33 and 47% of patients were lost across calendar-years. However, the estimated mean BMI in CPRD was considerably closer to what would be expected based on the HSE data, with the CPRD data underestimating the HSE statistics by only between 0.04 and 0.28 kg/m2 in individual calendar-years and the CPRD estimate falling within the HSE CI for two of the most recent 3 calendar-years (mean BMI in CPRD=26.9, 27.0 and 27.0 kg/m2 compared with 27.0 (26.9 to 27.1), 27.0 (26.8 to 27.2) and 27.3 (27.1 to 27.5) in HSE, in 2008, 2009 and 2010, respectively). Age-stratified and sex-stratified data demonstrated similar patterns, except that in the eldest age group (75+ years), restriction to those with recent BMI measures did not bring the estimated BMI substantially closer to the HSE figures (see online supplementary appendix figure A1).
We also compared the proportions classified as obese between CPRD and HSE (see online supplementary appendix figure A2). Consistent with the previous analysis, using any previous BMI reading to classify individuals in CPRD resulted in lower obesity rates than expected based on the HSE data, while restricting to patients with a recent reading led to estimated obesity rates close to those in HSE.
Model-based imputation of up-to-date BMI measures in CPRD
The contrast between BMI summary statistics based on recent measures and those based on any previous measures suggested that older BMI records were tending to underestimate current BMI. We therefore examined whether a model could be developed to impute current BMI, taking into account the elapsed time since the last measure. In a linear regression model for change in BMI over time, we estimated that on average BMI increased over the 10-year period following a BMI record for those aged up to 69 years at the time of the record and decreased over time in those aged 70 years or more (see online supplementary appendix figure A3). We tested the predictive performance of our model by predicting the most recent BMI based on the previous one, among patients with CPRD with more than one recorded BMI available. When the older BMI was less than 3 years old, there was little gain in applying the correction compared with carrying the older observation forward (figure 4). However, when there was a longer gap, carrying the previous BMI forward tended to underestimate the later BMI, while employing the model-based imputation removed the underestimation and led to smaller errors on average (median error=−0.70 kg/m2 (IQR −2.18 to +0.56) using the last observation carried forward, compared with +0.11 kg/m2 (−1.29 to +1.40) using the model-based imputation).

Error in prediction of most recent BMI from older BMI, comparing simple last observation carried forward with model-based imputation of up-to-date BMI—stratified by time gap between readings.
We then repeated the comparison of mean BMI in CPRD versus HSE, this time using our model for change in BMI over time as a basis for performing multiple imputations of current BMI based on the latest available measure and the time since it was recorded. The estimated mean BMIs were now in line with those based on only recent data in the earlier analysis, being only between 0.04 and 0.37 kg/m2 lower than the HSE statistics in individual calendar years (figure 3, circles). Even with multiple imputation, CIs remained extremely narrow (<0.07 kg/m2) due to the large sample size, and therefore are not shown in the figure. Of note, all patients with a BMI recorded up to 10 years before the midpoint of the calendar year of interest were now included in the estimation of the ‘corrected’ means; thus, in individual calendar years, only 9–13% of patients were dropped, compared to 33–47% of patients when dropping BMI records >3 years old.
Discussion
Main findings
BMI completeness has increased over calendar time (rising from 37% in 1990–1994 to 77% in 2005–2011). Completeness was higher among females, older age groups and clinical subgroups where recording BMI is encouraged. When BMI on the date of interest was assigned to individual patients in CPRD using the last available record, regardless of how long ago it was entered, we found that the resulting mean BMI statistics for the CPRD population were consistently lower than the equivalent HSE estimates (by up to 1.1 kg/m2). This appeared to be driven by older BMI records tending to systematically underestimate current BMI: when only recent CPRD BMI records (≤3 years old) were used, the mean BMI statistics were closer to the HSE estimates. However, a substantial number of patients were then excluded altogether (33–47% across years). Finally, we suggested a process for modelling changes in BMI after a BMI record, which could allow researchers to impute BMI on the date of interest and avoid dropping large numbers without a recent measure from their analyses.
Comparison with other studies
There are very few comparable studies (see online supplementary appendix table A2). However, the proportion of patients with a recent BMI recording in CPRD is in line with a summary of the QRESEARCH database (a similar UK primary care database with data from over 530 general practices using EMIS software rather than VISION software)23; by March 2007, 58% of registered patients aged 16+ years had their BMI recorded in the past 5 years; this compares with 51% with a BMI recorded in the last 3 years in our analysis (for 2005–2011). Similar to our study, the QRESEARCH report showed an increase in completeness over time, rising from 42% in 2000/2001 to 58% in 2007. In a third UK primary care database, The Health Improvement Network (THIN) , the proportion of newly registered patients between 2004 and 2006 with BMI data was in line with our findings; 62% of patients had a height recording and 66% had a weight recording within 12 months of registration.24
Explanation of findings
Completeness
Increasing the completeness of BMI over time may reflect a general trend towards encouragement to record BMI in primary care. Greater BMI completeness among females and older age groups may have a number of explanations including higher consultation rates in primary care 25 ,26 and different prevalences of diseases in which it is important to monitor BMI.
Comparison of CPRD BMI data with HSE data
Mean BMI based on the CPRD population was lower in each calendar year than the equivalent HSE estimates when BMI in CPRD was assigned using the last available record; however, when the analysis was restricted to those with a recent BMI record, estimates from CPRD were close to the HSE estimates. This suggests that the substantial proportion of BMI recordings in CPRD that were outdated on the date of interest may have driven the apparent underestimation of mean BMI in CPRD in the unrestricted analysis. This, in turn, would imply that individual BMIs tend to increase over time, and indeed when we specifically modelled changes in BMI over time, we found a pattern of increasing BMI with age for those <70 years old, consistent with prospective cohort studies with repeated BMI measurements27–29; this pattern of increasing BMI over time is likely to be driven specifically by weight change, since adult height would not change substantially in this age range. A simple adjustment of outdated BMIs based on our modelled changes over time brought the CPRD mean BMI statistics in line with the HSE estimates, and when we validated the adjustment in a subset of patients with repeated BMI measures, we found smaller errors on average, compared with simply carrying outdated BMI records forwards.
Of note, we observed that CPRD consistently underestimated BMI compared to HSE among those aged ≥75 years, even when only recent records were used; this may reflect the fact that institutionalised patients are represented in CPRD but not in HSE: HSE may not be an ideal comparison for this age group since elderly people in institutions (who are represented in CPRD) may be more likely to be frail and have lower BMIs than those living in private households.
Implications
First, our findings suggest that BMI completeness is likely to vary between studies depending on the study population and study period. BMI data are not likely to be missing completely at random (eg, missingness may vary by patient characteristics or particular diseases). There may be information in the database, however, which predicts missingness and which could satisfy the ‘missing at random’ assumption required for multiple imputation. A study exploring the potential of imputing missing data in THIN found that after multiple imputation, summary statistics of height and weight were comparable with data from nationally representative datasets.24
Second, our analyses suggest that the common practice of assigning BMI status based on the nearest/most recently available record to the index date of interest might lead to misclassification, given that a large number of patients have only substantially outdated BMI records available at any particular time. Strategies to address this include restricting to recent BMI, but this is likely to exclude a large number of patients. We have suggested an alternative strategy based on updating the outdated BMIs by modelling changes in BMI over time, though this is not without drawbacks: the approach requires an assumption that individuals with ≥2 BMI records available (needed to estimate the model for changes over time) are representative of the wider patient population, which may not be the case; it is also a more complex strategy, particularly if performed within a multiple imputation framework to allow for uncertainty in the correction, which could be substantial in studies with smaller sample sizes than considered here. Other imputation strategies could also be considered in certain contexts, such as the 2-fold algorithm, which imputes missing data from longitudinal variables at particular time points by using adjacent data points.30 Ultimately, the pros and cons of various methods, as well as the optimal strategy to use, are likely to depend on the particular study and the characteristics of the study population.
Strengths and limitations
The results presented here are based on a large random sample from CPRD; therefore, we can confidently generalise the findings to the whole CPRD database. Although we cannot assume that these findings will relate to UK routinely collected primary care databases based on other IT systems (CPRD is based on practices using VISION), the underlying processes driving BMI recording are likely to be similar. This study did not look at BMI recordings among children as this would require a different strategy. Completeness among the 16–24 years of age group may be artificially low because weights recorded at age <16 were excluded, so those at the lower end of the age group will not have had as much time to accrue weight recordings. We believe HSE to be the best available comparison for this study; it is a nationally representative, large sample utilising height and weight recordings measured by a trained interviewer and is weighted for non-response.19 ,31 However, there is a degree of missing data in HSE, which is a limitation. In 2010, just over 85% of adults interviewed provided valid height and weight recordings.29 One of the most common reasons for missing BMI was refusal (up to 8% were missing due to refusal),19 which if related to BMI status may bias the estimates of mean BMI in HSE. Our comparisons between CPRD-based and HSE-based BMI statistics focused on the mean (and in the online supplementary appendix, on the proportion classed as obese); these are the principal statistics published in the HSE trend tables, so we were not able to look at a broader range of measures of the BMI distribution that might be of interest to researchers using BMI data in the context of public health. Finally, we have not attempted to quantify or comment on the usefulness of BMI as a measure of adiposity, and researchers using BMI data should consider whether it is the best available measure for their purposes.
Conclusions
Completeness of BMI data in CPRD varies over time and by age and sex. BMI records may become outdated over time and naive use could lead to misclassification of BMI status. We used a 3-year cut-off to define a recent BMI; further research could include a systematic analysis of how long BMI records can be considered ‘up-to-date’, and whether this varies by patient characteristics. The optimal strategy for assigning BMI status to individuals in studies based on CPRD and similar electronic healthcare databases is likely to depend on the specific study population and the research context.
References
Supplementary materials
Supplementary Data
This web only file has been produced by the BMJ Publishing Group from an electronic file supplied by the author(s) and has not been edited for content.
Files in this Data Supplement:
- Data supplement 1 - Online appendix
Footnotes
-
Contributors KB developed the analytical strategy for this paper, processed and analysed the data and wrote the paper. HF was involved in discussing the data processing and analysis of the data, as well as the writing of the paper. LS was involved in discussions of the analytical approach to this study and made comments on the analysis and the writing of the paper. ID was involved in discussions of the analytical approach to this study and made comments on the analysis and the writing of the paper. DL was involved in discussions of the analytical approach to this study and made comments on the analysis and the writing of the paper.
-
Funding This report is independent research arising from a postdoctoral fellowship (for KB) supported by the National Institute for Health Research (PDF-2011-04-007). ID is supported by an MRC methodology research fellowship. LS is supported by a Wellcome Trust senior research fellowship in clinical science.
-
Competing interests None.
-
Ethics approval The study was approved by the London School of Hygiene and Tropical Medicine Ethics Committee. MHRA Independent Scientific Advisory Committee.
-
Provenance and peer review Not commissioned; externally peer reviewed.
-
Data sharing statement This analysis is based on a large random sample from the Clinical Practice Research Datalink, provided by the UK Medicines and Healthcare products Regulatory Agency. The authors' licence for using these data does not allow sharing of raw data with third parties.