Article Text

Abstract
Objectives: Based on observed numbers of incident mesotheliomas since 1972, to predict future numbers in men in New South Wales.
Methods: The incidence of mesothelioma was modelled in two ways. First by using an age/birth cohort model, and second by using a model based on potential exposure to asbestos in terms of age and calendar year. The latter model included a term for clearance of asbestos fibres from the lungs, and a term for diagnostic fraction. The age and calendar year model was based on the model introduced by Hodgson and colleagues but replaced piecewise effects by smooth functions represented by cubic splines.
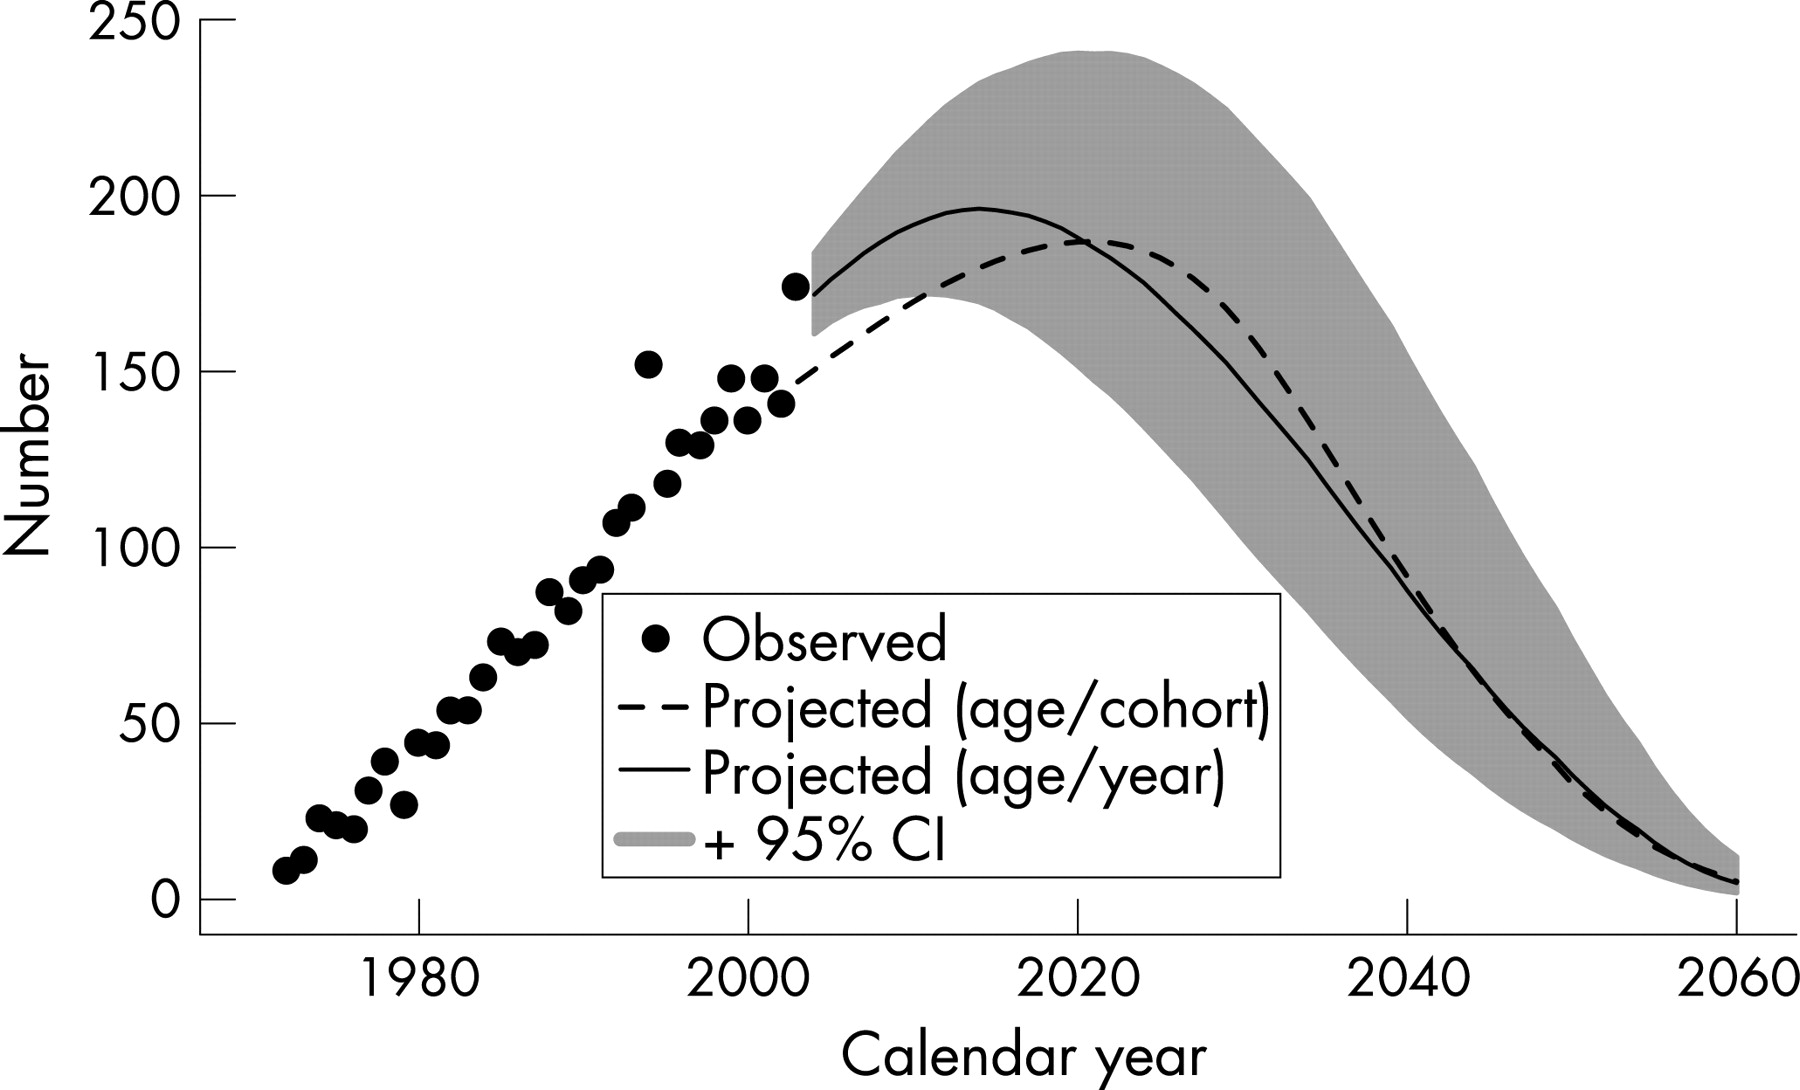
Results: The number of mesotheliomas between 2004 and 2060 was predicted as 6690 with the age-cohort model and as 6779 by the age and calendar year model, with peak annual numbers of 187 in the year 2021 and 196 in the year 2014 with the two models respectively.
Conclusions: The pattern of parameter estimates in the two models was in accord with the known use of amphibole asbestos in Australia. The predicted peak year of 201421 is 3035 years after the phasing out of amphibole use, and this period is in accord with predictions for the UK and the US; in the latter country the peak was 1015 years earlier corresponding to a marked decline of amphibole use in and following the 1960s.
Statistics from Altmetric.com
The widespread use of asbestos has resulted in an increasing death rate from pleural and peritoneal mesothelioma in industrial countries over the last four or five decades. This toll is still continuing despite the reduction and elimination of the use of asbestos in many countries, because of the long lag time between exposure and the development of mesothelioma. There have been many attempts to predict the future numbers of mesothelioma, both in national populations,17 and in particular exposed groups such as factory workers in London,8 and the former miners and millers at Wittenoom.9 10
In order to do predictions, a model has to be proposed for the observed data; and the values of the estimated parameters in the best fitted model are applied to the estimated population in future years to estimate the numbers of mesotheliomas. A basic feature of most models is that the incidence or death rate of mesothelioma increases as a power of time since exposure. Moreover, the population-level models need to take indirect account of asbestos exposure over time, possibly measuring time using calendar periods or birth cohorts, as direct measures of asbestos exposure are usually unavailable. The most common class of model for mesothelioma projections are the age-cohort models, which predict proportional hazards across different birth cohorts. Unfortunately, there is some evidence that these models do not provide reliable predictions: Segura et al found that predictions by Peto et al overestimated the observed incidence.2 4
The recent paper by Hodgson and colleagues uses a more sophisticated model in which the mesothelioma rate for a combination of birth cohort and age consisted of a sum of an asbestos dose effect multiplied by a power effect for time since exposure, summed over earlier years.6 The asbestos dose effect corresponds to potential asbestos exposure for a given age group in a given year, with the assumption that dose varied independently by calendar period and by age group (the results showed that there was exposure mainly at ages 2050 years). They showed that this model fitted the data better than an age-cohort model. Although the new model formulation was straightforward and predicated on a strong understanding of the epidemiology,11 the model implemented by Hodgson and colleagues was severely over-parameterised; moreover, the model was optimised for individual parameters rather than fitting the model for all parameters. Consequently, Hodgson and colleagues were limited in their ability to report uncertainty for their model parameters or predictions.
In brief, we predicted mesothelioma incidence in males in New South Wales using an age/cohort model and an extension of the Hodgson age/year model. We re-implemented the age/year model using natural splines to parameterise the changes in hypothesised asbestos exposure by time and by age, and fitted the model using maximum likelihood estimation. We also present confidence intervals for the age/year model.
METHODS
The numbers of incident cases of mesothelioma in men were obtained from the New South Wales Central Cancer Registry for each year from 19722002. The month of diagnosis and the year and month of birth was available for each case. Population numbers were available from the Australian Bureau of Statistics for each year. From these data the mesothelioma incidence rates for men born in successive five-year periods from 19059 were derived for five-year age groups.
Age and birth cohort model
The numbers of mesotheliomas were analysed by logistic regression, fitting an age group and birth cohort model in which the logarithm of the rate in each cell of the table was fitted by a constant, one of the age effects, and one of the birth cohort effects. This method is effectively the same as Poisson regression because treating the counts as binomial is very similar to treating them as Poisson when the denominators are large. The age effects were found to be related to age approximately as a power of (age 20 years).
Age and calendar year model
This method was based on the model used by Hodgson et al,6 in which a birth cohorts exposure to asbestos is assumed to be dependent on calendar year, and on the age of the individual in that calendar year. Following Hodgson et al, we assumed: (1) that the mesothelioma rate was proportional to the earlier asbestos dose; (2) that dose was multiplicative by age and time; (3) that the rate was proportional to time from exposure to malignant conversion, with an average latency time from malignant conversion of the cancer to clinical detection, raised to some power, together with an effect due to clearance of asbestos fibres from the lung; and (4) that the observed number of cases followed a Poisson distribution.12 See the Appendix for further details.
This model was fitted later than the age/cohort model and an extra year of data was available so that incidence data for 19722003 were used, with incidence predictions from 2004 and onwards. Data were by single calendar periods and by five-year age groups, for ages 2024 years through to 85 years and over.
For both models, as in Hodgson et al,6 we estimated the future number of cases using the fitted mesothelioma rate estimates multiplied by population projections for New South Wales men by single year of age through to the year 2060, assuming that birth cohorts born from 1970 were at negligible risk of mesothelioma. Series B (medium) population projections were provided by the Australian Bureau of Statistics.13 To calculate population projections for cohorts born before 1970, we assumed: that the age distributions above 85 years of age were similar in Australia and in New South Wales; and that the population pattern from 205160 was flat. In addition, for the age/cohort model we carried out mesothelioma projections using population projections in which the population for 2003 was projected forward, using the NSW life table for 20013, to give estimates of the number of men at risk in each year.
RESULTS
Age and birth cohort model
The total number of cases during 1972 to 2002 was 2461, with an age range of 2297 years. Restricting attention to birth cohorts 19059 to 19704 and age groups 2024 to 9599, there were 2375 mesotheliomas. Early attempts to fit the model to the whole of this dataset proved unsatisfactory with a trend in the fitted exceeding the observed in the oldest age groups of the birth cohorts. This may have been due to a diagnostic trend with a lower proportion of cases being diagnosed in the early years.
To avoid the possibility of an effect due to diagnostic trend, the modelling was restricted to mesotheliomas diagnosed from 19822002. This included 2141 mesotheliomas so that omitting the first 10 years of incidence data only excluded 10 of the mesotheliomas. After allowing for age the fitted incidence effects increased with birth cohort up to 19404 and then started to decline particularly from 19504. There were only three mesotheliomas in the 19604 birth cohort and one in the 19659 birth cohort; there was also one mesothelioma in the 19704 birth-cohort, and this was in a 22-year-old, the youngest case in the whole data. Consequently these effects were not accurately estimated. The age effects increased up to the 8084 year age group but there was little change for older ages. Therefore the age effect was taken as constant for ages 80 years and older, equal to the fitted value at age 82 years. The age relationship was then (age 20)3.57. The birth cohort effect and the age effect are shown in figure 1. Using population projections from the Australian Bureau of Statistics, this gave a predicted future number for 200460 of 6690, with a peak annual incidence of 187 in 2021. The projections, together with the observed numbers to 2002, are shown in figure 2. As a sensitivity analysis, we calculated projected numbers using population projections based on current mortality rates (see fig 2). This approach gave a considerably lower estimate of the predicted number of total cases for 200460, with 5641 cases (that is, a 16 decrease compared with the Australian Bureau of Statistics population projections).


Age and calendar year model
For the period 19722003, there were 2639 incident cases of mesothelioma among males aged 20 years and over. For the period 200460, using population projections for NSW and assuming no risk for birth cohorts born from 1970 after the 2003 calendar year, we predicted 6779 incident cases, with a peak of 196 cases in 2014. This model had a residual deviance of 409.6 with 443 residual degrees of freedom, suggesting a good fit to the data. The rate function (u)k0.5(u)/H for power k3.5, lag time 5 years and with lung clearance of asbestos (H15 years) is low for time u since exposure, being less than 20 years, and then rises in an approximately linear manner through to 50 years.
The dose potential by age, which is fixed at 1 for age 50 years, suggests low rates in children, with a rise in dose through to age 40 years, at approximately twice the dose compared with age 50 years, with a subsequent decline in dose at older ages (see fig 3). The dose potential by calendar period, which is fixed at 1 for 1970, suggests a rapid rise in dose through the 1940s and 1950s, peaking in the early 1960s, with a rapid decline during the late 1970s and the 1980s, to low and uncertain levels of exposure by the year 2000 (see fig 3).

Predictions for the age and calendar year model for the future number of mesothelioma cases are shown in figure 4 (heavy line). The confidence intervals from the bootstrap suggest some uncertainty in the total number of cases that will be observed out in time, where the total number of cases for 200460 has a 95 CI of 5243 to 9431. Moreover, the peak number of annual cases has a 95 CI from 172 cases in the year 2011 through to 240 cases in the year 2020. As a sensitivity analysis, we refitted the model, restricting the observed cases to 19722002 and projecting from 2003. We found that the general pattern for the mean prediction was very similar to that for fitting data for 19722003 and projecting from 2004; the restricted model fit predicted slightly fewer cases for 200460, with 6319 cases (that is, a 7 decrease compared with the model fitted to data for 19722003).
DISCUSSION
The predictions using the two methods are shown in figure 4. The age and calendar year model predicted 6779 cases for the period 200460which is only 1 higher than the total predicted by the age/cohort model (6690 cases). The predicted pattern of annual counts varies between the two models, where the age/year model peaks earlier and at a higher level than the age/cohort model. The age/year model was based on an extra year of data for 2003, and in this year the observed number of mesotheliomas was high (n174) compared with an average of 141 between 2000 and 2002. From a sensitivity analysis for the age/year model, we found that the inclusion of data for 2003 increased the total predicted number of cases for 200460 by only 7.
There are some problems with the use of a birth-cohort and age effects model. One is that it is assumed that the two effects are independent. That is, the mesothelioma rate for a birth cohort/age combination is the product of a birth cohort effect and an age effect. Assuming that most mesotheliomas are caused by occupational asbestos exposure, then for the more recent birth cohorts, the observed rates through age groups younger than 50 years have occurred as a result not just of increasing age but also as a result of increasing cumulative exposure. This would amount to an interaction between birth cohort and age which has not been taken into account. A second problem is that it is assumed that the age effect, as a power of (age 20) up to 8084 years, applies for all birth cohorts. For the more recent birth cohorts, who could only have been exposed during the early years of their working life, it may be questioned whether the increase in mesothelioma rate with age will continue to age 80 years or whether the flattening off will occur at younger ages. In the latter event then the predicted numbers in more remote future years, say after 2025, would be less than given. This disadvantage could be overcome by incorporating a term representing clearance of fibres from the lung over time but it was not possible to do this with the age/cohort model because the time of asbestos exposure is unspecified.
The age/year model overcomes the above problems. The model is specified in terms of potential exposure effects for both age and calendar year, and so the consequent interactions between age and birth cohort are built in. Furthermore, because the period of exposure is specified, a term representing clearance of fibres from the lungs can be included.
There is a close relation between the age/cohort model and the age/year model: the age/cohort model is an age/year model with exposure restricted to a specific age, hence the calendar dose function D(t) is effectively a function of birth cohort. The age/year model relaxes this restriction by allowing asbestos exposure throughout life, which will allow for more realistic predictions following the decline in asbestos exposure in the last quarter of the 20th century. We would expect the age/cohort model to perform well if asbestos exposure was mainly in young men, and then the age/cohort model would be roughly equivalent to the age/year model. However, our empirical estimates of the dose potentials from the age/year model are consistent with other evidence that there was exposure to asbestos across the working life.
The age/year model can be viewed as a re-implementation of the mesothelioma model by Hodgson et al.6 Minor variations from the model formulation by Hodgson et al6 included: (a) the clearance time for asbestos included a lag, as suggested by Berry;14 (b) for incidence data, the latency period was assumed to be five years, rather than 10 years; (c) the rate function was defined using an integral form, rather than a discrete summation, in order to improve accuracy; and (d) the dose response functions were assumed to be spline functions. Our implementation allowed for joint estimation of all five model parameters and bootstrap estimation of the predictions. The implementation by Hodgson et al included at least 14 model parameters,6 with unusual patterns for the relative exposure potential for age groups and for the change in exposure index relative to a peak year. Moreover, their implementation estimated the diagnostic trend and the power of time since first exposure. We argue that these parameters are not jointly identifiable and that a more parsimonious model is required. We chose to fix the rate of lung clearance6 and fix the power of time since first exposure, based on data from an Australian cohort study.14
As a further potential limitation, we have assumed that birth cohorts born from 1970 are at negligible risk of mesothelioma. There is currently little information on the mesothelioma rate in those born after 1970 but mesotheliomas could occur in this group as a result of exposure to amphibole asbestos during demolition or maintenance after the new use of amphibole was phased out in the 1980s. Also there was some use of chrysotile asbestos until 2003, and not all mesotheliomas are caused by asbestos exposure. Hodgson and colleagues assumed that the number of mesotheliomas would decline to 2 of the peak year;6 we did not follow this assumption, so that our predictions may be biased as low, and the actual number of cases in the future may be, on average, marginally higher than we predict. However, the magnitude of the level of uncertainty relating to our middle predictions is probably considerably more than this potential bias.
Relation of fitted models to amphibole asbestos use
Under the assumption that most mesotheliomas are caused by occupational asbestos exposure, and that amphibole asbestos is responsible for the majority, then the figures on asbestos consumption in Australia are relevant. Leigh and Driscoll gave data on asbestos production, asbestos imports and asbestos exports.7 Unfortunately the asbestos exports could not be broken down by asbestos type and between 1950 and 1969 the exports could have included both crocidolite and chrysotile. Under the assumptions that none of the small production of amosite was exported, and that no imported asbestos was later exported, a range of possible crocidolite exports was calculated, and hence a range of total amphibole use in Australia (table 1). The ranges of amphibole use were relatively narrow. Some mesotheliomas in Australia are in former miners and millers at Wittenoom and were caused by crocidolite that was subsequently exported, but less than 0.5 of mesotheliomas in New South Wales are in former Wittenoom workers and residents (Alison Reid, personal communication).
The major use of amphibole asbestos was in the three decades from 1950 to 1979, and the net amphibole use shown in the last column of table 1 shows a similar pattern to the dose potential by calendar period (fig 4) in the age/period model. Since there were no new uses of crocidolite after 1970 and amosite was phased out during the early 1980s, then occupational exposure to amphibole asbestos, except for exposure during demolition or repair work, would not have occurred in those born after 1970. The major amphibole consumption in 195079 corresponds to occupational exposure, particularly to birth cohorts from 1920 (who could have been exposed during this time when aged 3060 years) to 1950 (who could have been exposed when aged 1530 years). Those born earlier would be expected to have experienced less exposure because they would have been 35 years or older during the period of peak use, and those born later could not have been exposed much after age 25 years. This pattern is similar to the birth cohort effects in figure 1.
Importance of including knowledge on asbestos use
In making projections on future numbers of mesotheliomas it is important to incorporate knowledge of asbestos use into the modelling, and to model the time relation of mesothelioma incidence with increasing time since exposure as accurately as possible. The update of predictions of mortality from pleural mesothelioma in the Netherlands gave the peak number and the total during 200028 as only a little more than half of the figures predicted only four years earlier.2 4 This marked change in prediction occurred because of five extra years of data but also the known decrease in asbestos use after 1984 and a ban in 1993 were taken into account in the later modelling.
For the former workers at the Wittenoom crocidolite mine and mill in Western Australia predictions were made up to 2020 based on observed numbers up to 1986.9 10 Models of the mesothelioma death rate used included an increase in rate as a power of time since exposure, moderated by a factor representing elimination of crocidolite fibres over time since exposure, with rates of elimination from zero to 15 per year consideredassuming no elimination predicted more than twice as many mesotheliomas by 2020 than an elimination rate of 15 per year.10 The number of mesotheliomas that occurred in 19872000 was compared with these earlier predictions and found to be similar to predictions, based on observed numbers up to 1986, when an elimination model was used, whereas failure to allow for elimination gave a much higher prediction than was observed.15 This result provides evidence that models of mesothelioma incidence that take account of a gradual elimination of crocidolite from the lungs after exposure are more realistic. There is strong evidence from other sources that such elimination does occur and that for crocidolite the rate of elimination is in the range of 1015 a year.14 The rate of clearance depends on asbestos type, being more rapid for chrysotile than amphibole asbestos. There is also evidence that fibre length is important. Longer chrysotile fibres (>10 m) are cleared more slowly than the shorter fibres.16 17
Projections of the number of mesotheliomas in factory workers in London from 1972 were made based on observed numbers to 1972,8 and later compared with observed numbers for the period 197380.18 In this period 40 mesotheliomas were observed compared with predictions in the range of 4559. No allowance for clearance of fibres from the lungs had been made in the predictions.
Peto et al fitted an age-cohort model for mesothelioma mortality in Britain from 196891 and projected a peak in men in about 2020 of between 2700 and 3300.1 The later projection of Hodgson et al using mesothelioma mortality to 2001 and an age and calendar year model predicted a peak of between 1950 and 2450 deaths in males between 2011 and 2015.6 Price fitted an age-cohort model to incidence data from the Surveillance, Epidemiology, and End Results (SEER) programme in the USA for 197392 and predicted a peak incidence in men of about 2300 before 2000.3 Using 19732000 incidence data it was noted that the peak was approximately 2000.5 A direct comparison between the two reports was noted to be not meaningful because of changes in the SEER data, but when the earlier modelling was repeated with the revised database it was found that predictions based on using only the data to 1992 gave higher predictions than using all the data up to 2000.5
Weill et al noted that the usage of amphibole asbestos in the US reached its peak in the 1960s and that the differing pattern of mesothelioma incidence, with a later peak in Europe, may be related to a later amphibole use, particularly crocidolite.19 In Australia, new uses of crocidolite were phased out by 1970 and of amosite not until 1983. Consequently the peak time for mesothelioma incidence may be expected to be about 15 years later than in the USA and the predictions in this paper are consistent with that. In the UK the use of amphibole asbestos was phased out towards the end of the 1970s,1 6 and the predicted peak between 2011 and 2015 is also in line with our predictions. For the US, UK and Australia the peak time of mesothelioma incidence or mortality is about 35 years after discontinuation of amphibole asbestos.
All predictions depend on an assumed relation between incidence and time since exposure. Epidemiological data have shown that this relation is time to a power of about 3.5, and more recently the importance of moderating the increase by the inclusion of a term representing gradual clearance of amphibole asbestos from the lungs has been recognised. Nevertheless the relation after long periods since the cessation of exposure is not well determined, and is a source of uncertainty in the predictions.
Acknowledgments
Mark Clements is supported by the Health Evaluation and Research Outcomes Network, which is funded by the Australian National Health and Medical Research Council. The study was funded by a grant from the Workers Compensation Dust Diseases Board of NSW Research Grant Scheme. We thank the reviewers for their thoughtful comments.
Appendix
Age and calendar year model
Following Hodgson et al,6 we assumed: (1) that the mesothelioma rate for a cohort aged a at time t exposed to asbestos at time u in the past was proportional to the earlier asbestos dose (that is, rate(a,t|u) was proportional to dose(a-u,t-u)); (2) that dose was multiplicative by age and time, that is, dose(a,t) was proportional to W(a)D(t), for dose potentials by age (W) and by time (D); (3) that the rate was proportional to time from exposure to malignant conversion raised to some power k together with an effect due to clearance of asbestos fibres from the lung, where the half-life is represented by H and is the average latency time from malignant conversion of the cancer to clinical detection; and (4) that the observed number of cases followed a Poisson distribution with mean at.12 To model the mesothelioma rate, we averaged the rates across all of the times since exposure from to a. The predicted number of cases at was calculated by weighting the mesothelioma rate by the person-years at risk estimated by the population (Pat) and scaled by the fraction of correctly diagnosed cases at year t (Dx(t)). Taking as a constant, the Poisson regression model was:

We modelled the rates for the mid-point of the five-year age intervals (for example, for ages 4044 years, a42.5). The mean rate at was numerical integrated using Simpsons rule, with functional evaluations at single-year increments for u0.5 to ua.20 The dose potential functions W(a) and D(t) were specified as exponentials of natural splines with one internal knot and two parameters to be estimated.21 For W(a), the spline functions were defined for boundary knots at ages 20 and 65 years and W(a) was defined to be 1 at age 50 years; for D(t), the spline functions were defined with boundary knots at 1945 and 1980 and D(t) was defined to be 1 in 1970; internal knots were assumed to be at the mid-point between the boundary knots.
The five parameters to be estimated included the log of the constant and four parameters for the spline functions log(W) and log(D). We assumed that k was fixed at 3.5. The asbestos half-life H was given a value of 15 years. For incidence data, the latency period was assumed to be 5 years. As in Model 1 of Hodgson et al,6 the diagnosis fraction Dx(t) was assumed to be almost complete (98) in 1997, with a 5 annual percentage trend in the missing cases, such that Dx(t)10.021.051997-t.
The models were fitted using the mle() function in the R statistical package,22 which uses a quasi-Newton approach to maximise the Poisson log-likelihood. The design matrices for the spline functions were calculated using the ns() function in R. We assessed goodness of fit by performing a likelihood ratio test using the residual deviance with the residual degrees of freedom. For interval estimation for predictions, we used the bootstrap, re-sampling from Pearsons residuals.23 Following Friedl, we standardised the residuals by dividing by the square root of (1model degrees of freedom/number of observations) and scaled the residuals to have zero mean.24
Main messages
-
Future male mesothelioma incidence in New South Wales was predicted using an age/birth cohort model and a model based on potential exposure to asbestos in terms of age and calendar year.
-
The age and calendar year model used natural splines to represent potential exposure to asbestos. The pattern for the estimated potential exposures was in accord with the known use of amphibole asbestos in Australia.
-
The two models predicted similar total numbers of cases through to 2060, although the age and calendar year model predicted an earlier peak in 2014.
Policy implication
-
The age and calendar year model can predict future mesothelioma incidence to (a) plan health services and (b) potentially contribute to the process of estimating public and product liability.
REFERENCES
Footnotes
-
Competing interests: None declared.