Article Text

Abstract
Aims: To develop a health surveillance strategy with the use of diagnostic and prognostic prediction models to detect and predict occupational allergic diseases efficiently.
Methods: Data from laboratory animal workers (n = 351) participating in an ongoing cohort study were used to develop diagnostic and prognostic models with logistic regression analyses. A diagnostic model was developed from questionnaire items, and exposure measurements to find predictors for the estimation of the probability of sensitisation to workplace allergens. With the resulting questionnaire model workers were divided into subgroups (high/low probability). A prognostic model was established in workers initially low sensitised using follow up data over a 2–3 year period. The accuracy of the models was evaluated by the concordance (c) statistic, and by comparison of the predicted and observed prevalence.
Results: A diagnostic rule, containing five questionnaire items, identified workers with a high risk of sensitisation. These workers showed high rates of work related asthma, allergic symptoms, doctor’s visit, and absenteeism. A prognostic rule based on four questionnaire items predicted workers at high risk of near future sensitisation with high rates of future (allergic) respiratory symptoms, and asthmatic attacks.
Conclusion: The risk of (future) sensitisation and the severity of laboratory animal allergy can be predicted accurately with diagnostic and prognostic prediction models based on questionnaire items. Workers with an increased risk of future sensitisation also showed serious allergic symptoms at follow up. Workers with a low risk have a low risk of becoming diseased in the future.
- HMW, high molecular weight
- LAA, laboratory animal allergens
- RUA, rat urinary aeroallergen
- MUA, mouse urinary aeroallergen
- SPT, skin prick test
- ROC, receiver operator characteristic
- AHR, airways hyperresponsiveness
- CI, confidence interval
- health surveillance
- questionnaire
- prediction models
- occupational allergy
- laboratory animals
Statistics from Altmetric.com
- HMW, high molecular weight
- LAA, laboratory animal allergens
- RUA, rat urinary aeroallergen
- MUA, mouse urinary aeroallergen
- SPT, skin prick test
- ROC, receiver operator characteristic
- AHR, airways hyperresponsiveness
- CI, confidence interval
In the Netherlands employers are legally bound to monitor the health status of about 4600 laboratory animal workers. However, for exposure to high molecular weight (HMW) aeroallergens no safe health based exposure limits have been identified.1,2 Consequently, investigation of all exposed workers is needed for early detection of allergic diseases and to find workers at risk of developing occupational allergy. For HMW allergens most studies have shown a strong correlation between work related sensitisation and occupational allergy.3,4 Investigating all workers by skin prick testing (SPT) or IgE serology will result in unnecessary high expenses, since about 75% of workers are expected to be negative based on cross prevalence studies. Therefore, a simple diagnostic strategy is needed to identify workers at risk of being or becoming sensitised to occupational HMW allergens. In clinical medicine prediction models are increasingly important. The models intend to assist clinical decision making. Prediction models combine personal characteristics to estimate the probability of having a certain disease (diagnosis) or the probability that a disease will occur in time (prognosis).5 In occupational medicine these approaches have not yet been developed to detect occupational diseases early for preventive purposes. The principle aim of this study is the development of diagnostic and prognostic prediction models, in order to detect and predict occupational allergic diseases efficiently. Data from simple and commonly used questionnaires, exposure measurements, and laboratory tests are analysed to find important determinants for the estimation of the probability of the presence or occurrence of sensitisation in workers exposed to HMW allergens. This strategy may provide a more rational basis for diagnostic and prognostic decisions and may improve quality and cost effectiveness of occupational medical care in these workers.
METHODS
Study design and population
To develop a prognostic model to predict workers at risk of becoming sensitised we used data from employees participating in an ongoing cohort study among Dutch laboratory animal workers, investigating exposure-response relations This study was carried out between June 1992 and June 1995 in laboratory animal facilities of four universities, two research institutes, and a pharmaceutical company, bridging a period of about three years. Workers were investigated in three periods. From 750 eligible subjects, 586 subjects (78%) participated in the first investigating period. From these workers, 115 (20%) subjects did not participate during follow up and 47 (8%) subjects showed invalid data. Ninety three workers joined the study in the second and third investigation period. From 424 subjects (72%) participating in all three investigation periods, 53 workers reported not to be exposed to laboratory animals. From 20 (5.4%) workers no skin prick test (SPT) results were available during follow up, leaving 351 workers for the analysis to predict future sensitisation. Initially, a diagnostic model was developed to estimate the probability of being sensitised according to a method described in a previous study.6 The resulting algorithm containing five questionnaire items was used for splitting the study population into a group with a high prevalence risk of sensitisation and into a group with a low prevalence risk of sensitisation. In individuals with an initially low risk a prognostic model was developed to predict sensitisation during follow up.
Main messages
-
Prediction models which combine personal characteristics to estimate the probability of having a certain disease (diagnosis) or the probability that a disease will occur in time (prognosis) can easily and efficiently be applied in laboratory animal workers to assist in medical decision making by occupational physicians.
-
Workers diagnosed with a high sensitisation risk showed more relatively severe allergic diseases. Beside work related allergic symptoms, high rates of absenteeism, doctor’s visit, and lung function loss were found compared to workers with a low risk.
-
Workers with an increased risk for future sensitisation developed serious allergic and respiratory symptoms at follow up. Workers with a low sensitisation risk have a low risk of becoming diseased in the future.
Questionnaire
All participants completed a questionnaire in each survey period. This self administered questionnaire was based on a Dutch version of an internationally accepted respiratory questionnaire, which has been used previously in other studies on occupational respiratory diseases in the Netherlands.7 The questionnaire included questions on age, gender, respiratory symptoms, personal and family history of allergic symptoms, hyperresponsiveness, and smoking history. Additional questions were asked about absence due to illness, medication use, employment history, intensity of contact with laboratory animals, and allergic symptoms due to working with laboratory animals during working hours, after finishing work, and over the last year.8 Persons were considered to have work related symptoms if they experienced chest tightness, running nose or sneezing, running or itching eyes, and itching skin during contact with laboratory animals. Subjects were considered to have a history of allergy if they reported at least one eye, nasal, or respiratory symptom to common allergens such as house dust, domestic animals, food, or pollen. Symptoms suggesting airways hyperresponsiveness (AHR) were defined as experiencing breathing problems after exposure to changes in temperature, fog, gasses and fumes, (tobacco) smoke, and cooking smells.
Never-smokers were individuals who had never smoked or smoked less than a total of 10 packs during their lifetime. Ex-smokers were individuals who stopped more than a year ago, and current smokers were defined as those who smoked more than one cigarette a day for at least one year.
Tests for sensitisation
Five common aeroallergens (house dust mites, grass pollen, tree pollen, cat fur, and dog fur), six occupational allergens (rat urine, mouse urine, rat fur, mouse fur, guinea pig fur, and rabbit fur), and positive and negative controls were used for skin prick testing (SPT). Allergen preparations were produced by ALK Benelux, Houten. A weal diameter of 3 mm or more was regarded a positive response, after subtraction of any response to the negative control.
IgE against five common allergens (house dust mite, grass pollen, birch pollen, cat fur, and dog fur) were measured with a sandwich enzyme immunoassay developed in-house and described previously.9 An OD492 exceeding the OD + 0.05 of the reagent blank (no serum control) was interpreted as a positive reaction. Total IgE was measured by a sandwich enzyme immunoassay and regarded as positive above 100 kU/l.
Policy implications
-
Health surveillance strategies to prevent occupational allergic diseases can reliably and efficiently be improved by investigating the total population at risk with prediction models based on important determinants from a questionnaire in order to estimate the probability of the presence or occurrence of a certain well defined outcome.
Definition of the outcome
Sensitisation to laboratory animal allergens was defined as a positive SPT response to one of the laboratory animals (rat, mouse, guinea pig, and rabbit). The results of the SPT in the third period were used to define the outcome, despite the fact that they may be different from the results in the second period. In 21 workers sensitisation changed from sensitised in the second period to not sensitised in the third period. If there were no SPT results in the third period, the results of the second period were used.
Spirometry
Lung function measurements were performed in every worker participating in all survey periods, according to the lung function protocol of the European Community for Steel and Coal.10 To compare the actual to the reference lung function, we used standardised residuals [standardised residual = (observed − predicted) / residual standard deviation]. The association of lung function with sensitisation and exposure is described in a study by Portengen et al.11 In our study the results of lung function tests are only used to evaluate the results of the diagnostic model.
Exposure
Full shift inhalable dust was sampled using IOM sampling heads (IOM, Edinburgh, UK) with Millipore filters. Earlier analyses showed that the exposure could best be described by the average rat urine allergen (RUA) exposure (in ng EQ/m3) multiplied by the time each individual had worked with conscious rats (hours/day). Average RUA levels were calculated by job title and work area (or facility) as reported elsewhere.12 Exposure levels of rat and mouse aeroallergens from workers in the follow up period were not available.
Data analysis
Diagnostic and prognostic models were developed according to methods described for clinical decision making.13 With multivariable regression analysis the relation between two or more covariables and the outcome variable was estimated. We specified our model by selecting variables with backward stepwise methods starting from a full model. The full model contained all covariables from the questionnaire and laboratory results with p values <0.50, arguing that these probably contribute more univariable predictive information than noise. In our evaluation we applied stepwise selection with backward elimination of predictors using α = 0.157. Setting α to 0.157 corresponds to using Akaike’s information criterion for selection, since all covariables had one degree of freedom.14 To translate the model into a scoring rule, the scores are directly derived by dividing the regression coefficient (β) of each determinant by the smallest regression coefficient and rounded to the nearest (half) integer in order to weigh the relative strength of each predictor variable. The sum of the scores is the sumscore for each subject and was used to split the population into a group of workers with a high and a low risk of sensitisation at baseline. In the latter group a prognostic model was developed to predict future sensitisation.
The prognostic model was constructed in the same way as the diagnostic model. We first included potential prognostic determinants from the questionnaire and exposure data, to identify a subset of independent predictors of future sensitisation (questionnaire model). Subsequently, results from serological examinations (total IgE >100 kU/l and specific IgE to common allergens) were added to the questionnaire model (IgE model). In the third model (SPT model) the serological results were withdrawn in favour of variables derived from SPTs to common allergens in order to identify the model with the highest added value of more or less equivalent diagnostic tests. The Hosmer and Lemeshow χ2 test was used as a goodness-of-fit test by comparing the observed and expected results in 10 groups of workers according to deciles of predicted risk. The accuracy of the logistic models in discriminating sensitised and non-sensitised workers, was evaluated by calculating the areas under a receiver operating characteristic (ROC) curve, taking into account the correlation between the models as they were based on the same cases.15 An area under the curve with a value over 0.8 can be interpreted as reflecting good discriminative power.16 For every case, the predicted probability of future sensitisation was estimated on the basis of the coefficients of the predictors in the final model. The mean predicted probability and the observed incidence of sensitisation were estimated, and stratified according to different risk groups. All analyses were performed using SPSS 11.0 for Windows (Statistical Products and Service Solutions, Inc., Chicago).
RESULTS
The diagnostic model, derived from questionnaire items, included, gender, wheeze, allergic symptoms during work, allergic symptoms during last year, and working for more than 20 hours/week with rats as independent predictors for the outcome (sensitisation). The area under the receiver operator characteristic (ROC) curve (AUC) was 0.76 (95% CI 0.71 to 0.82), indicating reasonable performance. The scoring rule to divide the population into high and low probability of being sensitised led to the following formula (see appendix):

For example, a male worker with symptoms of wheeze, work related shortness of breath and rhinitis, and working for 30 hours/week with rats has a total score of 7 (1 + 1.5 + 2.5 + 2) points. As shown in fig 1, this score corresponds to a predicted probability of ±80% of being sensitised to laboratory animal allergens. Using the scoring rule with the five determinants from the questionnaire, sumscores for individual workers could be calculated and used to separate the population into high and low risk categories. For this purpose, a cut-off sumscore of ⩾4.5 points was arbitrarily chosen in order to reduce false positive results. This score corresponds to a specificity of 94%. The results of the stratification into high and low probability groups are presented in table 1 and show a good correlation between the observed and predicted sensitisation rate at baseline. Compared to the low score group, workers with a high probability of sensitisation at baseline showed high rates of work related allergic symptoms (43–79%), absenteeism (11%), doctor’s visit (21%), and lung function loss (11%) (table 2). Workers incorrectly classified as sensitised (27%) in the high probability group showed somewhat lower but still high prevalences of these features. Workers incorrectly classified as not sensitised (17%) in the low probability group showed low rates of rhinitis (14%), skin symptoms (12%), and allergic symptoms after work (12%), but somewhat higher than workers correctly classified as not sensitised.
In workers with an initial low sensitisation probability (80% of the original population) a prognostic model was developed to predict sensitisation after ±3 years. Table 3 shows the three prognostic models developed in our study. We first studied the regression coefficients in the full questionnaire model. After stepwise backward selection, less than four years of employment, symptoms suggesting atopy, work related allergic symptoms, and working ⩾12 h/week with rats were identified as significant independent predictors of laboratory animal sensitisation (the questionnaire model). Hours per week working with rats was shown to be a good proxy for cumulative exposure to rat urine allergens (RUA). The model χ2 did not change significantly compared to the model including cumulative exposure. Predictors from additional tests (IgE serology, and SPTs to common allergens) were added to the questionnaire model in order to obtain two different models. Total IgE ⩾100 kU/l, and positive IgE to non-animal common allergens were identified as determinants when added to the questionnaire predictors (IgE model). Positive SPTs to non-animal common allergens were selected as determinants in addition to the questionnaire determinants when SPT results were added (SPT model).
The questionnaire model discriminated sensitised and non-sensitised workers with an AUC of 0.73 (95% CI 0.65 to 0.82).The IgE model showed similar performance (AUC 0.81; 95% CI 0.73 to 0.89) as the SPT model (AUC 0.78; 95% CI 0.70 to 0.86). The Hosmer and Lemeshow goodness-of-fit test indicated a good fit (p = 0.71). Based on the questionnaire model, a sumscore was calculated for each individual worker using the following scoring rule (see appendix):

Using the questionnaire model as a single test, laboratory animal workers may be divided into groups with a high and with a low risk of becoming sensitised. A cut-off sumscore of ⩾2.5 points was chosen because the mean predicted probability of future sensitisation was higher (24%) than the observed sensitisation rate at follow up (12%) in the total low risk group (table 4). At this point the positive likelihood ratio (LR) is 2.3 [LR+ = sensitivity/(1 – specificity) = 0.71/(1–0.69)] indicating that in workers with a sumscore ⩾2.5 the mean sensitisation risk of 12% increases to 24% (Bayes’ rule). The negative LR is 0.42 [LR- = (1 – sensitivity)/specificity = (1–0.71)/0.69], indicating that in workers with a sumscore ⩽2.5 the mean sensitisation risk of 12% decreases to 5% (Bayes’ rule). Workers at high risk of near future sensitisation showed, after three years follow up, significantly higher rates of asthmatic attacks (10%), respiratory symptoms (21%), allergic symptoms during last year (17%), total IgE >100 kU/l (30%), and symptoms suggesting bronchial hyperreactivity (28%) compared to workers at low risk (data not shown). Additional IgE serology (total IgE ⩾100 kU/l and/or positive IgE to non-animal common allergens) improved the prognostic accuracy in the low risk group to 78% (compared to 69% with only questionnaire results). In the high risk group the prognostic accuracy did not change by applying additional IgE serology (66%). However, in case of positive IgE serology the predicted sensitisation risk changed from 24% to 37% (observed 39%).
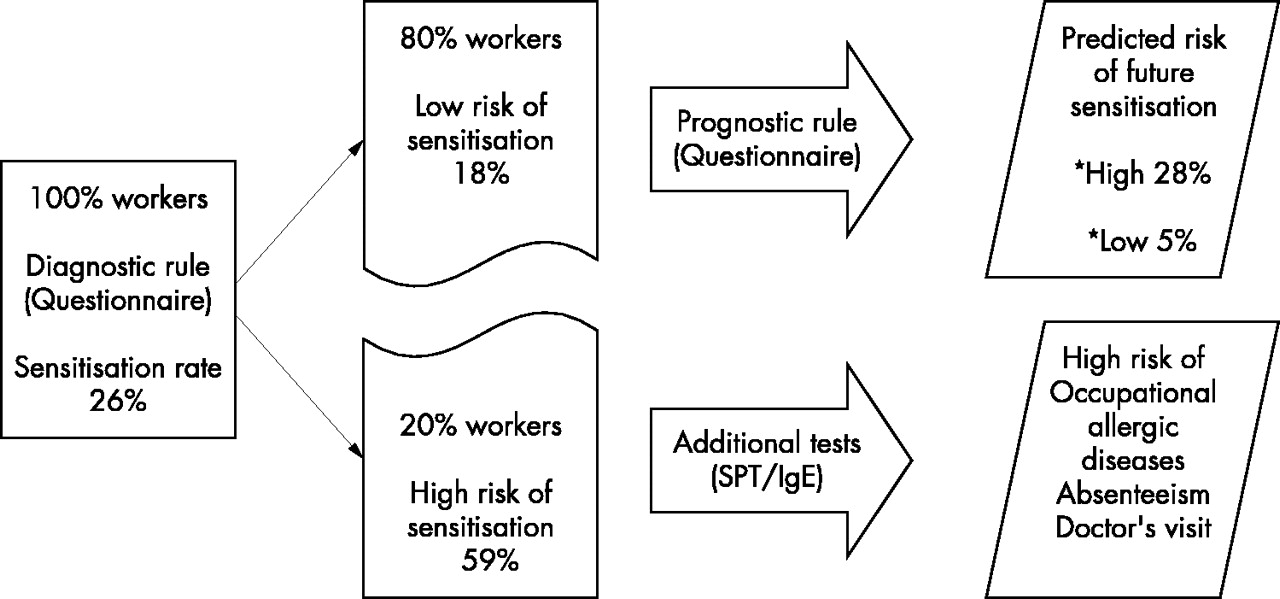
In fig 2 the results of the stepwise approach are summarised. The flow chart shows the diagnostic decisions that can be made after applying a questionnaire in a population of laboratory animal workers. By dividing the population with the results of a questionnaire, 20% of the workers showed a high sensitisation rate and a high prevalence of occupational allergic diseases. In 80% of the workers the prognostic model could accurately predict a low risk (5%) of future sensitisation in two thirds of the workers, leaving one third of the workers at high risk (24%). The sensitisation rate was reduced from 18% to 12% at the end of follow up. During the three year follow up period, 10% (25/229) of the workers changed their condition from sensitised in period 1 into non-sensitised in period 3. Seventeen (68%) of them were atopic (positive SPT to non-animal common allergens). Five per cent of newly sensitised workers (11/229) became manifest. Three (27%) of them showed a positive SPT to non-animal common allergens (data not shown).
DISCUSSION
Prevention of occupational allergic diseases requires a practical strategy to be delivered to all workers, whether or not they develop the disease. So far, most of the approaches proposed for diagnosing occupational allergic disease rely on single tests (skin tests or specific IgE in serum) and/or the presence and absence of different allergic symptoms.17–22 Moreover, no agreement exists on what factors should be included for sequential testing. Therefore, a population based approach benefits from the application of decision models in order to diagnose and predict workers at risk of having or developing the disease. In our study we used sensitisation to laboratory animal allergens as the outcome and showed that splitting a population of laboratory animal (LA) workers into a group with a high and a low probability of sensitisation offers an appropriate and practical first diagnostic step (fig 2).
After a simple categorisation on the basis of a scoring rule including five questionnaire items, groups with high (59%) and low (18%) predicted sensitisation probability could be distinguished accurately at baseline. For this purpose, a cut-off sumscore of ⩾4.5 points was arbitrarily chosen in order to minimise false outcomes in the predicted high sensitised group. The accuracy (percentage correctly classified, given a certain cut-off point) was 79%, corresponding to 21% false results. The usefulness of this approach was good by detecting more relatively severe allergic disease cases in the high risk group, whether or not they were correctly classified as sensitised. These workers showed, beside work related allergic symptoms, high rates of absenteeism, doctor’s visit, and lung function loss compared to workers with a low risk. Therefore, additional medical investigations among these workers can focus on the severity of occupational allergic diseases.
The group of workers with an initially low probability of sensitisation will irrevocably include workers misclassified as not sensitised (17%). In a strategy as proposed it is impossible to obtain a group of workers not sensitised at all. However, it is reasonable to expect that in this group, newly sensitised workers will occur when time passes.
The prognostic models we developed to predict future sensitisation were based on three questionnaire items, an exposure proxy, and IgE serology or skin prick test (SPT) results for common allergens. Initially, we were interested in the accuracy of the questionnaire items, when used without laboratory tests, to predict workers at high or low risk of becoming sensitised. The choice of a cut-off value in decision models is often not obvious, and classifying patients falsely as negative or as positive needs to be balanced and depends on purpose and context. By calculating a sumscore for every worker and applying a cut-off point of 2.5 points the population could be divided into a high and low risk group. The cut-off point chosen in the prognostic questionnaire model results in a reasonable sensitivity (71%) but a limited specificity (69%). The accuracy of the model at this cut-off point was 69%, corresponding to 31% false results. It showed that it could not predict all workers newly sensitised. This may partly be explained by changes in sensitisation from sensitised into non-sensitised at follow up. These changes were shown to be associated with high exposure and smoking in atopic workers for which we do not have an explanation. However, for workers with ⩾2.5 points scored from the questionnaire the mean sensitisation risk increases to 24%. In workers categorised below this point the mean sensitisation risk decreases to 5%. For workers in the high risk group the model supports the need for hygienic interventions and consecutive medical examinations. It is however, for the occupational physician to decide which cut-off point to select or combine the medical history with IgE serology for counselling individual workers or specific subgroups.
Combining the medical history with IgE serology for common allergens results in a higher overall prognostic accuracy (78%) in the low risk group. So, if the question is to take account of workers with a very low risk of future sensitisation, negative IgE serology for common allergens predicts a 3% sensitisation risk in this group. If the question is to be informed about the sensitisation risk in the high-risk group, positive IgE serology for common allergens predicts a 37% sensitisation risk in the future. Consequently, additional testing can be performed in the high risk group to improve prognostic accuracy in the individual worker. In the low risk group additional serologic testing provides limited extra information on future sensitisation risk. Therefore, these tests can be withheld and occupational hygiene interventions can concentrate on the high risk group in order to reduce expenses.
Insufficient participation may have led to selection bias, resulting in less accuracy of diagnostic and prognostic models. Workers who did not participate in the follow up period showed a somewhat higher sensitisation rate at baseline. However, because the association with determinants of sensitisation was stronger, the presented diagnostic model would have shown identical determinants, probably with somewhat higher coefficients. The influence on the prognostic model cannot be determined but is likely to be limited. Additionally, selection of workers is consistent with daily medical practice and more reflects the real-life situation in which not all workers will participate in health surveillance programmes. However, external validation of the prognostic model as developed in this study needs to be assessed before this model can be used with confidence in other laboratory animal workers. External validation of the diagnostic model for laboratory animal workers as used in this study to split the population into high and low sensitised workers has been assessed previously.6
It has been argued that sensitisation is not a satisfactory predictor for near future allergic diseases.23,24 However, our approach suggests that by identifying workers at baseline with an increased risk for future sensitisation, simultaneously workers at risk of developing serious allergic and respiratory symptoms are identified. It also shows that workers with a low risk at baseline have a low risk of becoming diseased in the future. In the initially “high sensitised” group, occupational medical examination can concentrate on the presence and severity of laboratory animal allergy and absenteeism. The individual medical assessment can focus on the different allergic entities like rhinitis, conjunctivitis, contact urticaria, and asthma. Asthma is the most important, as those with severe symptoms may be unable to continue their work. In these cases the identification of specific sensitisation to HMW allergens is indicated. In the initially “low sensitised” group, the prognostic questionnaire model offers the occupational physician a method to predict the risk of future sensitisation. The method may help to choose in which (group of) workers medical surveillance and occupational hygiene interventions should be implemented. The usefulness of the model performed rather satisfactorily by identifying, after three years follow up, high rates for asthmatic attacks, respiratory symptoms, total IgE >100 kU/l, and symptoms suggesting AHR in the high risk group.
To conclude, prediction models based on standardised questionnaire items extended with work related questions can be used to detect and predict accurately the risk of sensitisation to HMW workplace allergens and the severity of allergic diseases. A strategy to initially divide the population into a group with high and a low sensitisation probability by applying a diagnostic model can markedly increase the efficiency of medical investigations by occupational professionals. The developed strategy has been shown to be reliable by identifying relatively severe allergic diseases, absenteeism, and doctor’s visit in workers with a high sensitisation probability. Workers with an increased risk of future sensitisation presented serious allergic symptoms at follow up. Workers with a low risk of future sensitisation have a low risk of becoming diseased in the future.
APPENDIX
Table A1 lists significant questions and related scores from a questionnaire containing 38 questions.
Sensitisation probability at baseline after applying the diagnostic rule with questionnaire predictors
Prevalence of doctor’s visit, absenteeism, work related allergic symptoms, and lung function loss in workers correctly and incorrectly classified as sensitised in the high and low risk group
Independent predictors of sensitisation to laboratory animal allergens in three different prognostic models
Performance of the prognostic model in workers with a low probability of sensitisation at baseline. Results of the use of IgE serology in two groups of workers with a low (cut-off <2.5 points) and a high (cut-off ⩾2.5 points) risk of becoming sensitised after three years

Relation between the sumscores and the predicted probability of sensitisation to HMW allergens.

A strategy to detect and predict sensitised workers in a population of laboratory animal workers by applying a diagnostic and prognostic rule based on questionnaire items.
Acknowledgments
We thank Dr EW Steyerberg, Department of Public Health of Erasmus MC, and the Erasmus University Rotterdam, for his critical comments.
REFERENCES
Linked Articles
- Work in brief