Article Text

Abstract
Background: Panel studies have been used to investigate the short term effects of outdoor particulate air pollution across a wide range of environmental settings.
Aims: To systematically review the results of such studies in children, estimate summary measures of effect, and investigate potential sources of heterogeneity.
Methods: Studies were identified by searching electronic databases to June 2002, including those where outcomes and particulate level measurements were made at least daily for ⩾8 weeks, and analysed using an appropriate regression model. Study results were compared using forest plots, and fixed and random effects summary effect estimates obtained. Publication bias was considered using a funnel plot.
Results: Twenty two studies were identified, all except two reporting PM10 (24 hour mean) >50 μg.m−3. Reported effects of PM10 on PEF were widely spread and smaller than those for PM2.5 (fixed effects summary: −0.012 v −0.063 l.min−1 per μg.m−3 rise). A similar pattern was evident for symptoms. Random effects models produced larger estimates. Overall, in between-study comparisons, panels of children with diagnosed asthma or pre-existing respiratory symptoms appeared less affected by PM10 levels than those without, and effect estimates were larger where studies were conducted in higher ozone conditions. Larger PM10 effect estimates were obtained from studies using generalised estimating equations to model autocorrelation and where results were derived by pooling subject specific regression coefficients. A funnel plot of PM10 results for PEF was markedly asymmetrical.
Conclusions: The majority of identified studies indicate an adverse effect of particulate air pollution that is greater for PM2.5 than PM10. However, results show considerable heterogeneity and there is evidence consistent with publication bias, so limited confidence may be placed on summary estimates of effect. The possibility of interaction between particle and ozone effects merits further investigation, as does variability due to analytical differences that alter the interpretation of final estimates.
- particulate air pollution
- panel study
- childhood asthma
- FE, fixed effects
- GEE, generalised estimating equations
- OR, odds ratio
- PEF, peak expiratory flow
- PSA, particulate strong acidity
- RE, random effects
Statistics from Altmetric.com
- FE, fixed effects
- GEE, generalised estimating equations
- OR, odds ratio
- PEF, peak expiratory flow
- PSA, particulate strong acidity
- RE, random effects
The short term effect of particulate air pollutants on the respiratory morbidity of children has been the subject of considerable investigation over the past decade. However, while many epidemiological studies across varied environmental conditions (and hence exposure to different co-pollutants and climatic conditions) have indicated an acute impact of particles on lung function and reported respiratory symptoms,1,2 a recent major collaborative European study failed to show any consistent effects in asthmatic 9 and 10 year olds.3 An accurate measure of the size of any acute particulate effects is important in public health terms. Yet, doubts about the transferability of individual study estimates, and a possible lack of coherence between estimates, has prevented at least one previous attempt at quantifying these effects.4
Epidemiological studies have commonly been of “panel” design, following a cohort prospectively with frequent observations analysed using time series methods.5 Air pollutant levels are expressed as a series of time averaged observations, so that the temporal relation between exposure and outcome is studied.6 The collection of individual level outcome data also means that hypothesis testing can provide strong evidence of associations at that level.7,8 As pollutant exposure is common to all members of the cohort, a traditional “control” group is not needed, each subject acting as his or her own control, and only covariates that vary across time within an individual need be considered by the analysis.6,9
Subjects are followed for a predetermined period during which individuals typically record daily symptom and lung function data (for example, peak expiratory flow, PEF) in a diary. Such studies generally aim to investigate the acute effects of pollutants across a typical range of environmental conditions and may continue for many months. In this way they are distinguished from “event studies”,10 which seek to determine the response to pollution episodes. This distinction may require a judgement based on study duration and environmental conditions, and is necessarily subjective and open to interpretation.
The analysis of panel study data relates pollutant exposure to measures of outcome in regression models that account for time varying confounders and serial correlation in these data.6,9 Regular observations of a continuous physiological measure such as PEF (as absolute values or some metric of individual change) are commonly fitted to linear models, while logistic regression may be preferred for symptom records producing a binary series of observations, either as the simple occurrence of a symptom in an individual (prevalence) or the occurrence of new symptom episodes (incidence).6,8 Two broad analytical approaches are recognised. Either a group average outcome measure is derived for each time point and the resulting time series regressed on the predictors of interest,3,6,9 or the analysis is repeated for each subject with the same model predictors, and the resulting individual effect estimates pooled to derive an overall average effect.10,11 In both cases, an adequate model will consider the effects of trends in the diary data, meteorological indices and autocorrelation, but while additional time varying confounders (for example, individual allergen exposures, frequency of episodes of respiratory tract infection) have been suggested for inclusion,11 their adoption is far from universal. The inclusion of appropriate trend terms and confounders within the model may themselves reduce autocorrelation within the model residuals. However, two statistical approaches have been developed to control remaining effects. In the first, information regarding the prior levels of the outcome are included as a predictor in the final model,10,11 while the second involves the use of generalised estimating equations (GEE) to extend conventional regression models by modelling their covariance structure.9,12 This approach theoretically provides a more robust variance estimate (assuming an adequate sample size1), but assumes no bias in the regression coefficients (effect estimates).
Main messages
-
Panel studies from varied settings report an adverse effect of short term increases in particulate air pollution on children’s respiratory health.
-
The effects of particulate air pollution on PEF appear to be greater for PM2.5 than PM10.
-
Results are very heterogeneous, limiting the confidence that may be placed on summary measures of effect.
-
Effect estimates vary according to the study population, setting, and analytical approach, and appear to be greater in conditions of high ozone and where either generalised estimating equations are used to model autocorrelation, or overall results are obtained by pooling subject specific regression coefficients.
-
There is evidence consistent with publication bias, at least for PM10 and PEF.
This paper aims to review the results of panel studies that have considered the effects of particulate air pollution on the respiratory health of children. We have used systematic methods13–15 that minimise bias by establishing the search strategy, study inclusion and exclusion criteria, assessment of study validity, and methods of data extraction prior to undertaking the review. Where appropriate, summary measures of effect size were also derived. However, meta-analytical methods for observational studies are less well developed than for clinical trials,13 and provide poor summaries of effect where heterogeneity exists between studies, providing apparently very precise, but spurious results.14 In such cases, exploration of factors related to heterogeneity may be of greater interest, and thus we considered aspects of the study populations, environmental conditions encountered, and analytical approaches as sources of variability in this study. In addition, summary effect estimates may be biased if they result from a biased sample of studies in general, for example due to publication bias.14,16 The likelihood of such bias is thought to be related to study size, and so we considered the possibility of publication bias in these terms.
METHODS
For the purposes of this review, the term “panel study” was defined as a prospective cohort study where individual level observations of lung function or respiratory symptoms, as well as air pollutant records, were collected at least daily for not less than eight weeks. Only studies that presented results for children (under 18 years old) and particulate air pollution as PMx (mass concentration of particles less than x μm aerodynamic diameter) derived using an appropriate regression model that controlled for the impact of trend(s), weather (or at least temperature), and autocorrelation, were considered for inclusion. Major bibliographic databases (Medline, Embase, Science Citation Index (Web of Science Interface)—the latter better representing environmental journals) were searched from 1966 (Medline) to June 2002 using a broad strategy consisting of the truncated word terms air pollu$, PM$, partic$ (MESH thesaurus terms and text words) combined (“AND”) with terms for longitudinal study design or the text words “panel” or “cohort”. Results were restricted by age, but further refinement (for example, by outcome) was found to omit known studies. Consequently, this strategy resulted in a very large number of non-relevant “hits”. The search was complemented by inspecting the reference lists of the papers retrieved as well as reviews, hand searching major respiratory, epidemiological and environmental journals from 1996 onwards, and consulting books and reports known to the authors.
Policy implications
-
The degree of heterogeneity evident between panel study results questions the transferability of estimated effect sizes between locations or populations, and limits the use of summary measures in quantitative risk assessment.
-
Further research is required to characterise the sub-population of children most at risk of particulate health effects, the impact of different analytical strategies on estimated effect size, and the possibility of interaction between particulates and ozone.
While checklists for the assessment of study validity are available,17 these concentrate on study design and are not easily applicable where studies are selected on the basis of study type. Therefore all studies that collected and analysed data in a manner consistent with the definition of a panel study offered above were given equal weight. However, information on analytical strategy (outcome measure, statistical methodology and consideration of trends, time varying confounders, and autocorrelation), population and setting were collated in a structured way. Where possible, attempts were made to express results in a uniform manner—that is, health effects were calculated per unit change (μg.m−3) pollutant.
Study results, their relative size, precision, pattern of effects and degree of heterogeneity, were explored visually using forest plots,13,15 which display both the mean and interval effect size for a number of studies simultaneously, also indicating their relative size with a graphical marker (StatsDirect, version 2.2.0, Cambridge, UK). A statistical test of heterogeneity, Q-combinality (based on the χ2 distribution),18 was employed for all studies and groups based on analytical strategy, study setting, and population. However, such tests have relatively poor power to detect deviations from an assumption of homogeneity, and should not be relied on alone.14
Effect estimates for all studies, or subgroups thought to explain heterogeneity in the results, were pooled to provide a weighted mean estimate of effect. The simplest approach employs a weighting relative to the inverse of the variance of each study’s estimate. This approach (precision weighting) may be straightforwardly applied to lung function results. However, techniques for pooling results for dichotomous outcomes from cohort studies are based on the difference in outcome frequencies among exposed and non-exposed individuals, treating each study as a series of weighted 2×2 contingency tables. Such techniques could not be used in this case, and so where symptom results were derived from logistic regression, the loge of the odds ratio (OR) was treated as a continuous outcome and precision weighting applied to studies. This method of pooling results implies a “fixed effects” model (FE)—that is, it assumes that studies are estimating the same underlying average effect, varying only due to random errors.14 Where this assumption did not hold, a “random effects” approach (RE) was also used to derive a pooled estimate. In this case, weights included an additional term representing unexplained sources of between-study heterogeneity14 derived using the model described by DerSimonian and Laird.18 In addition, a funnel plot was used to investigate the possibility of publication bias.16
RESULTS
Setting and study population of included studies
The search identified 22 individual or linked panel studies of children that used daily PM measures of particulates and were analysed according to the inclusion criteria (table 1). Five were summer studies,19–24 while another five were conducted in winter conditions,3,25–28 including the largest study, “Pollution Effects on Asthmatic Children in Europe” (PEACE), a European collaboration involving 14 centres contributing data for both urban and rural panels.3 Eleven of the identified studies were conducted in North America, with nine of the remainder from Europe (four from the Netherlands). In addition, 44 studies were retrieved for detailed review and subsequently rejected. Most of these did not present separate data for children (n = 11), did not measure PM (n = 8), or did neither (n = 18). Other studies were rejected on the basis of recording outcome data less often than daily (n = 2) or for less than five weeks (n = 4), and not presenting the analytical model (n = 1).
Main characteristics of studies identified for inclusion in the review (n = 22); pollutant levels reported as 24 average values unless specified otherwise
Pollutants measured
Fifteen studies reported ozone measurements (including three where levels were undetectable29–31). The majority of those that did not were European studies conducted in winter3,25–28 although studies from Vancouver32 and Bangkok33 also omitted ozone. Sulphur dioxide (SO2) measures were omitted in 10 studies.19,22,29,30,32–37 Measurements of sulphate (SO42−) or particulate strong acidity (PSA) were included in 11 studies (levels were reported as undetectable in the Utah Valley studies)20–22,24–30,38,39 and 12 studies reported either the mass or number concentrations (PNx, analogous to PMx) of more than one particle size fraction.20–22,24,32,33,35,37,39–42
All except two studies35,39 reported daily average PM concentrations in excess of 50 μg.m−3, although in two studies peak levels exceeded this level by 10 μg.m−3 or less.19,34 Ozone levels (8 hour running mean) exceeded 50 ppb (100 μg.m−3) in nine studies; six from North America20–22,34,35,37 and three from elsewhere.19,23,36 In contrast, only four studies reported 24 hour mean SO2 concentrations greater than 47 ppb (125 μg.m−3); three from Europe (including some settings within the PEACE study)3,25,27 and one from the USA.38
Study populations
The age range of subjects typically spanned 6 to 11 years. Older children were included in nine studies; four extending the range to 13 years,19,32,37,40 two to 15 years,27,31 and one to 17 years.34 The majority of studies (15) recruited panels of children either diagnosed with asthma or with reported pre-existing respiratory symptoms (“symptomatic subjects”). In seven studies, both symptomatic and non-symptomatic subjects were recruited, although in only three were the results presented in such a way as to permit a direct comparison of effects.25,30,39 Four studies presented analyses stratified by use of anti-asthma medication3,25,27,31,43–45 and two considered subgroups based on the presence of bronchial hyperreactivity and/or increased serum IgE concentrations.25,36,43
Analytical approach of included studies
A two stage analytical approach was adopted by five studies,19,23,32,34 the remainder employing a population daily average outcome in their analyses. Potential autocorrelation effects were modelled using GEEs in 11 studies; nine originating from North America20,21,29,30,32,34,37,38,40 (of which two utilised a two stage analytical approach) and two from elsewhere.31,36 While all adjusted their regression models for the effects of weather, only 10 studies considered variables other than a term for temperature alone.23,27,31–37,39 Dummy variables denoting weekdays or schooldays were included in the reported models from six studies,3,19,25,27,37,39 while three considered outdoor pollen counts,19,23,36 one considered “fever”,27 and one time spent outdoors.36
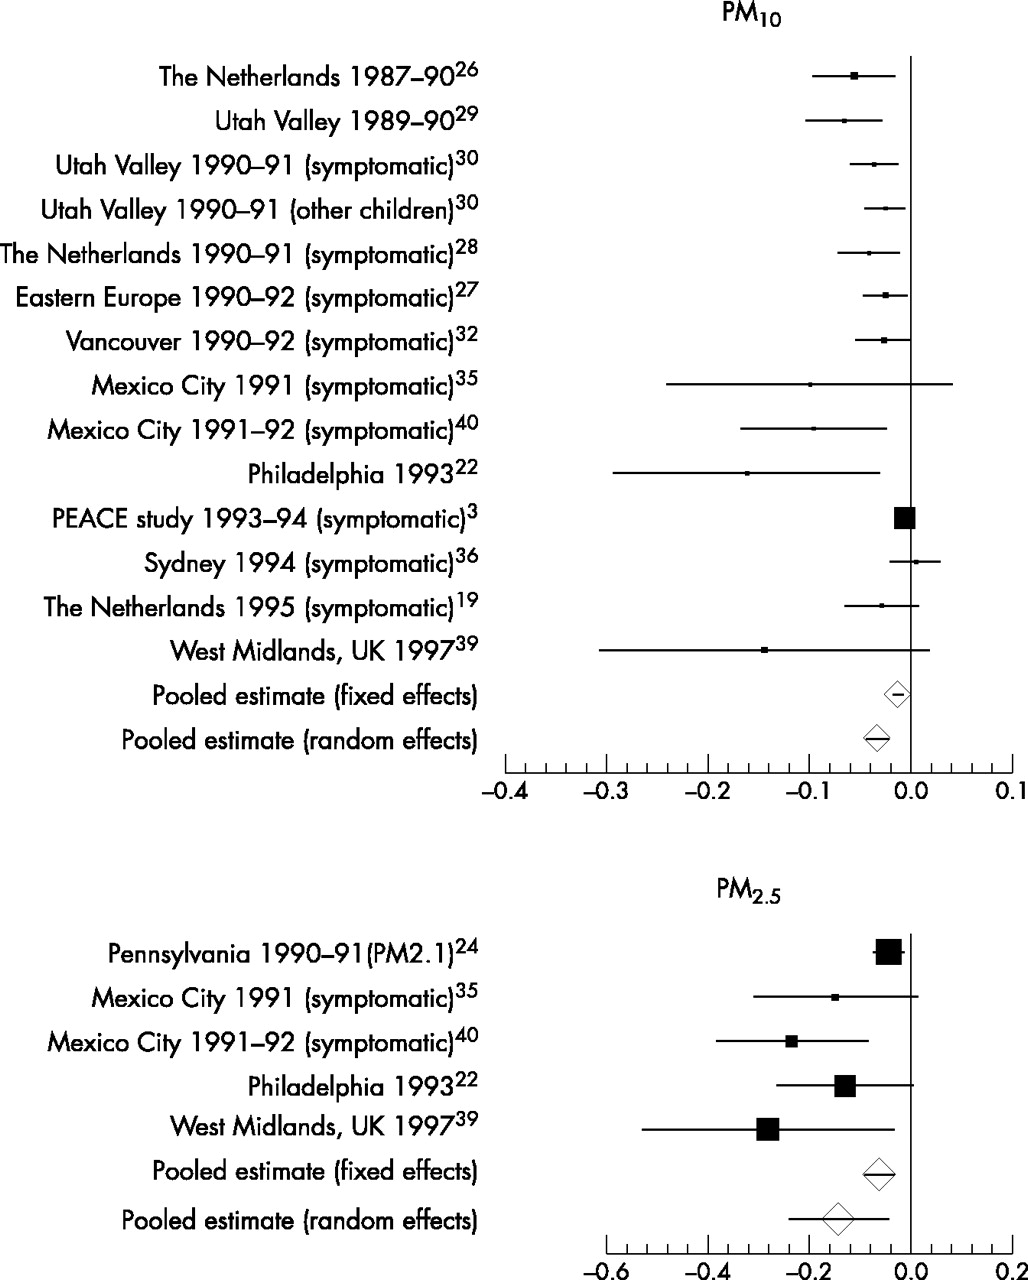
Reported effect size; peak expiratory flow
Pollutant effects on lung function were a reported outcome measure in 19 studies (table 1) and the results for 15 of these are presented in a summary forest plot (fig 1). The plots display the largest effect size obtained over various pollutant lags, excluding those for multiple day averages where possible. For PM10, a wide spread of results was observed (mean estimates from −0.16 to +0.01 l.min−1 per μg.m−3), all except one in an adverse direction. Results for PM2.5 showed a greater range of absolute values (mean estimates −0.05 to −0.28 l.min−1 per μg.m−3) although their interval estimates overlapped more closely. The results of four studies could not be displayed in this manner. The first, from Surrey, UK, used spirometry and showed associations between increased PM10 and falls in FEV1 and FVC (0.07 and 0.17 ml per μg.m−3 respectively),23 while results from two others (Netherlands and Paris) could not be expressed as PEF change. The Dutch study found that the odds of a significant PEF decline were increased with increased PM10,43 while the French study concluded that increased PM13 led to a PEF fall in mild, but not more severe, asthmatics (as judged by inhaled corticosteroid dose).31 Finally, no appropriate quantitative data could be extracted from one paper.34

Mean and 95% confidence interval estimates of the impact of PM10 and PM2.5 on PEF expressed as l.min−1 change per μg.m−3 rise in pollutant. “Symptomatic” indicates subjects with pre-existing respiratory symptoms or asthma.
Results for PM10 from fig 1 were pooled to derive a FE summary estimate (table 2). The forest plot suggested that the study results were not homogeneous, and formal testing of heterogeneity supported this view (table 2). An RE model produced a much greater estimated effect size, giving much less weight to the PEACE study, and potential reasons for such variability were therefore explored.
Pooled effect estimates for peak expiratory flow (PEF), where n represents the number of studies and p values derive from the Q combinality test for homogeneity between study effect estimates
These results were generally the “headline” or main reported estimate for each study (typically the greatest effect size found) and most related to either the same or previous day’s pollutant levels. Longer lags of two19,40 or three39 days, and results for moving average (four or five day30,32) levels are presented by only five studies. Their exclusion did not materially affect the pooled estimate (table 2). Only three studies employed a two stage analytical approach and their pooled effect estimate (FE) was considerably greater than that for other studies.19,32,40 In addition, there was less evidence of heterogeneity between results among these studies. The majority of studies primarily considered asthmatic or symptomatic children. However, the pooled estimate (FE) for other individuals derived from five studies22,26,29,30,39 suggested a greater pollutant effect among these children (table 2), although in only two was a direct comparison between those with and without pre-existing respiratory symptoms provided. Of these, the study conducted in the Utah Valley, USA indicated a greater effect among symptomatic children,30 while the study from the UK West Midlands did not.39 Studies with high peak ozone levels (eight hour mean greater than 50 ppb) produced a pooled estimate (FE) greater than that for all studies as a whole19,22,35 (table 2).
Pooled results for PM2.5 (table 2, fig 1) suggest a greater effect size per unit pollutant than for PM10 and reduced heterogeneity among results (0.05 > p > 0.025), although the summary estimate derived from a RE model was still considerably greater than that from an FE approach. A direct comparison of the relative effects of these PM metrics was available from four studies; in three, the impact of PM2.5 is (non-significantly) greater than that of PM10 per unit pollutant,35,39,40 while one study reports the reverse.22 Studies were mostly conducted in similar conditions of high ozone, so the impact of environmental conditions was not explored further. Visually there was little evidence that effect estimates were greater in studies recruiting asthmatic or symptomatic children, indeed the largest estimate of effect was obtained from a panel of unselected children.39
Reported effect size; symptoms
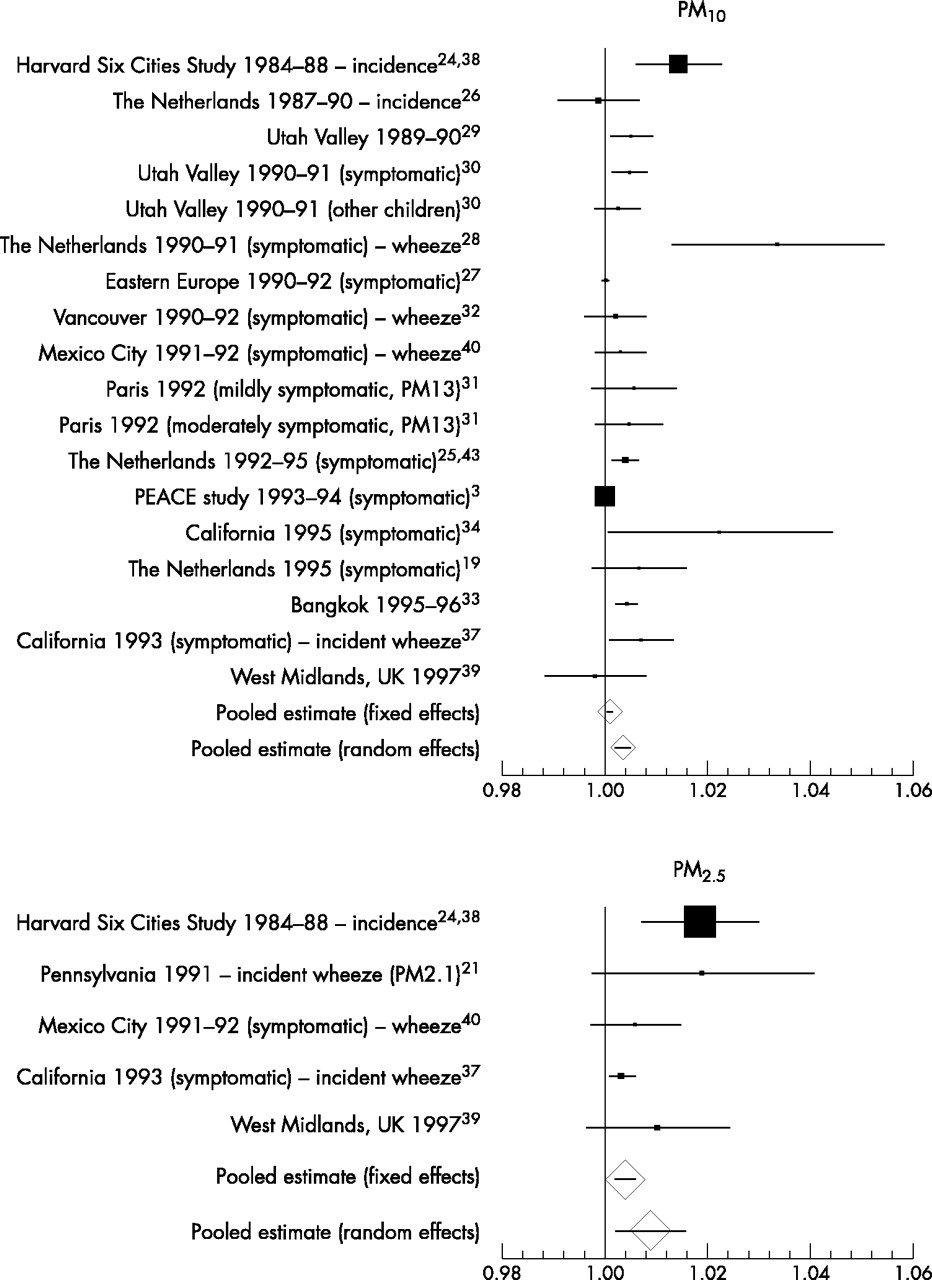
Results for the 18 identified studies investigating pollutant effects on reported symptoms are presented in two summary forest plots (figs 2 and 3). The plots for PM10 and PM2.5 display the largest effect size obtained over various pollutant lags excluding those for multiple day averages where possible, and exclude one study that provided insufficient symptom data for further analysis.35 For PM10, results were again widely spread (mean OR estimates range from 0.999 to 1.014 per μg.m−3 for cough and 0.998 to 1.034 for LRS) and approximately half of all reported results were not themselves statistically significant (more so in the case of LRS).
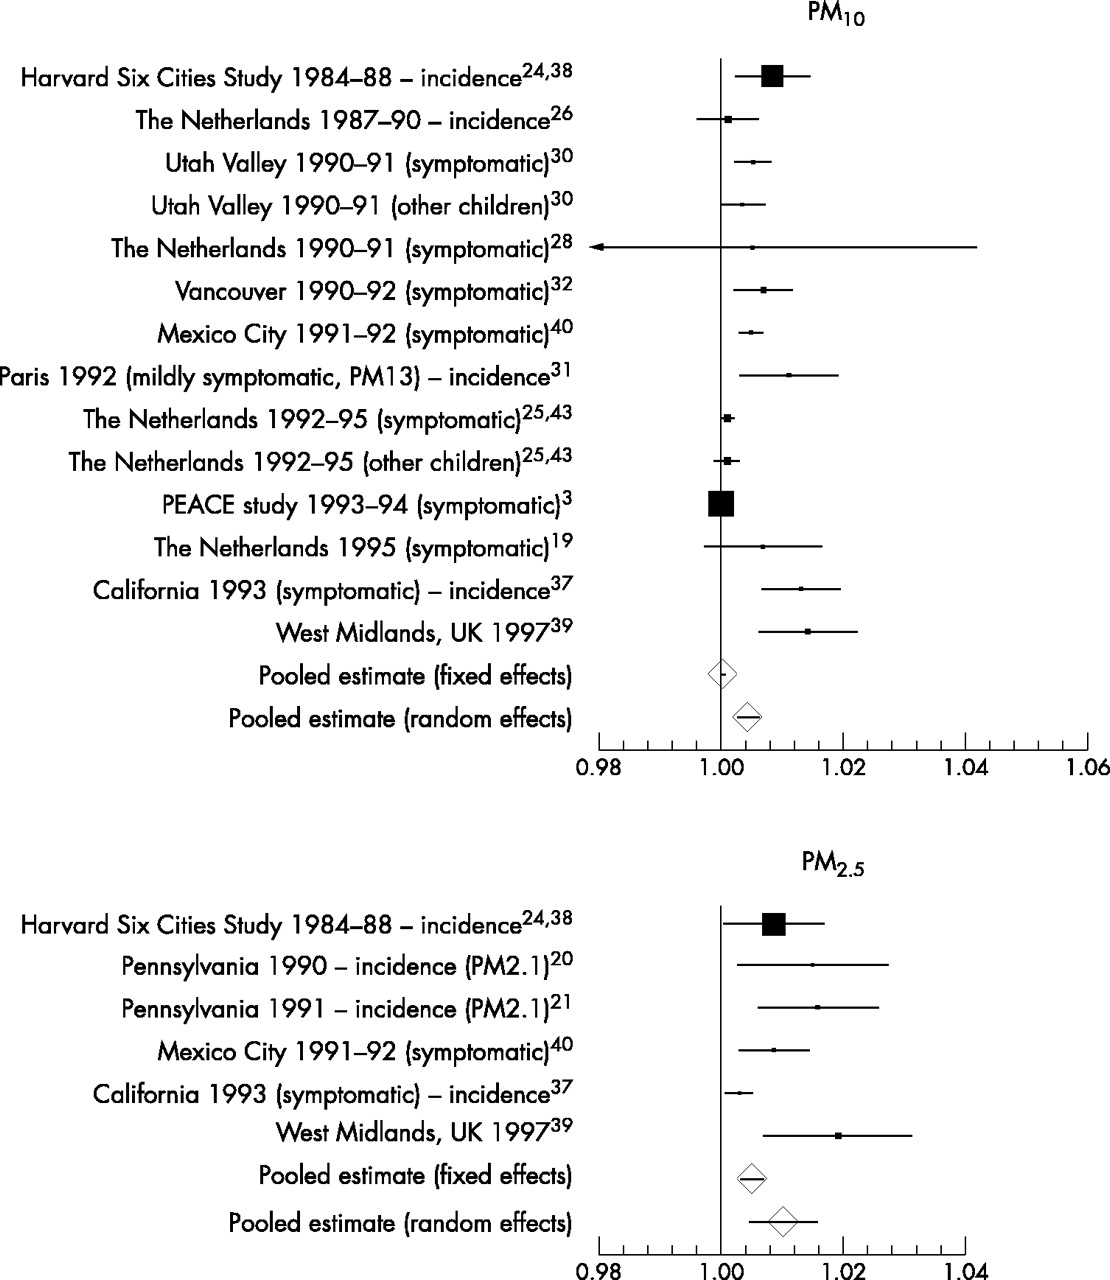
Mean and 95% confidence interval estimates of the impact of PM10 and PM2.5 on reported cough, expressed as the multiplicative change in symptom odds per μg.m−3 rise in pollutant. “Symptomatic” indicates subjects with pre-existing respiratory symptoms or asthma and symptoms analysed as prevalence data unless indicated otherwise (incidence).

Mean and 95% confidence interval estimates of the impact of PM10 and PM2.5 on reported LRS or wheeze (where indicated), expressed as the multiplicative change in symptom odds per μg.m−3 rise in pollutant. “Symptomatic” indicates subjects with pre-existing respiratory symptoms or asthma and symptoms analysed as prevalence data unless indicated otherwise (incidence).
Pooling the results for PM10 (FE) suggests no overall effect for cough, and a very small, but statistically significant (p < 0.05) effect for LRS (tables 3 and 4). In both cases, the precision weighted mean is dominated by the results from the two large multicentre studies.3,38 However, the forest plots suggest considerable heterogeneity that was statistically significant. Summary ORs from RE models show increased effect sizes, and potential sources of heterogeneity were further explored through subgroup analysis.
Pooled effect estimates for cough where n represents the number of studies and p values derive from the Q combinality test for homogeneity between study effect estimates
Pooled effect estimates for the symptoms related to the lower respiratory tract (excluding cough alone) either as a composite endpoint (lower respiratory symptoms, LRS) or wheeze where n represents the number of studies and p values derive from the Q combinality test for homogeneity between study effect estimates
The pooled results for LRS include both studies reporting a composite endpoint as well as those reporting the symptom wheeze alone. Excluding the latter (five studies28,32,37,39,40) did not change the summary estimate (FE). For cough, eight studies analysed the symptom records as prevalent data, the remainder converting the raw data to incident episodes. For LRS, almost all studies were analysed as prevalence. Omitting results relating to incident data did not alter either FE summary effect estimate (tables 3 and 4). As for PEF, the results presented generally reflect the pollutant lag with the greatest effect size. However, for cough, the results for only four studies relate to lags greater than two days31,37 or multiple day averages,32,38 and for LRS, all except three results relate to the same or previous day’s pollutant levels.32,37,39 The exclusion of these studies did not alter either summary effect estimate (tables 3 and 4). A two stage analytical approach was used by four studies19,32,34,40 and pooling their results (FE) suggests a greater estimated effect size among these studies than for results as a whole. Importantly, for LRS there was also less evidence of heterogeneity among these results (0.10 > p > 0.05, table 4). GEEs were used to model autocorrelation effects in seven studies29–32,37,38,40 and again, pooled results (FE) suggest a larger overall estimated effects for these studies, although heterogeneity remained.
Few studies presented results for children not selected on the basis of asthma or pre-existing respiratory symptoms. However, those that did suggested greater pollutant effects among non-symptomatic children (tables 3 and 4), particularly for LRS,26,29,30,33,38,39 and for cough, their results appeared more homogeneous than for all studies (0.025 > p > 0.01).26,30,38,39,43 Of just two studies that presented direct comparisons of such children, one indicated a small increased effect of PM10 on symptoms in children with asthma or pre-existing symptoms,30 while the other showed no difference for cough.43 Pooled results from studies conducted in conditions of relatively high ozone suggest a greater impact of PM10 on both cough and LRS than for studies as a whole, although there was little evidence of homogeneity between such studies reporting either outcome (tables 3 and 4).19,34,37,38 In contrast, results from panels with high SO2 levels (excluding PEACE3) showed little if any pollutant effect.27,38,43
Pooled results for PM2.5 suggest a greater effect size than PM10, with reduced heterogeneity among results, particularly for LRS (0.05 > p > 0.025, tables 3 and 4, figs 2 and 3). Results obtained from RE models remained considerably greater than those for FE models. Four studies each reporting results for cough and LRS provide a direct comparison between the effect size of PM10 and PM2.5. Results for PM2.5 were reported as (non-significantly) greater than for PM10 (per unit pollutant),39,40 approximately the same,24,38 and in one case lower (significantly so for cough).37 Again, studies were mostly derived from settings experiencing high ozone levels and environmental influences were not therefore explored. Only one study considered asthmatic or symptomatic children for either outcome40 and its estimates were at the lower end of the range of results; one of three non-significant results for LRS.
Funnel plot for PEF results
The possibility of publication bias was considered among studies contributing to the pooled estimate for PM10 and PEF (fig 1). The resulting funnel plot is markedly asymmetrical (fig 4), showing a strong association between increasing effect size and decreasing size of the study estimate’s standard error.

Funnel plot illustrating the relation between the size of either single study or pooled effect estimates, and the precision (inverse of standard error, SE) of those estimates, for results contributing to the pooled estimates of the effect of PM10 on PEF (fig 1 and table 1).
DISCUSSION AND CONCLUSIONS
This review identified a large number of relevant panel studies reporting results for both PEF and symptoms, and while the majority suggest an adverse effect of outdoor particulate matter, their estimates of effect vary considerably. In general, comparisons between studies suggest a greater effect size for PM2.5 per unit pollutant compared to PM10, especially for PEF results where this pattern is mirrored in the available within-study comparisons, and while results for PM10 and cough were more often in the direction of adverse effect than those for LRS, a FE pooling of the results for cough was not statistically significantly different from zero, while that for LRS was. Effect estimates for all outcomes were small, in that the average change in lung function or increase in symptom odds per unit pollutant rise were far less than those that would be considered clinically relevant in an individual. However, pollutant levels vary by factors much greater than just unit changes and susceptibility to pollutant effects are likely to vary within the general population. For a 50 μg.m−3 rise in PM10, the FE pooled estimate for PEF would suggest a mean fall of just 0.6 l.min−1 and the RE estimate a fall of 1.7 l.min−1, yet when individual level data from five panel studies of children20,21,28–30 were re-analysed in terms of the odds of a significant PEF decline, the results indicated that a realistic rise in PM10 may greatly increase the chance of a clinically significant decrement in lung function (odds of a 10% fall in PEF increased by 89% for a 100 μg.m−3 rise).46 Additionally, if susceptibility to pollutants is not distributed evenly within the population, then the mean effect estimates described above could indicate that a susceptible subgroup might actually experience a much greater effect size. If say 10% of the population respond to pollutants, then their mean effect size would be ten times greater than the population average results presented above.
A previous review of particulate health effects conducted before publication of the PEACE study,3 produced a much greater FE estimate for PEF and PM10 (0.008% decline per μg.m−3 rise).47 That review combined results for adults and children, considered studies where recording was less frequent than daily, and the authors used a set of assumptions regarding particle equivalence to combine data using different particle metrics across different, predominantly US settings. In contrast, six of the 13 studies used to derive the estimate for PM10 and PEF were from Europe, and the pattern of estimates suggest that the greatest estimates were derived from North America.
For all outcome PM combinations, an RE approach to deriving the pooled estimate produced a greater effect size. Such models aim to incorporate additional between-study heterogeneity, but the cause of such variability remains unexplained. Panel studies in themselves can contribute to heterogeneity because of variations in design, such as duration and timing of the study periods, inclusion criteria for subjects (including age) and the degree of symptomatology. In addition, because of their shorter duration (compared to time series studies) unmeasured time dependent confounders may have an impact, or at least be less adequately dealt with. Thus, the interpretation of RE estimates is complex, they cannot easily be generalised beyond the specific set of included studies, and where they differ markedly from FE estimates, may indicate a degree of heterogeneity that makes summary estimation nonsensical.14 Exploring the potential reasons for variation in results indicated that analytical approach might play a part. The greater estimated effect size produced by studies that modelled autocorrelation using GEEs than those that included additional regression terms incorporating information about past levels of the outcome was to be expected on theoretical grounds. However, the greater effect size (and possible reduced heterogeneity) among the minority of studies that adopted a two stage analytical approach is a new finding. Effect and interval estimates that derive from these different strategies may have quite different interpretations. On the one hand, deriving a series of daily average levels for the outcome of interest means that the final results (and confidence intervals) reflect only changes in those average levels. On the other hand, final results from a two stage analysis reflect the mean and spread of individual responses to pollutants. A reanalysis of the West Midlands, UK data39 using a two stage approach with the same terms incorporated into the regression analyses, resulted in effect estimates for PEF that were much smaller than those from the original analyses (Ward and Ayres 2002, personal communication), the reverse of the pattern seen between studies in this review. However, the interval estimates were generally reduced even further resulting in more “statistically significant” results (for PM10 −0.029 l.min−1 per μg.m−3 rise, 95% CI −0.070 to 0.011; for PM2.5 −0.060 l.min−1 per μg.m−3 rise, 95% CI −0.106 to −0.015). The generalisability of these observations is not known and requires the reanalysis of further datasets to provide additional within-study comparisons.
Further exploration of the observed variation in study estimates also implicated aspects of the study setting and panel selection. Pooled estimates suggest that studies conducted in conditions of high peak ozone levels produced greater PM10 estimates of effect for all outcomes than studies in other settings. This finding could arise if the effects of particulates were enhanced in such circumstances or were qualitatively different in summertime. However, confounding could equally explain these results. This might occur if studies reporting these conditions generally also recruited more susceptible children or used a different analytical approach, because children spend more time outdoors in summer and are more affected by outdoor pollutants, or because the two pollutants are closely associated and the estimate for PM10 is not sufficiently corrected for the effects of ozone. There was no indication of a similar pattern of results for PM2.5, although there were fewer studies to consider and virtually all estimates were derived from North American settings. Two-pollutant models are subject to problems of collinearity and may be difficult to interpret. However, several studies have presented the results of models incorporating measures of fine or secondary particulate matter and ozone: two studies from Mexico showed a persisting effect of PM2.5 after controlling for ozone,35,40 and the effect of summertime particulate sulphate on PEF predominated over that of ozone in a study of children from Philadelphia.22 No similar data have been published for PM10, although results from the Harvard Six Cities Study reveal a persisting effect of PM2.5 on LRS, and coarse particles (PM2.5–10) on cough, in models that include both measures.24
Pooled estimates also suggested that effect estimates for PM10 derived from panels selected on the basis of a history of asthma or asthmatic symptoms were smaller than those derived from subjects without such a history. However, there was considerable variation in the criteria used to select children, ranging from children diagnosed as asthmatic on the basis of reported wheeze, doctor diagnosed asthma, and/or chronic cough27,29–31 to those recruited with cough alone3,28 or with abnormal pulmonary function.32,40 In contrast, less than half of subjects from the panels in Pennsylvania 1990–91, reported no recent respiratory symptoms, although there was no apparent intention to recruit a “symptomatic” cohort of children.20,21,24 Thus, the great variation in criteria for panel recruitment makes the relative susceptibility of various groups hard to determine from between-study comparisons and may contribute to the heterogeneity among results.
The pooled estimates presented in this review should be considered in the light of the markedly asymmetrical funnel plot obtained for the PM10 and PEF results. This raises the possibility of publication bias, whereby small studies are less likely to be published if they have “negative” findings. Ideas regarding the relation between study size and validity have been developed in the context of clinical trials, and it may be that for observational studies, a small study that characterises exposure and confounding factors well may be more valid than a large one that does not13 or that the precision of an effect estimate is determined by the variability in exposure, and this could plausibly be related to the reported effect size. In addition, asymmetry may also arise where any principal cause of heterogeneity is distributed non-randomly across studies of different sizes. These include those considered here such as study population, setting, study design, and analysis.
In summary, this review of panel studies in children has shown a small overall effect of particles, especially for PEF where the effects of PM2.5 appear to be greater than for PM10. However, there is evidence of considerable heterogeneity among results and this prevents too much confidence being placed on the summary measures of effect. This may be a reflection of factors such as susceptible sub-populations or differing analytical approaches, but it does have implications when considering transferability of effect size or when considering use of the summary estimates in quantitative risk assessment. There is a suggestion that the effects of particles are greater when ozone levels are higher, similar to the finding in some studies for hospital admissions.48 However, this finding could be due to confounding, either in the selection of studies or because of inadequate allowance for interaction between ozone and particle effects. Furthermore, there is evidence that could suggest publication bias and the authors believe that the magnitude of particle effects on children’s health at lower levels of morbidity and exposure remains to be clearly defined.
Acknowledgments
Derek Ward was supported by a grant for a panel study of children from the Department of Health, UK. This paper arose as a result of that work.