Article Text

Abstract
Aim: To explore exposure-response relations in a cohort of laboratory animal workers.
Methods: Exposure-response modelling was carried out in a cohort of 342 laboratory animal workers. Three exposure indices, divided into different exposure categories, were used in the analyses: intensity of exposure to rat urinary aeroallergen (RUA, the main allergen workers were exposed to), weekly duration of exposure to rats, and the product of the intensity and weekly duration of exposure. Outcomes studied were work related chest, eyes and nose, and skin symptoms that had started after employment at the sites, specific sensitisation, and a combination of symptoms and sensitisation. Cox proportional hazard modelling was used to explore exposure-response relations. Smoking, atopic status, age, and gender were taken into account.
Results: We observed the clearest exposure-response relations for the intensity of exposure to RUA and the various endpoints. No clear exposure-response relations were observed for the weekly duration of exposure or the product of the intensity and weekly duration of exposure. The strongest and clearest exposure-response relations for symptoms were observed among rat sensitised workers, while the non-sensitised workers only showed small increased risks of developing symptoms without clear exposure-response relations. Sensitised workers were almost four times more likely to go on to develop chest symptoms compared to non-sensitised workers.
- laboratory animal allergy
- exposure-response
- sensitisers
- CI, confidence interval
- RR, rate ratio
- RUA, rat urinary aeroallergen
- SORA, symptomatic occupational respiratory allergy
- SPT, skin prick test
Statistics from Altmetric.com
- CI, confidence interval
- RR, rate ratio
- RUA, rat urinary aeroallergen
- SORA, symptomatic occupational respiratory allergy
- SPT, skin prick test
Occupational asthma is one of the most commonly reported occupational respiratory diseases.1 Allergy is the most important health problem for those occupationally exposed to rats and mice. Laboratory animals are among the most common causes of asthma reported to a UK surveillance scheme.1 Typically one third of those exposed to rats may develop eyes and/or nose symptoms (rhinitis/conjunctivitis) and one in ten exposed people may develop asthma.2
Over recent years our groups have carried out various epidemiological studies and have reported exposure-response relations for exposure intensity to laboratory animal related allergens and symptoms or specific sensitisation to these allergens.3–6 In our pooled cross sectional analysis, Heederik and colleagues5 reported that those who work with conscious rats are more likely to become sensitised and develop symptoms of laboratory animal allergy than those who work with rat tissues or who have no contact. In addition, this analysis5 found a stronger exposure-response relation between exposure and disease if the exposure variable was expressed as the product of intensity and weekly duration of exposure to rats compared to other exposure proxies such as exposure intensity or duration separately. In a different cohort in Canada, Gautrin and colleagues7 found a 2.5-fold increased risk of sensitisation for those working more than 52 hours per week with rodents compared to those working 16 hours per week or less with rodents, but did not report anything on the intensity of exposure in their cohort study.
The aim of the analysis presented here was to explore the relation between weekly duration of exposure and the product of intensity and weekly duration of exposure to rats and various health endpoints, including the development of symptoms among those who were sensitised to rat urinary allergen, using Cox proportional hazard models, in the UK cohort of laboratory animal workers previously reported,3,6,8 and partly included in a pooled cross sectional analysis.5 We also describe the relation for intensity of exposure and the various endpoints. Some of the relations have been reported before,3,5,6 but not the separate analysis of sensitised and non-sensitised workers.
METHOD
Cohort
The cohort has been described elsewhere.3,6,8 Briefly, employees at two large research establishments carrying out toxicological or basic scientific research involving rats were studied. The cohort (n = 355) consisted of employees (37% male) working in areas with potential exposure to laboratory rats, who had started work at these sites between 1 January 1986 and 31 December 1993, and had worked there for at least one month. Of these, 13 workers were not included in the analysis because their exposure status was not known. The analysis is restricted to employees who had not worked previously with laboratory animals. Field work began in 1990 and continued with site visits at six monthly intervals until the end of 1993, a total of seven visits to each site. Over 80% of those eligible who were still employed attended at each visit.
Health endpoints
Previous analyses focused on the outcome variables of any symptoms (including chest, eyes/nose, or skin symptoms), chest symptoms (chest tightness, wheeze or whistling, or difficulty in breathing), eye/nose symptoms (itching, sneezing, running, or blockage), skin symptoms (itchy rash), and sensitisation as measured by a positive skin prick test (SPT) to rat extract (wheal ≥3 mm diameter than the negative saline control).6 Symptoms were considered “work related” if they were provoked by contact with rats and/or improved on holiday or at weekends. Furthermore they were defined as “new” if they commenced after the start of employment at the site. For the analyses presented in this paper we have used symptoms that were defined as “new work related” and we refer to them as chest, eye/nose, or skin symptoms. We have also created a new outcome variable for the current analysis that combines “new work related chest symptoms” with a “positive skin prick test to rats” to form symptomatic occupational respiratory allergy (SORA). We believe that this new outcome variable is more biologically specific and associated more strongly with occupational asthma. Furthermore, some of the laboratory animal workers were exposed to other allergens, for example from mice, and this approach makes the analysis more specific. Participants were considered to be atopic if, at their first visit, they had at least one positive skin prick test (a wheal diameter ≥3 mm than the negative saline control) to grass pollen (B2 mix, 4100), cat dander (3204), or Dermatophagoides pteronyssinus (2801) (Bencard, Brentford, UK). Smokers were defined as those who smoked more than one cigarette per day for as long as a year while employed at the site. Table 1 shows characteristics of the subjects.
Characteristics of subjects by outcomes for laboratory animal cohort
A total of 127 (42%) employees were seen on seven occasions; 33, 18, 29, 25, 70, and 43 were seen on six, five, four, three, two, and one occasion(s) respectively. At each visit, symptoms and skin prick test responses were assessed. Those who did not develop work related symptoms or sensitisation worked for a mean duration of 32 months, with an interquartile range of 26–50 months. Limited postal information was obtained from 88% of the 198 cohort members who had left the site before fieldwork started. In the present analysis only information from those who were surveyed during fieldwork has been used.
Exposure indices and categories
During the collection of data, individual work histories, including job titles since first employment at the site, were recorded at each visit. Further information on the data collection methodology and the quantification of rat urinary aeroallergen (RUA) exposure, the main allergen in this cohort, can be found elsewhere.3,8,9
Initially four exposure categories based on job description, personal exposure monitoring data, and an almost equal distribution of the number of workers in each group as we used previously6 were created (table 2). These exposure categories reflect the intensity of exposure to RUA as determined by the programme to quantify airborne RUA8 and were used in our previous exposure response analyses.3,8,9 Two more exposure indices were created for the current analysis: one based on the weekly duration of exposure to rats and one being the product of the RUA concentration and the weekly duration of exposure to rats (tables 3 and 4). Cross tabulation of the three exposure indices revealed that there was little difference in the number of workers in the exposure categories between the weekly duration of exposure to rats and the product of the RUA concentration, and the weekly duration of exposure to rats with only around 10% of the cohort moving between exposure categories (data not shown). However, the differences in the number of workers in the exposure categories between the RUA exposure intensity categorisation and the other two exposure indices was considerable, with almost half the cohort members moving between exposure categories (data not shown).
Exposure indices and their categorisation among laboratory animal workers: categories of intensity of exposure to RUA
Exposure indices and their categorisation among laboratory animal workers: categories of hours per week contact with rats
Exposure indices and their categorisation among laboratory animal workers: categories of the product of intensity and duration of exposure to rats
Statistical analysis
Cox proportional hazards modelling10 was used to explore the exposure-response relations for the various exposure indices in relation to the health endpoints, by estimating the hazard ratios as an estimate of the relative risk, with the time variable defined as the difference between first occurrence of a given event and the time of entrance into the study. The first occurrence of the endpoint was used as the event. Rate ratios (RR) and 95% confidence intervals (95% CI) were estimated. Atopy and smoking were also included in the analysis as fixed covariates at baseline. All statistical analyses were performed with STATA software (version 5).
RESULTS
There were clear exposure-response relations between the intensity of exposure to RUA and the various health endpoints (table 5). The weakest relations were observed for any symptoms and eye/nose symptoms, while the strongest relation was observed for skin symptoms. Furthermore, the newly created endpoint, SORA, showed a clear exposure-response relation at lower and intermediate exposure levels, although there was a drop in risk at the highest exposed category. The relation between the duration of exposure or the product of duration and intensity of exposure, and the various endpoints was much less clear, except for skin symptoms where a strong relation was observed. Some rate ratios were increased but there were no clear patterns, except for skin symptoms and also duration of exposure and any symptoms. Atopic workers showed significantly higher risks for chest symptoms (RR = 2.5, 95% CI 1.3 to 5.2), a positive skin prick test to rat urine (RR = 5.6, 95% CI 2.7 to 11.5) and SORA (RR = 14.4, 95% CI 3.2 to 64.5), while smokers showed a significantly higher risk for chest symptoms (RR = 2.0, 95% CI 1.0 to 4.1), eye/nose symptoms (RR = 2.0, 95% CI 1.2 to 3.3), and SORA (RR = 2.9, 95% CI 1.0 to 8.1).
Relations between symptoms and specific sensitisation and three exposure indices in laboratory animal workers
Further analyses were carried out by splitting the cohort into those who were and were not sensitised to rat urine using intensity of exposure as the exposure index. The low exposure categories were combined to allow for enough cases in this category, and included both sensitised and non-sensitised workers. The relation for sensitised workers differed considerably from non-sensitised workers (table 6). Increased rate ratios were observed for the non-sensitised workers, but these elevations were relatively small and only showed an exposure-response relation for skin symptoms. On the other hand, clear and steep exposure-response relations were observed for the sensitised workers, particularly at the higher exposure categories. For any, chest, and eye/nose symptoms the highest exposure category showed rate ratios lower than in the category below; however the estimates may be unstable because of the small numbers of workers. The analysis showed that sensitised workers were at a much higher risk of developing symptoms compared to non-sensitised workers, particularly at the higher exposure categories. Atopy increased the risk for chest symptoms only among sensitised workers (RR = 4.2, 95% CI 1.1 to 16.4). Smoking increased the risks for all symptoms among non-sensitised workers (RRs ranging from 1.6 to 1.8), but not sensitised workers; these were only significant for any and eyes/nose symptoms. Further analysis showed that in the overall cohort 12 workers developed chest symptoms after they had a positive skin prick test to rat urine, suggesting that those with a positive skin prick test to rat urine had an almost four times higher risk of developing chest symptoms compared to those who had a negative skin prick test (table 7).
Relation between symptoms and RUA intensity of exposure categories for rat urine sensitised and non-sensitised laboratory animal workers
Association between a positive skin prick test to rat urine and new work related symptoms, with new work related chest symptoms following a positive skin prick test to rat urine
Analyses of exposure duration and the product of duration and intensity by sensitised and non-sensitised worker did not show any clear exposure-response patterns, although the risk of developing symptoms for sensitised workers was always higher than for the non-sensitised workers in the different categories (data not shown).
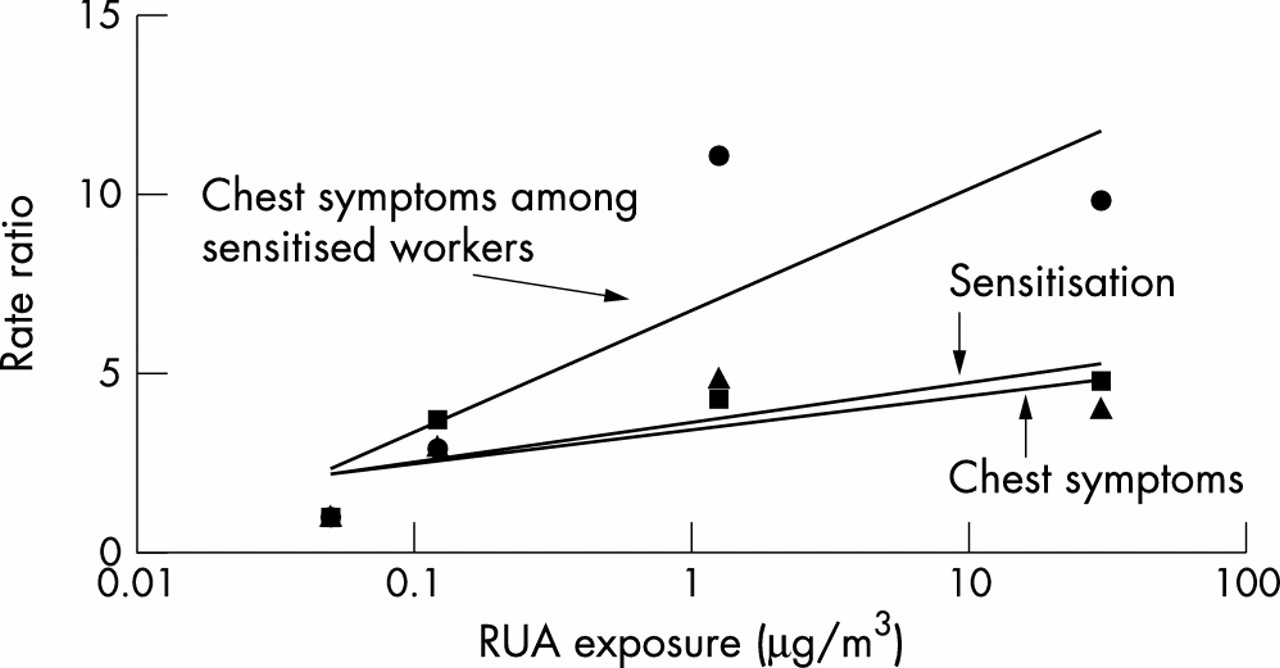
Figure 1 shows the relations between the intensity of exposure to RUA and chest symptoms, sensitisation (as measured by skin prick test), and chest symptoms among sensitised workers, using a “best fit” regression line. Whereas the slopes for chest symptoms and sensitisation are similar, the slope for chest symptoms among sensitised workers is much steeper.
Exposure-response relations for chest symptoms (triangles), skin prick test (squares), and sensitised chest symptoms (circles), including a best fit line.
DISCUSSION
We have presented further analyses of the exposure-response relations among laboratory animal workers. We observed the clearest exposure-response relations for the intensity of exposure to RUA and the various endpoints. No clear exposure-response relations were observed for the weekly duration of exposure or a product of the intensity and weekly duration of exposure. The steepest and clearest exposure-response relations for symptoms were observed among sensitised workers, while the non-sensitised workers only showed small increased risks of developing symptoms without clear exposure-response relations. Sensitised workers were almost four times more likely to develop chest symptoms compared to non-sensitised workers during follow up.
These findings confirm earlier reports from a subset of this cohort, and a Dutch cross sectional study, of an exposure-response relation between the intensity of exposure to laboratory related animals and sensitisation or symptoms.3–6 However, unlike in our previous pooled cross sectional analysis of UK, Dutch, and Swedish data,5 we did not find a better relation with the product of the duration and intensity of exposure. In the UK cohort, workers had longer weekly durations of exposure than in the Dutch study, and a different categorisation of exposure was used in the pooled analysis.5 This may partly explain the difference. The categories that were used in the pooled analysis5 used would fall within the low exposure category used here for duration of exposure. The Swedish and Dutch workers we included in the pooled analyses appeared to be different from their UK counterparts. Whereas the Dutch and Swedish worker were mainly academics with intermittent exposure to animals, a considerable portion of the UK workers worked in regulatory research and many had longer exposure to animals during the week. In Canada, Gautrin and colleagues7 found an 2.5-fold increased risk of sensitisation in their cohort for those working more than 52 hours per week with rodents compared to those working 16 hours per week or less with rodents, but did not find an excess risk for those working between 16 and 52 hours per week with rodents (RR = 1.0). Similar to our study there was no clear exposure-response with the duration of exposure and sensitisation. They did not report on the intensity of exposure in their cohort study.
The relations between exposure to RUA and the various endpoints are similar to our previous analysis of this cohort using a case-referent analysis.6 The advantage of the current analysis is that it makes use of the full cohort. As in the previous case-referent analysis we saw a lower risk in the highest RUA exposure category for some endpoints compared to the exposure category below. This may reflect survivor bias although there was no evidence that cohort members in the highest RUA exposure category had left at an increased rate. However, the numbers were small, and if only a few cases had left or changed category without being noticed it may have a considerable influence on the risk estimate.
The strong exposure-response relations for symptoms among sensitised workers suggests that these relations were driving the relations for the overall cohort. Only one study has done this before and this, of Dutch bakery workers, showed only slightly increased risk of respiratory symptoms among sensitised compared to non-sensitised workers.11 Generally the endpoints have been analysed separately. The non-sensitised workers also showed slightly increased risks of symptoms, although the patterns were not so clear, suggesting that non IgE-mediated or non-immunological responses may have occurred although the mechanism is unclear.
Main messages
-
Intensity of exposure was a more important exposure related risk factor for laboratory animal allergy related health endpoints than weekly duration of exposure in this study.
-
Workers sensitised to rat allergens showed the strongest relation between exposure to rat urinary aeroallergen and laboratory animal allergy related health endpoints.
-
Sensitised workers were almost four times more likely to go on to develop chest symptoms compared to non-sensitised workers.
Only two previous studies, in Sweden and Canada, have shown an increased risk for the development of chest symptoms among sensitised laboratory animal workers prospectively in cohort studies.7,12 This is partly caused by the very limited number of prospective cohort studies that have been carried out among laboratory animal workers or any other group occupationally exposed to respiratory sensitisers. The magnitude of the observed risk in the current study is very similar to that reported by Renstrom and colleagues12 and Gautrin and colleagues7 among laboratory animal workers, and De Zotti and Bovenzi13 in Italian bakery workers.
Atopics were at higher risk of developing chest symptoms and sensitisation, and this is consistent with observations from previous analyses of our cohort.3–6 Further analysis showed that there was an increased risk of chest symptoms among atopics who were sensitised to rat urine but no increased risk of chest symptoms among atopics who were not sensitised to rat urine. Furthermore, we observed an increased risk for chest and eyes/nose symptoms, and SORA in the whole cohort for smokers. However, further analysis showed that this effect was confined to chest, eyes/nose, and skin symptoms for smokers who were not sensitised to rat urine.
The results of this analysis clearly showed that the development of symptoms, particularly among sensitised workers, was most closely related to the intensity of exposure to RUA. The relations with weekly duration of exposure, or the product of intensity and weekly duration of exposure, were less clear. Furthermore, our other studies, focusing on other sensitisers such as flour or fungal α amylase, have shown clear exposure-response relations for intensity of exposure and development of sensitisation and symptoms.11,14–16 This is strong evidence that the intensity of exposure to sensitisers is an important risk factor for the development of sensitisation and symptoms. It is paramount that exposure levels to respiratory sensitisers should be reduced as low as possible to prevent the development of disease.
Policy implications
-
Exposure levels of rat urinary aeroallergens should be reduced as far as reasonably practicable to prevent the development of laboratory animal allergy.
-
Extra precautions, including exposure reduction and health surveillance, for example, should be taken with sensitised workers to prevent them from developing symptoms.
-
Laboratory animal allergy is preventable and an increased effort is needed to prevent the disease.
Acknowledgments
Fieldwork for this study was performed by R Blanks, J Clark, M Divitini, B Fitzgerald, J Foster, B Graneek, J Harris, J Hayes, C Hogg, G Lamond, K Sullivan, D Lowson, and J Welch. The authors are very grateful to the participants and management staff of the study sites, and Professor C McDonald and Dr Rosemary Tee for their initial involvement in the design and previous analysis of the cohort study. The fieldwork and initial analyses were funded by the Health and Safety Executive, the National Asthma Campaign, The Royal Society, and the Department of Health. The work presented was funded by a grant from the Health and Safety Executive.