Article Text

Abstract
Objective: To understand the association between the SARS outbreak and the environmental temperature, and to provide a scientific basis for prevention and control measures against it.
Methods: The daily numbers of the probable SARS patients and the daily meteorological factors during the SARS outbreak period in Hong Kong, Guangzhou, Beijing, and Taiyuan were used in the data analysis. Ecological analysis was conducted to explore the association between the daily numbers of probable SARS patients and the environmental temperature and its variations.
Results: There was a significant correlation between the SARS cases and the environmental temperature seven days before the onset and the seven day time lag corresponds well with the known incubation period for SARS. The optimum environmental temperature associated with the SARS cases was between 16°C to 28°C, which may encourage virus growth. A sharp rise or decrease in the environmental temperature related to the cold spell led to an increase of the SARS cases because of the possible influence of the weather on the human immune system. This study provided some evidence that there is a higher possibility for SARS to reoccur in spring than that in autumn and winter.
Conclusion: Current knowledge based on case studies of the SARS outbreak in the four cities suggested that the SARS outbreaks were significantly associated with the temperature and its variations. However, because the fallacy and the uncontrolled confounding effects might have biased the results, the possibility of other meteorological factors having an affect on the SARS outbreaks deserves further investigation.
- severe acute respiratory syndrome
- weather
- temperature
Statistics from Altmetric.com
Severe acute respiratory syndrome (SARS) is the first severe and readily transmissible new disease to emerge in the 21st century, which has its origins in Guangdong Province, China. The earliest known cases were identified in mid-November 2002. As of 7 August 2003, a cumulative total of 8422 probable cases, with 916 deaths have been reported in 29 countries.1 On 5 July 2003, the WHO removed Taiwan from its list of areas with recent local transmission of SARS meaning that all known chains of person to person transmission of the SARS virus had been broken. It is therefore an important public health issue whether the SARS epidemics will recur.2,3 Unfortunately, apart from Singapore and Taiwan, where the SARS patients emerged because of laboratory infection, Guangzhou, capital of Guangdong Province, saw the recurrence of four SARS cases between the end of 2003 and early January 2004.
There has been striking progress in global understanding of the science of SARS. Coronavirus has been identified as playing an aetiological part of SARS4 and a lot of work has been done in epidemiological investigation5–7 and in sequencing the genome of SARS associated coronavirus that could lead to the development of vaccine and treatment.8 Even more, there is a handful of literature that has explored mathematical models to predict the number of SARS cases based on patient and other clinical characteristics.9–12 While they still could not explain all SARS epidemical trends in the whole world, there is much about the disease that is poorly understood and frankly puzzling especially in association between the SARS outbreak and environmental factors. However, none of these published models were established based on environmental parameters. Are there any environmental factors facilitating the SARS outbreak? Lee pointed out that from the epidemiological triangle, the agent must be capable of infecting the host for infection to develop and this depends on whether the environment is favourable for its survival and transmission, and it also depends on the susceptibility of the host.2 Abdullah also believed that if SARS follows the pattern of other respiratory viruses, it is probable that it will reappear.3 The causative agent of SARS is a novel coronavirus—a virus of the corona family. About one third of all common colds are caused by viruses from the same family and these show a winter and spring seasonality.13 Some human pathogens such as influenza, measles, and rotavirus follow a cyclical pattern, waxing in colder and drier months and waning when weather turns warmer, which may also be the case for the SARS virus.14 Also there is good experimental and epidemiological evidence that patients may have a decline in respiratory function during certain meteorological events.15–18 Environmental changes, particularly changes in weather, are the explanations most often invoked for seasonality of infectious diseases.19 The emergence of SARS outbreak in China during the influenza season seemed to suggest that environmental factors, for instance environmental temperature, might influence the trends of the SARS outbreak. However, few studies have quantitatively or qualitatively disclosed the impact of weather or climate on the SARS outbreak. This motivated us to start an interdisciplinary medical-meteorological investigation to determine the influence of weather on SARS outbreak. This study has investigated the relation between meteorological factors, especially the environmental temperature, its variations, and the daily number of probable SARS patients in the four cities (Guangzhou, Hong Kong, Beijing, and Taiyuan) in China, by the time series contradistinctive and correlation analysis. It will attempt to identify the important meteorological facts that affect the SARS outbreak and to provide scientific basis for prevention and control measures against it with respect to weather or climate.
METHODS
The study included Hong Kong, Guangzhou (capital of Guangdong Province), Taiyuan (capital of Shanxi Province), and Beijing in China, four typical cities that experienced the SARS outbreak. In consideration of the fact that the daily numbers of SARS cases during the late period of the SARS epidemic was very small and intermittent, we arbitrarily selected the research time period, which spanned the main period of SARS epidemic: from 2 January to 15 April for Guangzhou, from 15 February to 31 May for Hong Kong, from 5 March to 31 May for Beijing, and from 7 March to 12 May for Taiyuan. We also defined an 11 day period (five days before and after the date with the maximum number of SARS patients) as the peak period of the SARS epidemic. The daily number of probable SARS patients for cities was obtained from Department of Health, Hong Kong (http://sc.info.gov.hk/gb/www.info.gov.hk/dh/diseases/ap/chi/bulletin.htm) and Centres for Disease Control and Prevention in Guangzhou, Taiyuan, and Beijing. The probable cases conform to the Case Definitions for Surveillance of Severe Acute Respiratory Syndrome suggested by World Health Organisation as follows: (1) A suspect case with radiological evidence of infiltrates consistent with pneumonia or respiratory distress syndrome (RDS) on chest radiograph. (2) A suspect case of SARS that is positive for SARS coronavirus by one or more assays. The daily meteorological data at the same period were obtained from National Meteorological Centre of China, and Hong Kong Observatory (http://gb.weather.gov.hk/).
As a first approach, relevant weather variables were taken into account, including maximum temperature (Tmax), mean temperature (Tmean), minimum temperature (Tmin), local barometric pressure (P), and relative humidity (RH) for the period under study. The simple correlation between the daily number of probable SARS patients and average values for meteorological variables in each of the cities was computed for the same time and with regard to the influence of incubation periods with time lags (at lag = 0, lag = 1, lag = 3, lag = 5, lag = 7, lag = 10, lag = 14) (fig 1). Because there is autocorrelation between maximum temperature, mean temperature, and minimum temperature, and the correlation coefficients between the number of SARS cases and the maximum temperature is bigger than that with other variables, we selected daily maximum temperature to investigate the relation between meteorological condition and the SARS outbreak. Furthermore, temperature variations may be linked with the SARS outbreak. When humans cannot acclimatise themselves to weather changes, particularly temperature variation, it most often leads to a decrease in their resistance to diseases and an increase in the risk of infectious diseases.
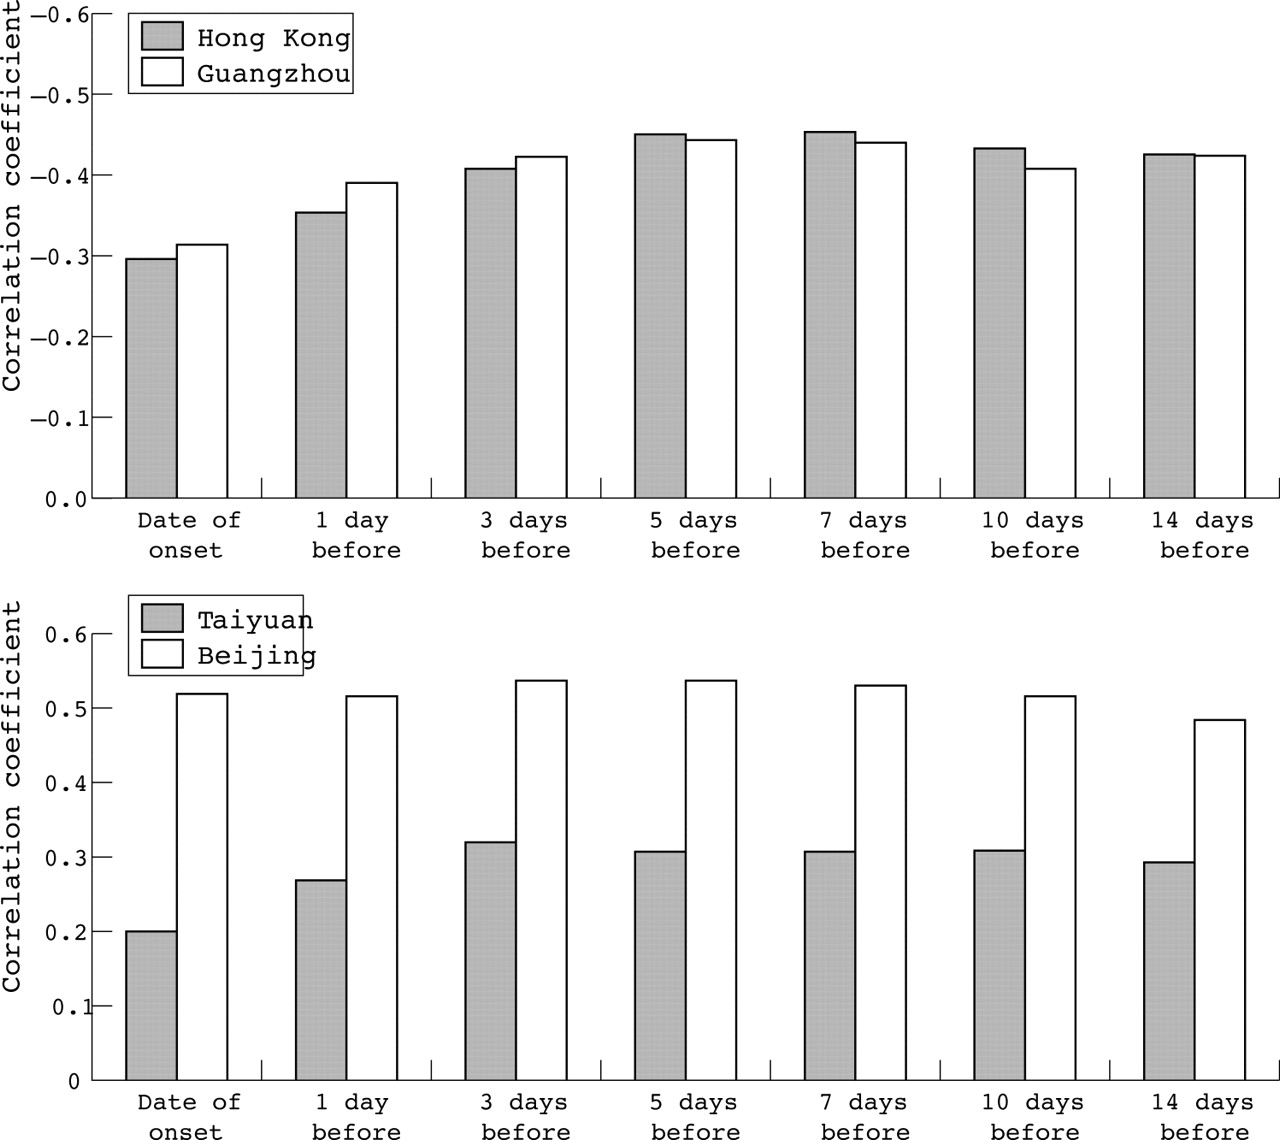
The correlation coefficients between the daily number of SARS patients and the maximum temperature on the date of onset, the mean maximum temperature of several days before in Hong Kong and Guangzhou (above), Taiyuan and Beijing (below).
In this study, a series of cumulative deviation indices of maximum temperatures several days before the date of the SARS onset(CDTn) was derived from the meteorological data series and was calculated as: CDTn = Σ|Tmax,i— Tmax,mean| where CDTn(°C) = cumulative deviation of maximum temperature n days before the date of SARS onset, Tmax,i (°C) = the daily maximum temperature at ith day before the onset (i = 1,n), Tmax,mean(°C) = the mean daily maximum temperature n days before the onset. Here, CDTn explicated the magnitude of temperature changes several days (n days) before the data of the SARS onset. The value of CDTn is bigger in violent changes of weather than in smooth ones.
To investigate the relation between CDTn and the SARS cases, the simple correlation was computed as for Hong Kong, for example (fig 2). From figure 2, we can see that the correlation coefficient of the cumulative deviation of maximum temperature 10 days before the date of the SARS onset (CDT10) is the biggest one. Also, the average number of SARS cases compared with CDT10, and the time series distribution of CDT10 and the daily number of SARS cases in the four cities was presented in this paper.

The correlation coefficients between the daily number of SARS patients and the cumulative deviation of maximum temperature index before the date of onset (Hong Kong as an example).
In addition, the long term daily maximum temperature between 1950 and 2000 in Guangzhou, Beijing, and Taiyuan was calculated to evaluate the climatic possibility of the recurrence of SARS.
RESULTS
The epidemic curve of the SARS outbreak by the date of onset in the four cities (fig 3) showed different time periods of the SARS outbreak in Guangzhou, Hong Kong, Taiyuan, and Beijing. The first SARS case was identified on 2 January in Guangzhou, 15 February in Hong Kong, 5 March in Beijing, and 7 March in Taiyuan, and reached the peak on 8 February, 24 March, 25 April, and 18 April, respectively. After that, the epidemic tended to decline. Table 1 presents the descriptive statistics of meteorological variables during research period. From table 1, we can see that the temperature during the period of the SARS outbreak in Guangzhou, Hong Kong, Beijing, and Taiyuan is 21.7°C, 25.0°C, 19.7°C, and 16.5°C, while that in the peak period are very close with 19.5°C, 21.2°C, 23.7°C, and 17.1°C respectively. Because of their location in different climate zones the relative humidity is more variable with 75%, 83%, 54%, and 57%, respectively.
Descriptive statistics of meteorological variables during the SARS prevalence period in four cities. The values during peak period of SARS outbreak are given in parentheses

The epidemic curve of the SARS outbreak by the date of onset (histogram) and the time series distribution of the cumulative deviation of the maximum temperature index (line) 10 days before the date of onset (CDT10) in Guangzhou, Hong Kong, Beijing, and Taiyuan, China.
The simple correlation between the daily number of probable SARS patients and the average values for meteorological factors in each city was computed for the same time and with regard to the influence of incubation periods with time lags (at lag = 0, lag = 1, lag = 3, lag = 5, lag = 7, lag = 10, lag = 14). Table 2 lists the simple correlation coefficient at lag = 7 for example and we found that temperature has a bigger correlation coefficient than other meteorological factors. Significant inverse correlations between relative humidity and the number of SARS patients were shown in the results from Guangzhou, Beijing, and Taiyuan, while no significant correlation was observed in Hong Kong data.
The lag = 7 simple correlation coefficient between the number of SARS patients and weather variable: maximum temperature (Tmax_7), mean temperature (Tm_7), minimum temperature (Tmin_7), relative humidity (RH_7), and local station barometric pressure (P_7)
Some temperature measurements such as maximum temperature, mean temperature, and minimum temperature were strongly correlated with each other. In this case we only focused on the effect of maximum temperature on the prevalence of SARS. Figure 1 showed the correlation coefficients between the daily number of SARS patients and the maximum temperature on the date of onset and several days before the onset in the four cities. The maximum correlation coefficient is at lag = 5 or lag = 7 that corresponds with the mean incubation period of SARS of five to seven days. Surprisingly, the correlation coefficient in Guangzhou and Hong Kong is negative, while that in Taiyuan and Beijing is positive. That is to say, it is not a simple linear relation between the numbers of SARS patients and the temperature; perhaps there is an optimal temperature range that facilitates the SARS outbreak. Figure 4 shows the total numbers of SARS patients compared with the mean maximum temperature before the date of the SARS onset and we found that 94.6% of the total SARS cases in the four cities were clustered within the mean maximum temperature range 16°C–28°C and with the peak number at 19°C, so we can guess that mean maximum temperature 16°C–28°C may be the optimal temperature for SARS prevalence.
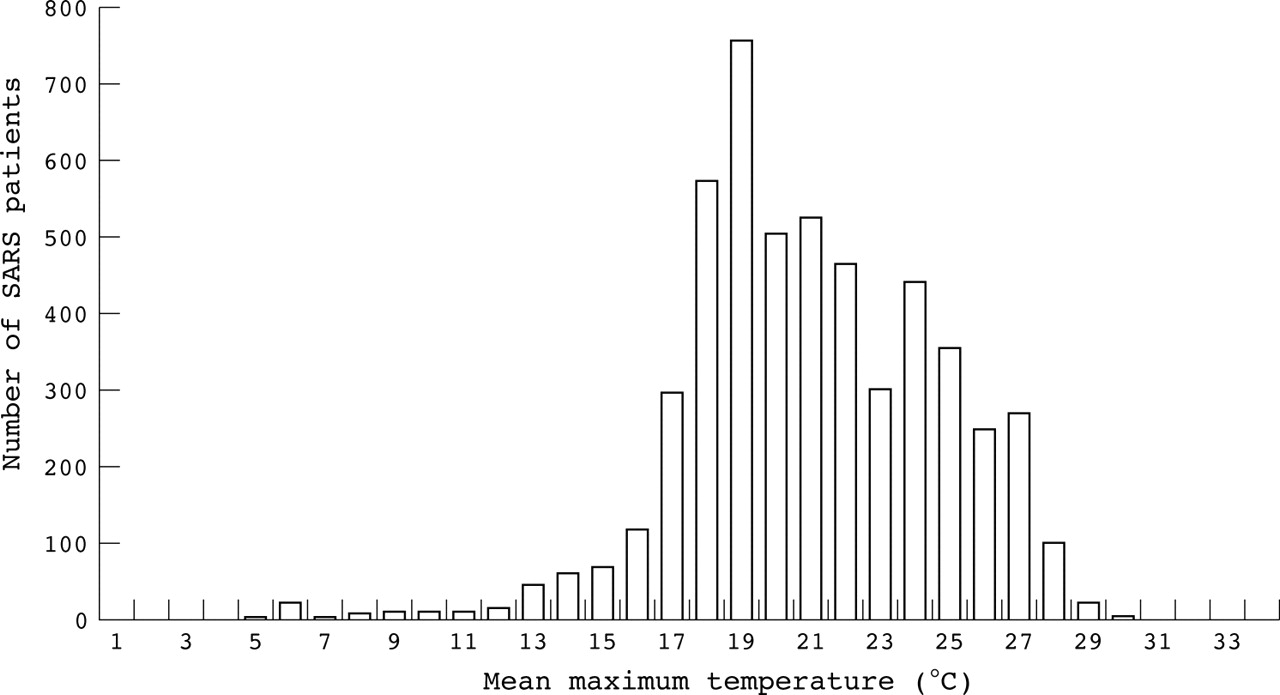
The total numbers of SARS patients compared with the mean maximum temperature seven days before the date onset (derived form the SARS cases in Guangzhou, Hong Kong, Beijing, and Taiyuan, China).
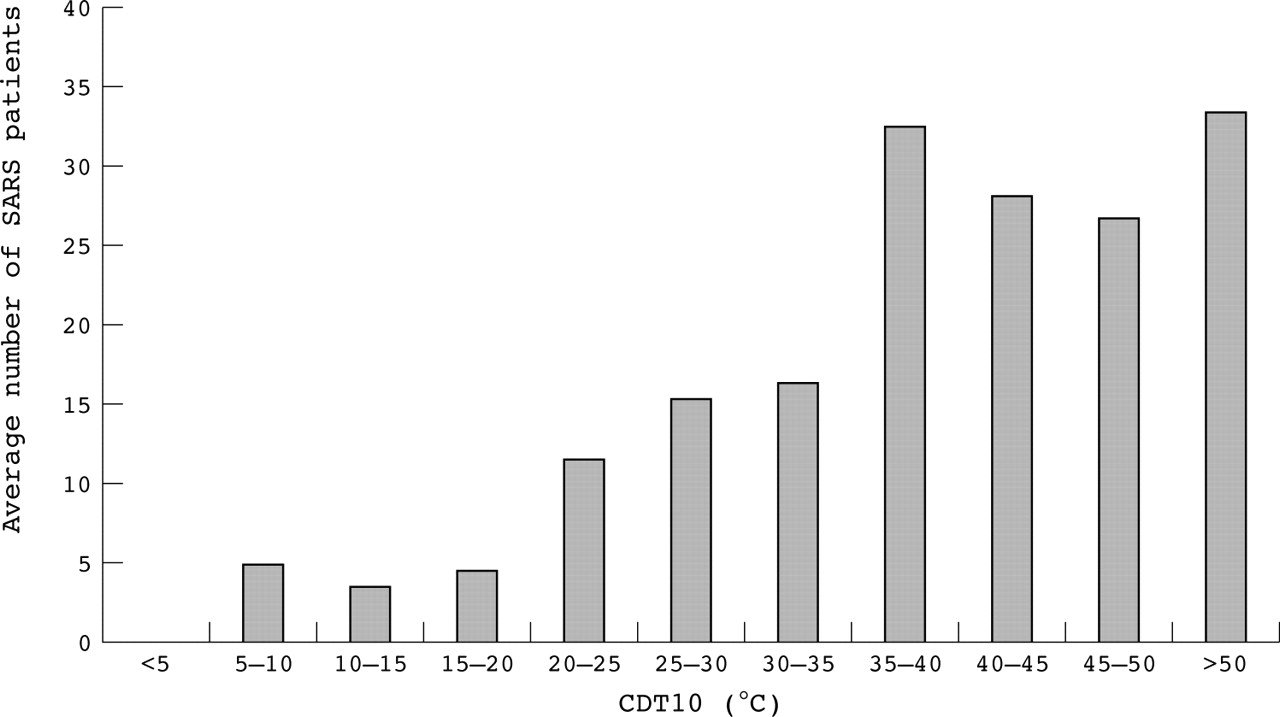
Also, it seemed that temperature variations played a positive part in the prevalence of SARS. From figure 2, we can see that there are positive correlation coefficients between the daily number of SARS patients and the cumulative deviation of the maximum temperature index before the date of onset (CDTn) with the maximum value between SARS cases and CDT10. Along with and increasing value of CDT10, the number of SARS cases ascended (fig 5). Figure 3 shows the epidemic curve of the SARS outbreak by the date of onset, and time series distribution of CDT10 in four cities. The value CDT10 depicts the magnitude of variation of maximum temperature, in fact the sharp temperature variation is attributable to the temperature decrease and increase related to the cold spell invasion. We can see that the epidemic curve of the SARS outbreak was well matched with time series distribution of CDT10.

The average number of SARS patients compared with the cumulative deviation of maximum temperature index 10 days before the date of onset (CDT10) (derived form the SARS cases in Guangzhou, Hong Kong, Beijing, and Taiyuan, China).
Will the SARS reoccur? We used long term historical meteorological daily maximum temperature from 1950 to 2000 in Guangzhou, Beijing, and Taiyuan to see its climatic possibility (Hong Kong was absent for some of the meteorological data). The mean monthly maximum temperature and the occurrence frequency of days with CDT10 above 30°C in each month were calculated (see fig 6). Given that the mean maximum temperature between 16°C and 28°C and high occurrence frequency of days with CDT10 above 30°C were the suitable meteorological factors facilitating the SARS outbreak. From figure 6, we can see that monthly mean maximum temperature from November to April in Guangzhou conforms with the optimum environment temperature associated with SARS cases, while the occurrence of frequency of days with CDT10>30°C in January, February, and March is larger than that in November, December, and April. That is to say, the cold air invasion is more likely to happen in January, February, and March than in another three month period. As to Beijing and Taiyuan, we also can see that although April and October is the optimum month for temperature, October has a comparatively low occurrence frequency of days with CDT10>30°C or a weather period with a sharp decrease or rise in temperature. It probably can be used to explain why there is a lack of SARS in October in Beijing and Taiyuan. On the point of climate, spring months are more suitable for SARS prevalence than autumn and winter, and January, February, and March in Guangzhou, April and early May in Beijing and Taiyuan had the most possibility in climate for SARS prevalence, and this result is well matched with the SARS outbreak in 2003.

The monthly distribution of occurrence frequency (%) of days with CDT10 above 30°C (histogram) and the mean maximum temperature (line) in Guangzhou (top), Beijing (middle), and Taiyuan (bottom).
DISCUSSION
It is well known that the epidemic of any infectious disease is not only a biological phenomenon but also a social phenomenon. Its origins and spread occur only when affected by certain social and natural factors through acting on the source of infection, the mode of transmission, and the susceptibility of the population. The weather and climate factors may play a part in the SARS outbreak except for the social factors.
The results of this research show that there was a significant correlation of the SARS cases with meteorological factors, especially the environmental temperature seven days before the onset and the seven days time lag may be mainly attributable to the known incubation period for SARS. Relative humidity is also a very important environmental factor that may affect prevalence of some disease and the transmission of viruses. Our research shows that there was significant inverse correlation between relative humidity and the number of SARS patients in Guangzhou, Beijing, and Taiyuan, while no significant correlation was observed in Hong Kong. The different result might be caused by highest humidity and little variation during the epidemic period in Hong Kong compared with other areas. It seemed that the comparatively dry period or season might be the favourable condition for SARS prevalence.
The results of research also show that the optimum environmental temperature associated with SARS cases was from 16°C to 28°C. Perhaps external maximum temperature ranging between 16°C and 28°C is the suitable temperature range for SARS virus because the environment meteorological conditions such as temperature may affect the pathogenicity, virulence duplicating, infectivity, and survival of SARS virus. This finding corresponds with Abdullah’s views of permissive temperature enabling transmission of the SARS coronavirus.3 We have also noticed that the maximum temperature when the SARS outbreak occurred in Singapore and Toronto was not in this temperature range. The wider use of heating in Toronto and air conditioning in Singapore, usually to keep the room temperature within the 18°C–22°C range, might have contributed to the longlasting outbreak in these developed cities.3
On the other hand, a distinctive feature of our analysis is its use of a cumulative deviation index of maximum temperature 10 days before the date of SARS onset (CDT10). A high CDT10 points a sharp rate of rise or decrease of the maximum temperature in the past 10 days, which usually relates to the cold air invasion. The temperature has been recognised as a physical agent able to induce health effects19 and the meteorological condition may have an effect on the susceptibility of the population. Our study confirms that the average number of SARS patients drastically increases along with the increase of CDT10 and the peak of SARS outbreak is consistent with the period of highly accumulated temperature variation (CDT10). The variation of temperature may be associated with the disease resistance of humans. It is well known that a cold environment can cause physiological responses20 and weaken the human immune function21 and thereby raise the risk of infectious diseases.22,23 Dowell pointed out that outbreaks of respiratory syncytial virus infections were associated with higher environmental temperature, lower relative humidity, and higher maximum day to day temperature variations.19 So, paying more attention to the weather transformation, increasing weather acclimation, and improving the immunity of the population will be conducive to taking a stand against SARS virus.
Policy implications
SARS is a novel disease remaining poorly understood especially in association between the SARS outbreak and the environmental factors. The weather and climate factors may play a part in it. When vulnerable weather or climate is experienced, the government and the appropriate departments at all levels should maintain vigilance and take corresponding countermeasures to pay more attention to the recurrence of SARS. People can also increase their resistance to disease by keeping warm. Update and dissemination of the new research would be useful to policy and the public.
On account of the optimum range of temperature and monthly occurrence frequency of days with CDT10>30°C based on the long term meteorological data, we may conclude with the view of climate that spring is a more suitable season for SARS prevalence than autumn and winter. January, February, and March in Guangzhou, April and early May in Beijing and Taiyuan had the most likely climate for SARS prevalence. This result is well matched with the period of the SARS epidemic in 2003. While with only one year of data and one outbreak it is impossible to establish that SARS is a seasonal disease, our study provided some climatic possibility that SARS might recur. Perhaps, the emergence of the four SARS cases in early January 2004 is a good illustration.
SARS is a poorly understood new infectious disease and there are still considerable gaps in our knowledge of the global epidemiology of SARS. This study was subject to several limitations. Firstly, ecological study designs were adopted in the study, which might be subject to ecological fallacy.24 Secondly, the effect of weather on SARS is comprehensive. We had no data on the joint distribution between air pollution and potential confounders such as other meteorological factors and socioeconomic status, and countermeasures, etc. Therefore, no confounding effects could be evaluated. Nevertheless, this is the first study showing that temperature and its variation is associated with SARS prevalence and interpretation why SARS outbreaks emerge in different months in different cities. Also, as sources of infection are of the foremost importance, it deserves further investigation and might have an impact on the study of the natural history of SARS.
In conclusion, our study showed a close association between temperature, its variations, and the SARS outbreak in the four cities in China. It seemed that SARS could prove to be a seasonal disease with more possibility in spring than in autumn and winter. Although the interpretation of this association remains uncertain, the possibility of a detrimental effect of other natural and social factors on the outbreak of SARS deserves further investigation.
Acknowledgments
We thank Dr Bernard C K Choi (Associate Professor, University of Toronto) and the other two reviewers for their excellent comments and instructive suggestions.
REFERENCES
Footnotes
-
Funding: the Science and Technology committee of Shanghai Municipality provided financial support for the study.
-
Conflicts of interest: none declared.