


Abstract
Obstructive sleep apnoea (OSA) is associated with cardiovascular disease. Dyslipidaemia has been implicated as a mechanism linking OSA with atherosclerosis, but no consistent associations with lipids exist for OSA or positive airway pressure treatment. We assessed the relationships between fasting lipid levels and obesity and OSA severity, and explored the impact of positive airway pressure treatment on 2-year fasting lipid level changes.
Analyses included moderate-to-severe OSA patients from the Icelandic Sleep Apnoea Cohort. Fasting morning lipids were analysed in 613 untreated participants not on lipid-lowering medications at baseline. Patients were then initiated on positive airway pressure and followed for 2 years. Sub-classification using propensity score quintiles, which aimed to replicate covariate balance associated with randomised trials and, therefore, minimise selection bias and allow causal inference, was used to design the treatment group comparisons. 199 positive airway pressure adherent patients and 118 non-users were identified.
At baseline, obesity was positively correlated with triglycerides and negatively correlated with total cholesterol, and low-density and high-density lipoprotein cholesterol. A small correlation was observed between the apnoea/hypopnoea index and high-density lipoprotein cholesterol. No effect of positive airway pressure adherence on 2-year fasting lipid changes was observed.
Results do not support the concept of changes in fasting lipids as a primary mechanism for the increased risk of atherosclerotic cardiovascular disease in OSA.
Abstract
Fasting lipid changes are unaffected by positive airway pressure and thus don’t increase cardiovascular risk http://ow.ly/vSEdq
Introduction
Obstructive sleep apnoea (OSA) is independently associated with atherosclerotic disease [1], but the mechanisms remain unclear. Dyslipidaemia is central to atherosclerosis, with a strong association between lipid levels and risk of atherosclerotic cardiovascular disease [2]. Consequently, dyslipidaemia has been implicated as a possible mechanism linking OSA with atherosclerosis. However, studies to date have not definitively established a relationship between the lipid profile and either OSA or positive airway pressure treatment [3–16].
OSA is characterised by repetitive collapse of the upper airway causing chronic intermittent hypoxia. Animal models demonstrate dyslipidaemia proportional to chronic intermittent hypoxia severity and development of atherosclerotic lesions [9–11, 17–21]. However, while studies in mice support a causal relationship between chronic intermittent hypoxia and dyslipidaemia, human studies evaluating the effects of OSA [3–11] and positive airway pressure treatment [8–16] on lipid levels are inconsistent. Moreover, studies examining positive airway pressure are of limited duration, following patients for at most 6 months [8–16].
When examining inconsistencies in the effect of positive airway pressure, one important consideration is the impact of selection bias within observational studies. Propensity score methodologies are well-established techniques used in numerous fields, including cardiovascular research [22], to minimise bias and perform comparative effectiveness research in observational studies. A recent National Heart, Lung, and Blood Institute working group highlighted the importance of such methods within observational samples [23], which are more inclusive of real-world patients than typical randomised trials. As previously discussed [24, 25], sub-classification using a propensity score is performed without regard to outcome data, allowing the “design” of nonrandomised comparisons to examine treatment effects. In observational studies, propensity scores are analogous to randomisation, eliminating systematic biases in nonrandomised group comparisons due to imbalance from measured covariates, thus improving causal inference [25]. Therefore, propensity score methods allow treatment effect analyses to proceed as if patients were randomised [24, 25].
Using the Icelandic Sleep Apnoea Cohort [26, 27], sub-classification by propensity score quintiles was employed to compare fasting lipid level changes between positive airway pressure adherent patients and non-users, 2 years after OSA diagnosis and treatment initiation. We also explored associations for obesity and OSA severity with the fasting lipid profile. We hypothesised that there would be a relationship between OSA severity and fasting lipids at baseline, and that positive airway pressure would improve fasting lipids in adherent subjects compared to non-users in the propensity score designed comparison.
Methods
Study subjects
Patients were diagnosed with moderate-to-severe OSA (apnoea-hypopnoea index (AHI) ≥15 events·h−1) and referred for positive airway pressure treatment. Participants completed standardised questionnaires, physical examination, a type III sleep study, fasting morning blood samples and abdominal MRI (magnetic resonance imaging) at baseline. 2 years after positive airway pressure treatment initiation, participants were invited for a follow-up visit where they answered the same questionnaires, underwent physical examination and anthropometric measures and fasting morning blood samples were taken, as in baseline assessment. Analyses were restricted to patients not using lipid-lowering medications. Details of the analysis sample obtained from the Icelandic Sleep Apnoea Cohort are presented in figure E1 and have been published previously [26, 27]. Written consent was obtained from every participant. The study protocol was approved by the National Bioethics Committee, the Data Protection Authority of Iceland and the University of Pennsylvania Institutional Review Board (Philadelphia, PA, USA).
Blood samples
Fasting blood samples were taken the morning after sleep in untreated participants at baseline and follow-up (online supplementary material). Total cholesterol, high-density lipoprotein cholesterol (HDL-C) and triglyceride concentrations were measured. Low-density lipoprotein cholesterol (LDL-C) was calculated using the Friedwald equation (LDL-C = total cholesterol – HDL-C – triglyceride/5). Indicators of “abnormal” levels were defined using the National Cholesterol Education Program (NCEP) Adult Treatment Panel III (ATPIII) criteria [28]: total cholesterol ≥200 mg·dL−1, LDL-C ≥130 mg·dL−1, triglycerides ≥150 mg·dL−1 and HDL-C <40 mg·dL−1.
Positive airway pressure adherence
Patients were followed for 2 years after positive airway pressure treatment initiation. Positive airway pressure adherence was based on objective usage data from memory cards over the last 28 days, if available, or else on subjective questionnaires (validation of subjective criteria presented in online supplementary material). Adherent patients used positive airway pressure for ≥4 h per night and for ≥20 of the last 28 nights based on usage data from memory cards, or for ≥60% of the night and for ≥5 nights per week based on the questionnaire. Non-users did not use positive airway pressure and had no other specific OSA therapy, including surgery or a mandibular advancement device. The sample included 240 (51%) adherent patients and 156 (33%) non-users. 71 (15%) partial-users (patients using positive airway pressure, but not meeting “adherent” criteria) were excluded from treatment effect analyses.
Statistical analysis
Baseline associations
Continuous and categorical covariates are presented as mean±sd and percentages, respectively, and compared among groups with T-tests or ANOVA and Chi-squared or Fisher’s exact tests. Baseline lipid levels were natural log transformed for normality; associations with obesity and OSA severity were assessed using Pearson correlations.
Propensity score methodologies
We used sub-classification by propensity score quintiles to select samples of adherent patients and non-users in which to assess the positive airway pressure treatment effect, based on an established heuristic described by Maislin and Rubin [24]. Briefly, the heuristic consists of three stages that can be repeated as necessary in order to satisfy a set of “propensity score diagnostics” [24]. First, a main effects propensity score model including all desired covariates is fitted to obtain propensity score quintiles. Secondly, within-quintile bias effect sizes and other propensity score diagnostic information are analysed to identify the most important cross-product and squared terms for inclusion in the propensity score model. Thirdly, a propensity score model including all main effects and relevant cross-product and squared terms is estimated, and subjects in each treatment group with insufficient “covariate overlap” (as defined by the propensity scores) are excluded from the sample.
Of 240 adherent patients and 156 non-users in the observational sample, we identified 199 (83%) adherent patients and 118 (76%) non-users balanced within propensity subclass for baseline age, sex, body mass index (BMI), current smoking, presence of hypertension, cardiovascular disease and diabetes, exercise participation, excessive alcohol use, Epworth Sleepiness Scale (ESS), OSA severity (AHI, oxygen desaturation index, arterial oxygen saturation (SaO2) nadir, and percentage of time at SaO2<90) and fasting lipid levels (total cholesterol, LDL-C, HDL-C and triglycerides). Balance with respect to the included covariates was shown to be as good as that expected from randomisation, strengthening causal inferences. Additional details and references about propensity score methodology are detailed in the online supplementary material.
Treatment effect analyses
Using untransformed values, 2-year fasting lipid changes were calculated within subject. Treatment differences were assessed using ANCOVA, controlling for propensity score subclass and baseline lipid levels. Whether obesity moderated the association between positive airway pressure and lipid changes was tested using a positive airway pressure by BMI group interaction effect. Given limited power for interaction tests, treatment group comparisons were examined within BMI strata (<30, 30–35 and ≥35 kg·m−2) regardless of interaction results. There was ∼90% power to detect treatment differences explaining 2.5% of variability (R2) in lipid changes (online supplementary material).
Results
Baseline study population
A comparison of the 193 (24%) users of lipid-lowering medication and 613 (76%) non-users is presented in table E1. Users were older (p<0.0001), had higher AHI (p=0.039) and percentage of time at SaO2<90% (p=0.023), and greater prevalence of hypertension (p<0.0001), diabetes (p<0.0001) and cardiovascular disease (p<0.0001) compared to lipid-lowering medication non-users. Medication users had similar BMI, HDL-C and triglyceride levels as non-users, but lower total cholesterol (p<0.0001) and LDL-C (p<0.0001).
table 1 shows baseline characteristics for lipid-lowering medication non-users stratified by BMI. Obese patients were younger, participated less in exercise, and had more prevalent hypertension and diabetes and more severe OSA. Compared to subjects with a BMI <30 kg·m−2, patients with a BMI ≥35 kg·m−2 had lower total cholesterol, LDL-C and HDL-C, but higher triglyceride levels (all p<0.02).
MRI was available in 501 (82%) subjects. The reasons for missing MRI included claustrophobia (n=66), poor quality images (n=33), very high obesity (n=6) and nonspecific reasons (n=7). Table E2 compares patients with and without MRI.
Baseline associations with fasting lipids
Associations with baseline fasting lipids for obesity measures and OSA severity in lipid-lowering medication non-users are shown in tables 2] and E3. BMI, weight, neck circumference and waist circumference were negatively correlated with total cholesterol, LDL-C and HDL-C, and positively correlated with triglycerides. Waist-to-hip ratio correlated with HDL-C and triglycerides only. All MRI fat measures were positively correlated with triglycerides; visceral fat was negatively correlated with HDL-C. AHI was positively correlated with HDL-C. No other correlations between OSA severity and lipid levels were observed.
Propensity score designed observational study
Sub-classification using propensity score quintiles identified 199 (83%) adherent patients and 118 (76%) non-users meeting model assumptions assuring that, within subclass, distributions of included baseline covariates were the same for both groups. Table E4 compares patients who were included and excluded from the propensity score designed comparison.
Demographics and covariate balance
figure 1, a modified version of a Love plot [29], and table 3 show that our propensity score designed study resulted in baseline covariate balance between adherent patients and non-users (see Methods). In the original observational cohort, eight out of 18 covariates were significantly different between adherent patients and non-users (fig. 1). After adjusting for propensity score subclass in the designed study, no baseline covariate differences remained (table 3).
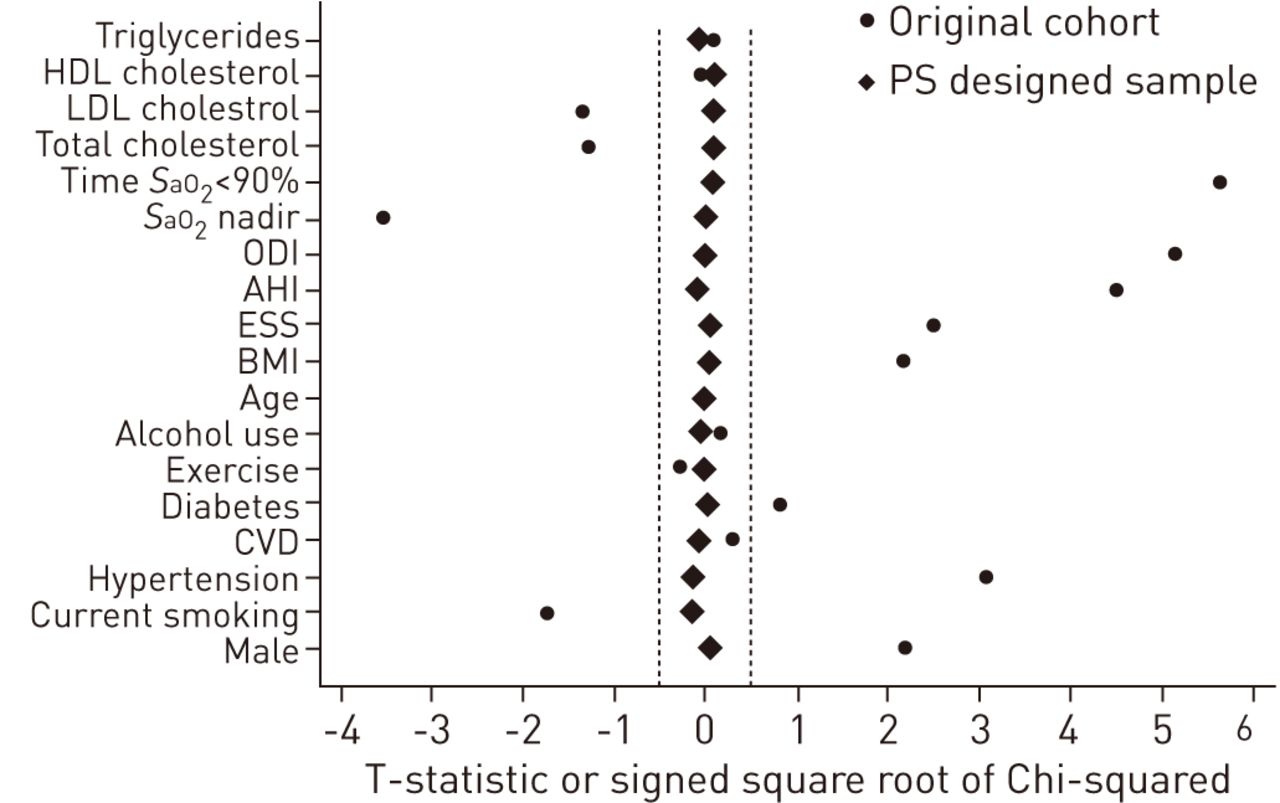
A modified version of a Love Plot [29] illustrating the balance in covariates between positive airway pressure adherent patients and non-users in the original cohort and after controlling for propensity score (PS) subclass within the designed cohort. The plot shows the T-statistic or signed square root of the Chi-squared comparing covariates between groups. While a number of covariates were significantly different prior to sub-classification, after controlling for PS subclass in the designed cohort all statistics are close to zero. HDL: high-density lipoprotein; LDL: low-density lipoprotein; SaO2: arterial oxygen saturation; ODI: oxygen desaturation index; AHI: apnoea/hypopnoea index; ESS: Epworth Sleepiness Scale; BMI: body mass index; CVD: cardiovascular disease. ·····: absolute value of statistic <0.5.
table 3 also summarises 2-year follow-up characteristics of the selected patients. We observed significant differences between groups in BMI, ESS and smoking status. Both positive airway pressure groups had lower ESS scores at follow-up, but adherent patients had greater decreases than non-users (p=0.002). Adherent patients also had increased BMI at follow-up compared to non-users (p<0.0001). Non-users were more likely to become smokers (p=0.004); 86% of patients who became smokers had a previous smoking history.
Differences in fasting lipid changes between positive airway pressure adherent patients and non-users
Summary measures of fasting lipid levels are presented in table 3. Since baseline lipid levels were included in the propensity score heuristic, there were no differences in fasting lipids between adherent patients and non-users at baseline.
table 4 and figure 2 show 2-year fasting lipid changes between adherent patients and non-users, adjusted for propensity score subclass and baseline lipid level. We observed no significant differences in lipid changes between positive airway pressure groups, overall or within BMI strata. There was no evidence for interaction between positive airway pressure and BMI group.

The 2-year fasting lipid changes are shown for positive airway pressure adherent patients and non-users, adjusted for propensity score subclass and baseline lipid level. There were statistically significant increases in total cholesterol (TC; p=0.003 in adherent patients and p=0.002 in non-users) and high-density lipoprotein cholesterol (HDL-C; p<0.0001 in both positive airway pressure groups) over 2 years, but there was no change in low-density lipoprotein cholesterol (LDL-C) or triglycerides (TG). There were no differences in 2-year fasting lipid changes between adherent patients and non-users. Data are presented as mean with 95% CI.
We examined differences in changes in the proportion of patients with abnormal lipid levels (table E5); there were no differences between positive airway pressure adherent patients and non-users in the overall sample. Within subjects with a BMI <30 kg·m−2, the decrease in proportion of patients with abnormal HDL-C was greater in adherent patients compared to non-users (p=0.024) (table E5). The reason for this result is unclear, given that there were no differences between positive airway pressure groups for mean HDL change (p=0.750) (table 4) or the proportion of patients near the abnormal HDL-C cut-off point (p>0.46) in patients with BMI <30 kg·m−2. We found no differences between adherent patients and non-users in the change in proportion of patients with abnormal HDL-C in other BMI strata. There were no associations between the positive airway pressure group and the change in proportion of patients with abnormal levels of other lipid measures.
Positive airway pressure effect within meaningful subgroups
Patients with abnormal baseline lipid levels
We examined the patients exhibiting abnormal lipid levels at baseline, where we would expect the greatest positive airway pressure treatment effect. No group differences in fasting lipid changes were observed (table E6). We found a significant interaction between positive airway pressure and BMI group for LDL-C change (p=0.041), probably driven by qualitative differences in the observed non-significant effects.
Patients with the most severe hypoxia
To compare results with recent data from animal models [9–11, 17–21], we limited our sample to patients in the top quartile of percentage of time at SaO2<90%. No differences in fasting lipid changes between positive airway pressure adherent patients and non-users were observed (table E7).
Discussion
In a large cohort of moderate-to-severe OSA patients, this study used sub-classification by propensity score quintiles to minimise bias in the estimated differences between positive airway pressure adherent patients and non-users. This observational study design involved using an algorithm that selected patients without regard to outcome data so that within subclass, measured demographic and baseline variables achieved balance that was at least as good as that expected through randomisation. Results do not support the hypothesis that positive airway pressure significantly affects 2-year changes in fasting lipid levels. Thus, increased risk of cardiovascular events and atherosclerosis in OSA patients is unlikely to be related to mechanisms involving the fasting lipid profile.
Despite evidence associating OSA with atherosclerotic cardiovascular disease [1], and the relationship between dyslipidaemia and atherosclerosis [2], no definitive evidence points towards dyslipidaemia as the mechanism linking OSA and atherosclerosis in humans [3–16]. We found no convincing association between OSA severity and fasting lipids, only a weak positive correlation between AHI and HDL-C, implying protection against atherosclerosis. Instead, we observed correlations between obesity and fasting lipids. Multiple obesity measures were positively correlated with triglycerides and negatively correlated with HDL-C, consistent with associations between obesity and “atherogenic dyslipidaemia”, characterised by elevated triglycerides and decreased HDL-C and associated with cardiovascular risk [30]. We found significant, but weak, negative correlations between obesity and total cholesterol and LDL-C. Obesity is associated with reduced lipoprotein lipase activity and increased production of very low density lipoprotein [30]. Given the role of lipoprotein lipase in the conversion of very low density lipoprotein into LDL-C, this reduced activity may explain these negative correlations with LDL, as well as the increased triglycerides [31].
To our knowledge, this study is the longest study to date exploring the relationship between positive airway pressure and fasting lipids. This study focuses on the utility of propensity score methodologies in the principled design of observational studies, which substantially strengthens causal inference. These methods were used to select adherent patients and non-users with balance for measured covariates similar to that expected through randomisation. Although balance is achieved for included variables, a limitation of the propensity score methodologies is the inability to address unobserved variables, which are theoretically controlled for in the context of a randomised controlled trial. While we recognise the potential for presently unknown or unmeasured confounders to influence results, we included as many relevant variables as possible. Including a large number of relevant covariates in the propensity score model reduces the likelihood that unknown or unmeasured confounders significantly affect results, since variables not included in the propensity score model are controlled for to the extent that they are correlated with those that are included.
We found no differences in 2-year fasting lipid changes between positive airway pressure adherent patients and non-users. There is no definitive clinical evidence supporting lipid changes with positive airway pressure [8–16]. One randomised trial showing decreases in cholesterol was retracted [32]. Phillips et al. [15] explored the effect of 2 months of positive airway pressure on postprandial lipidaemia over 24 h, observing decreased postprandial triglycerides and total cholesterol associated with positive airway pressure use, and a small corresponding decrease in HDL. We did not study postprandial lipids; it is possible that positive airway pressure use could have affected these. However, we note that Phillips et al. [15] also observed no significant effect of positive airway pressure usage on fasting lipid levels, supporting our conclusions. Kohler et al. [13] found that 2 weeks of positive airway pressure withdrawal was associated with a significant decrease in triglycerides compared to continued therapeutic positive airway pressure, as well as increased blood pressure and catecholamine levels. Thus, over the short-term, there was no dyslipidaemia produced by OSA.
Rodent models more convincingly demonstrate dyslipidaemia proportional to duration and severity of chronic intermittent hypoxia [9–11, 17–21]. Li et al. [19] found increased fasting serum lipids in lean C57BL/6J mice exposed to 4 weeks of severe chronic intermittent hypoxia (inspiratory oxygen fraction 5%); no change was observed with moderate chronic intermittent hypoxia (inspiratory oxygen fraction 10%) [19]. In an attempt to replicate this in humans, we restricted our sample to the top quartile of hypoxia severity, with little change in results (table E7). Recent publications [20, 21] suggest chronic intermittent hypoxia induces dyslipidaemia and atherosclerosis by inhibiting clearance of triglyceride-rich lipoproteins. In mice, chronic intermittent hypoxia increases angiopoietin-like 4 (Angptl4) expression in adipose tissue via upregulation of hypoxia-inducible factor-1α [20, 21]. Increased Angptl4 inhibits activity of adipose lipoprotein lipase, inhibiting triglyceride-rich lipoproteins clearance and resulting in increased cholesterol and triglycerides [20, 21]. While nocturnal hypoxaemia severity (but not BMI or AHI) correlated with Angptl4 mRNA levels in subcutaneous adipose tissue of obese bariatric surgery patients [21], more research is needed to determine the relationship between Angptl4 and atherosclerosis in apneics. Conceivably, differences exist in molecular pathways between humans and mice. A mechanism other than dyslipidaemia is suggested by Drager et al. [14] who observed no difference in lipid changes in severe OSA patients randomised to positive airway pressure versus no treatment, but decreases in carotid intima-media thickness and carotid-femoral pulse-wave velocity, two early atherosclerosis markers.
24% of our patients used lipid-lowering medications. Given their known efficacy, analyses were performed in patients not using these medications. Conceivably, the effect of OSA on fasting lipids might be most apparent in patients on lipid-lowering medications, but the effect is masked by medication use. However, we observed no differences in lipid changes between positive airway pressure adherent patients and non-users with abnormal lipids not using lipid-lowering medications (table E6). Ultimately, in human populations with widespread screening for lipid abnormalities and use of lipid-lowering medications, whether OSA contributes to lipid levels may be unanswerable. Based on current results and previous publications, we conclude that, given widespread use of lipid-lowering medications, changes in fasting lipid levels are not the mechanism by which OSA contributes to cardiovascular risk.
Despite there being no relationship between positive airway pressure and fasting lipid changes, we observed effects on BMI and subjective sleepiness changes, as in previous publications [33, 34]. Adherent patients had an average increase in BMI of 1 kg·m−2 over follow-up, compared to no change in non-users, confirming a recent report from the Apnea Positive Pressure Long-term Efficacy Study (APPLES) study [33]. While the mechanism causing increased BMI in positive airway pressure adherent patients is unclear, previous studies have suggested increased energy expenditure associated with OSA, and that positive airway pressure treatment reduces this expenditure [33, 35, 36]. Decreased energy expenditure among adherent patients, in the absence of increased exercise or dietary changes, could result in weight gain. Both positive airway pressure groups reported less subjective sleepiness at follow-up, but positive airway pressure adherent subjects had a significantly larger mean ESS decrease than non-users (4.0 versus 2.5 points). Previous research with sham-continuous positive airway pressure showed reductions in subjective sleepiness attributed to a placebo effect [34]. While the reduction in sleepiness in our non-users is unexplained, it cannot be produced by a placebo effect.
Our study has strengths, but some limitations. The Icelandic population is a population of European descent and clinical practice in Iceland is identical to that in other countries. Results are expected to be generalisable to moderate-to-severe OSA patients of similar ethnicity. However, additional studies involving populations that include other ethnicities would be useful for increasing generalisability. The sample reflects the Icelandic population diagnosed with OSA, but consequently contains a relative lack of females. Our sample contained patients with moderate-to-severe OSA and no control population, potentially limiting the ability to observe correlations between OSA severity and fasting lipids. However, positive airway pressure non-users provided a “control” sample for analyses of OSA treatment response. While patients were treated with positive airway pressure over 2 years, the design of the cohort was such that adherence information was obtained over the period closest to follow-up. The reason for this was two-fold: 1) adherence information most proximal to the follow-up reassessments was believed to be the most relevant; and 2) levels of compliance near the 2-year follow-up are probably representative of overall adherence, as several publications have shown a significant relationship between early and long-term positive airway pressure compliance [37–40]. Detailed phenotyping allowed for assessment of various confounders, however, we cannot exclude the potential for unmeasured or unknown covariates to influence results.
We have shown how sub-classification by propensity scores strengthens the causal inferences permitted by the data. The approach allows simultaneous control for a greater number of covariates than multivariable regression. Compared to regression adjustment, propensity methods are applied at the design stage without access to outcome data, thereby reducing bias. Our approach was more inclusive of all real-world patients, a benefit compared to typical randomised trials, while addressing the challenge of selection bias by essentially reconstructing a stratified randomised design. Propensity score methodologies should be considered whenever nonrandomised group comparisons are required, as advocated by the National Heart, Lung and Blood Institute [23].
In conclusion, our study does not support a role for OSA in determining the fasting lipid profile. While dyslipidaemia is a well-recognised atherosclerosis risk factor, our results suggest that changes in fasting lipids are not the mechanism for the increased atherosclerotic cardiovascular morbidity and mortality seen in OSA.
Acknowledgments
We are grateful to Muredach Reilly (Cardiovascular Institute, Perelman School of Medicine at the University of Pennsylvania, Philadelphia, PA, USA) and Daniel Rader (Division of Translational Medicine and Human Genetics, Perelman School of Medicine at the University of Pennsylvania) for helpful discussions, and to Sigrun Gudmundsdottir, Lovisa Gudmundsdottir, Magdalena Osk Sigurgunnarsdottir, Kristjan Andri Kristjansson, Erla Bjornsdottir (all Dept of Respiratory Medicine and Sleep, Landspitali – The National University Hospital of Iceland, Reykjavik, Iceland), Bethany Staley, Matthew Thorne-Fitzgerald, Robert Hachadoorian (Center for Sleep and Circadian Neurobiology, University of Pennsylvania) and the Sleep Center staff at Landspitali – The National University Hospital of Iceland and the University of Pennsylvania, who helped assemble and analyse the data.
Footnotes
This article has supplementary material available from erj.ersjournals.com
Support statement: This work was supported by the National Institutes of Health (grant number HL094307), the Eimskip Fund of the University of Iceland and the Landspitali University Hospital Science Fund.
Conflict of interest: Disclosures can be found alongside the online version of this article at erj.ersjournals.com
- Received March 6, 2014.
- Accepted April 12, 2014.
- ©ERS 2014
References


