


Abstract
Heart rate fluctuations are a typical finding during obstructive sleep apnoea, characterised by bradycardia during the apnoeic phase and tachycardia at the restoration of ventilation. In this study, a time-frequency domain analysis of the nocturnal heart rate variability (HRV) was evaluated as the single diagnostic marker for obstructive sleep apnoea syndrome (OSAS).
The predictive accuracy of time-frequency HRV variables (wavelet (Wv) decomposition parameters from level 2 (Wv2) to level 256 (Wv256)) obtained from nocturnal electrocardiogram Holter monitoring were analysed in 147 consecutive patients aged 53.8±11.2 yrs referred for possible OSAS.
OSAS was diagnosed in 66 patients (44.9%) according to an apnoea/hypopnoea index ≥10. Using receiver-operating characteristic curves analysis, the most powerful predictor variable was Wv32 (W 0.758, p<0.0001), followed by Wv16 (W 0.729, p<0.0001) and Wv64 (W 0.700, p<0.0001). Classification and Regression Trees methodology generated a decision tree for OSAS prediction including all levels of Wv coefficients, from Wv2 to Wv256 with a sensitivity reaching 92.4% and a specificity of 90.1% (percentage of agreement 91.2%) with this nonparametric analysis.
Time-frequency parameters calculated using wavelet transform and extracted from the nocturnal heart period analysis appeared as powerful tools for obstructive sleep apnoea syndrome diagnosis.
- autonomous nervous system activity
- electrocardiogram holter monitoring
- heart rate variability
- obstructive sleep apnoea syndrome
Obstructive sleep apnoea syndrome (OSAS) is a common prevalent problem 1 (prevalence of 4% in middle-aged males) with major health implications ranging from traffic accident 2 to serious cardiac arrhythmias. OSAS is associated with increased risks of hypertension, myocardial infarction and stroke, and with increased mortality rates 3, 4.
Diagnosis of OSAS is usually performed by polysomnography in a sleep laboratory, consisting of the measurement and recording of several signals used to analyse sleep and breathing. Whereas polysomnography represented the “gold standard” for the diagnosis, it is an expensive and time-consuming procedure with important resources invested inpatients with mild-to-moderate disease. Moreover, the laboratory environment often disturbs or interferes with the patient's sleep. Therefore, several strategies have been developed to decrease the number of the sleep recordings, including sleep questionnaires, ambulatory recordings, simplified multichannel systems and nocturnal oximetry, all showing a high specificity but a low sensitivity 5–7.
It is known that all through the night, recurrence of apnoeas elicits a typical and cyclic heart rate pattern consisting of cyclical brady/tachycardia 8, contrasting with an altered diurnal control of the sinus node, and is related to cyclic changes in vagal and sympathetic activity. To quantify the unique heart rate rhythm induced by a successive alternance of vagal stimulation and sympathetic discharge 9, 10, spectral analysis of heart rate variability (HRV) has been applied using short-term night-time recording. However, such a technique encounters major difficulties like the nonstationary pattern of data, the complex definition of the appropriate spectral band to capture the pathological rhythm, and the requirement of interpolation and resampling prior to signal processing. To avoid the stationary requirements, the time-frequency method of wavelet (Wv) transform has been proposed 11. From a physiological point of view, this method, applied to RR interval time series, indicates a more accurate adaptation to autonomic blockade and allows time localisation of this adaptation. Using classical time-domain analysis of HRV, the authors recently demonstrated that 24‐h monitoring may be a useful tool to diagnose OSAS and to identify obstructive sleep apnoea during nonrapid eye movement (NREM) sleep 12.
The goal of this study was to assess whether a time-frequency method of Wv transform could yield essential information on the diagnosis of OSAS. For that purpose, the sensitivity and specificity of this methodology of HRV analysis was evaluated during a full night's electrocardiogram (ECG) recording, in a large group of unselected patients examined for possible sleep-related breathing disorders.
Subjects and methods
Study group
The population studied consisted of 147 patients (101 males and 46 females) with a mean±sd age of 53.8±11.2 yrs, referred to the university hospital for clinically suspected OSAS. Exclusion criteria were permanent or paroxysmal atrial fibrillation, diabetes mellitus, Shy-Drager syndrome, and permanent ventricular or atrial pacing; none of them received antiarrhythmic drugs or digitalis. The HRV analysis and the polygraphic scoring were done by two independent scorers, each one blinded to the results of the other.
Sleep study and polysomnography scoring
OSAS was diagnosed on the basis of clinical criteria and on the polysomnography performed, following the recommendations of the American Sleep Disorders Association 13. The presence and stages of sleep were monitored using two pairs of electroencephalographic leads (C4‐A1, O2‐A1), two pairs of electro-oculographic leads and chin electromyographic leads. Airflow was measured by an oronasal thermocoupler. Respiratory efforts were monitored using inductive plethysmography, with transducers placed around the chest and the abdomen. Arterial oxygen saturation (Sa,O2) was recorded continuously by pulse oximetry (Criticare Systems Inc., Waukesha, WI, USA) during the whole night period. The polysomnogram was scored manually according to standard criteria 14, 15.
Respiratory events were scored using criteria proposed by the American Academy of Sleep Medicine. Hypopnoeas were defined as a ≥50% reduction in airflow from the baseline value lasting for ≥10 s and associated with a 3% desaturation or an arousal. Apnoeas were defined as the absence of oronasal airflow lasting for >10 s. Obstructive apnoea was defined as the absence of airflow for >10 s in the presence of persistent respiratory efforts. The apnoea/hypopnoea index (AHI) was established as the ratio of the number of apnoeas and hypopnoeas per hour of sleep. As an index of nocturnal hypoxaemia, the total time with Sa,O2 <90% was considered. AHI ≥10 was chosen as the threshold to identify the presence of OSAS.
Simultaneous electrocardiogram Holter monitoring and heart rate variability analysis
The nocturnal recordings (duration 7.3±1.1 h) were analysed on a Novacor system (Rueil-Malmaison, France) model, equipped with the HRV module. To perform the analysis, each QRS complex was validated and the length between each QRS (RR interval) calculated. Only normal-to-normal beats were considered for analysis with intervals excluded due to ectopy or artefacts being replaced by holding the previous coupling interval level throughout the time interval to the next valid coupling interval. The ECG Holter system allowed extracting the list of RR intervals with a precision of 1/200 s. Then, a 2.4 Hz resampling process was applied.
Wavelet analysis
Unlike Fourier, Wv transform is devoted to the analysis of nonstationary signals 16, 17. Thus, there is no prerequisite regarding the stability of the frequency content along the signal analysed. This analysis allows the extraction of the characteristic frequencies contained along a signal, which, in this case, was composed of consecutive intervals between RR interval series. The decomposition of a signal by Wv transform requires an adequate regular and localised mother function. Starting from this initial function, a family of functions is built by dilatation and translocation, which constitutes the so-called Wv frame. The analysis consists of sliding a window of different weights (corresponding to different levels) containing the Wv function, all along the signal. The calculation gives a serial list of coefficients named Wv coefficients, which represent the evolution of the correlation between the signal f and the chosen Wv at different levels of analysis (or different ranges of frequencies) all along the signal f. In this analysis, the Daubechies four Wv transform was used 18. For each record, the Wv coefficients were calculated on sets of 512 RR intervals, giving eight separate levels of analysis named Wv2, Wv4, Wv8, Wv16, Wv32, Wv64, Wv128 and Wv256. Then, the variability power, level by level, was calculated as the sum of squares of the coefficients. Thus, for each recording, the variability power for each level was obtained. The sum of Wv power coefficients at levels 2, 4 and 8, approximately corresponds to the Fourier high frequencies (an index of parasympathetic activity), Wv power coefficients at levels 16 and 32 roughly corresponds to the Fourier low frequencies, and Wv power coefficients at levels 64 and 128 to the Fourier very low frequencies.
Statistical analysis
Differences were considered as significant for p<0.05. Values were expressed as mean±sd. Statistical analyses were performed to evaluate the ability of the variables to discriminate between affected (OSAS+) and nonaffected (OSAS−) status. Thus, the dependent variable was the diseased state (OSAS+). The independent variables analysed were Wv levels from Wv2 to Wv256. Receiver-operating curve (ROC) analysis was used 19, 20, with the areas under the curves represented by the letter W. A W value of 0.5 means that the distributions of the variables are similar in both populations. Conversely, a W value of 1.0 means that the distributions ofthe variables of two populations do not overlap at all. Stepwise regression analysis was used to confirm the previously performed ROC curves analysis. The dependent variable was represented by the AHI and the independent variables included were the Wv levels, which demonstrated a significant W value with ROC curves.
A classification tree was then built using the discriminant variables as indicated by the ROC curves. The first variable used was the one determining the best separation between diseased and nondiseased subjects. The other variables were then introduced according to a descending order of discriminative capacity. For each continuous variable, the cut-off value acting as a separator to make the decision was chosen as that offering the smallest number of misclassification, i.e. that which minimises the sum of false-positive and false-negative results. Sensitivity, specificity and percentage of agreement were calculated on a learning sample of this last analysis. The principle of the Classification and Regression Trees (CART) method is to look at all possible splits for all variables included in the analysis i.e. the Wv levels. The results are in the form of an inverted tree. CART begins with a root node and, through a process of yes/no questions, generates descendant nodes. Some nodes are terminal, meaning that a final determination for classification is reached while other nodes continue to be split until terminal nodes are reached. The first topic addresses the method CART uses to select its questions for splitting nodes. The next activity is to rank order each splitting rule on the basis of a goodness-of-split criterion. Once a best split is found, CART repeats the search process for each child node, continuing recursively until further splitting is impossible or stopped. Then, CART proceeds by growing trees until it is not possible to grow them any further. It generates a maximal tree and a set of subtrees. Cross-validation was followed by dividing the learning sample into 10 approximately equal parts containing similar distributions for the dependent variable. The results of the 10 minitest samples were finally combined to form an error rate for trees of any possible size; these error rates are applied to the tree based on the entire learning sample. The outcome of this complex process is a set of fairly reliable estimates of the independent predictive accuracy of the tree.
Results
Table 1⇓ summarises the clinical variables of the patient group. OSAS was diagnosed in 66 patients (44.9%) using polysomnography recording. No significant differences in clinical characteristics, age and body mass index were found between OSAS+ and OSAS− patients.
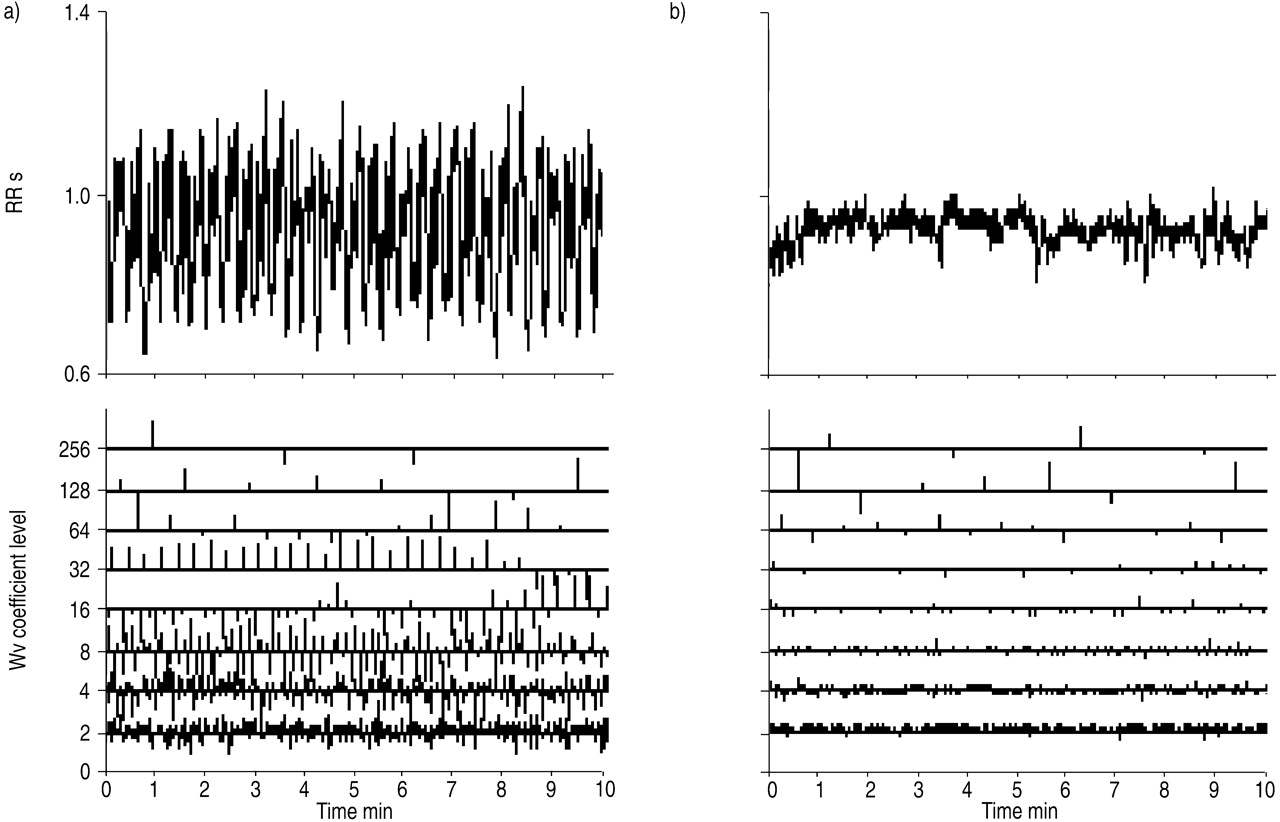
Wv decomposition of the HRV analysis during the night in a typical OSAS patient (AHI 40) is illustrated in figure 1⇓. With a subjective, first, visual approach, an enhancement of the coefficients for the levels Wv8, 16, 32, 64 and 128 can be noted, compared with a nonapnoeic patient.
ROC curves (continuous data) were built separately for each HRV variable (table 2⇓). All time frequency-domain variables (Wv2 to Wv256) calculated over the full night's recording were able to separate OSAS+ from OSAS− status with statistical significance (p<0.05). Three variables appeared as outstanding separators: Wv32 (W 0.758, p<0.0001), Wv16 (W 0.729, p<0.0001) and Wv64 (W 0.700, p<0.0001).
Results of the optimal tree built using CART methodology are presented in table 3⇓. Figure 2⇓ contains the essentials of the CART classification analysis. The classification tree diagram presents 20 terminal regions and 19 nodes of information. The Wv32 level represents the most important variable (first node) followed by Wv16, Wv8 and Wv64. Table 4⇓ shows that the number of misclassifications is very low on the learning sample with a total number of eight false positives and of five false negatives (fig. 2⇓). The sensitivity reached 92.4%, the specificity 90.1% and the percentage of agreement was 91.2% in this population.
Discussion
The most important finding of this study was that the recurrence of obstructive apnoeas determines a significant increase in the time-frequency components of the HRV. The alteration in the power coefficient of level 8, 16 and 32 was highly predictive of this sleep-related breathing disorder with a high sensitivity and specificity. The high prediction of OSAS based on the heart rate period analysis in these populations suggests that this methodology may be a potential simple and robust ambulatory screening method for diagnosis of OSAS patients 21.
Based on the typical oscillations in heart rate, firstly described by Guilleminault et al. 8, several devices have been used to diagnose OSAS, including short-term, time-frequency spectral analysis of the HRV shown as a diagnostically accurate method for detection of OSAS. Recent data on time-domain measurements published by the present group clearly demonstrated that the analysis of the time-domain HRV variables is a useful tool in OSAS screening 12. The accuracy of the present method was very high over 15‐min selected periods of NREM sleep. In addition, the specificity and sensitivity were found to be significantly greater compared with published data using oximetry. Interestingly, Shiomi et al. 9 demonstrated that this method is an easy tool not only for screening, but also for follow-up evaluation, showing a significant decrease in the very low-frequency component of HRV after mandibular advancement treatment. Despite its validity, standard HRV frequency-domain analysis did not appear an appropriate tool to quantify variations in very low-frequency oscillations, a stronger marker of obstructive apnoea. For this reason, it was hypothesised that repetitive low-frequency oscillation, frequency-domain analysis of the heart period could be a better predictor of OSAS 22. Compared with power spectral density of the very low frequency components (interbeat interval increment), Wv analysis gives a much higher specificity and also a higher sensitivity, without more intervention from the user. Applying the time-frequency analysis in a large group of unselected patients, this method was found to allow a better quantification of the frequency components associated with the obstructive apnoea events, with a highly discriminant power of three new variables discriminating patients with OSAS. Three levels of Wvs, Wv8, Wv16 and Wv32, are clearly predictive of the oscillations generated by the obstructive respiratory events. While the Wv8 level is usually considered as a parasympathetically mediated frequency 18, the Wv16 and Wv32 correspond to the low-frequency component of the classical Fourier transform. If Wv32 represents the first node of the regression tree for an OSAS defined with an AHI of >10, Wv16 and Wv8 levels appear in the ROC curve analysis as further strong predictive variables in order to predict OSAS. It could seem surprising that very low-frequency components (Wv64, Wv128) do not represent the most appropriate spectral band to capture the brady/tachycardia rhythm. The discordance in these results could be explained by the observation by Hilton et al. 11 that the low frequencies (0.01875–0.07383 Hz) correspond to the authors' Wv32 and Wv64 levels. From a practical point of view, an evaluation based on these three combined parameters, at least, should probably be proposed in a future prospective cohort of patients.
From the literature, Sa,O2 bears the same sensitivity but a lower specificity than the present Wv analysis. Specificity using Sa,O2 ranges 46–80% 5, 6. Furthermore, the authors did not intend to compare the sensitivity of Wv and Sa,O2 in this study, since the cost-effectiveness of the nocturnal Sa,O2 analysis has already been largely described in sleep apnoea syndrome detection.
Certain limitations of this study that could influence the results need to be considered. The first consideration is that patients with autonomic disorders or arrhythmias were excluded to limit false-negative results. However, complete polygraphy also carry some limitations and oximetry could be misleading by being unable to identify nonapnoeic nocturnal hypoventilation, as well as to underestimate the severity of sleep-related breathing disorders. Secondly, patients suspected of having OSAS were predominantly studied despite them belonging to a heterogeneous group in terms of AHI. Therefore, the sample may not fully represent the general population of patients referred to clinicians, and those having snoring or upper airway resistance syndrome. However, Stradling et al. 23, underlined that the autonomic arousals related to OSAS were better quantified using blood pressure variability 24, 25. In addition, O'Donnell et al. 26 demonstrate that digital vascular tone, measured by peripheral arterial tonometry, provides a reliable method to detect airway obstruction and arousal, reflecting the blood pressure and heart rate changes occurring during the upper airway obstruction.
Even though the methodology used in the present study may artificially increase the power of HRV analysis in OSAS patients, more extensive studies including patients with a wide range of sleep-disordered breathing could assess the validity and the diagnostic prediction of HRV analysis. Finally, the observed enhanced HRV found in these OSAS patients reflects the role of three factors, i.e. increase in negative oesophageal pressure, hypoxia and arousal occurring throughout and at the end of apnoea, all of which induce a strong increase in the parasympathetic system, followed by an abrupt sympathetic activation due to the consecutive hypoxia 27, 28. These cyclical and constant responses could be compared with the primary slow oscillations in heart rate generated by the central nervous system during Cheyne-Stokes or periodic breathing patterns 29, probably reflecting a loop response of the cardiopulmonary chemo- and/or baroreceptors. For these considerations it would be interesting to examine patients with central apnoeas in order to determine whether the same Wv variables could predict the presence of altered respiration during sleep.
In conclusion, time-frequency domain analysis of the nocturnal heart rate variability using Wavelet decomposition could represent an efficient marker of obstructive sleep apnoea syndrome. Its added ease of use and of interpretation is of interest considering the high prevalence of sleep-related breathing disorders in a general middle-aged, at-risk population. Further, studies considering larger populations, with a wide spectrum of sleep-related breathing disorders, need to be performed in order to determine whether this method may be an easy tool to use for the diagnosis of the whole spectrum of sleep-related breathing disorders on an ambulatory basis.

Wavelet (Wv) decomposition of the heart rate variability signal during the night in a) an obstructive sleep apnoea patient and b) a patient without sleep-related breathing disorders during a 10‐min sample duration.

Operation tree illustrating the combination of threshold values of wavelet (Wv) levels, characterising patients in the study. Sensitivity reaches 92.4% and specificity 90.1%. All individual numerical values are indicative of the number of subjects in each terminal node of the tree. TP: true positive, n=61; FP: false positive, n=8; TN: true negative, n=73; FN: false negative, n=5.
Clinical characteristics of the population
Time frequency-domain variables significantly associated with obstructive sleep apnoea syndrome by receiver-operating characteristic curve analysis
Relative importance of heart rate variability evaluated using Classification and Regression Trees methodology in order to predict obstructive sleep apnoea syndrome with an apnoea/hypopnoea index threshold value of 10
Cross-validation and misclassification by class (obstructive sleep anoea syndrome (OSAS)+/−) using Classification and Regression Trees methodology
Footnotes
-
↵ For editorial comments see page 870.
- Received November 17, 2002.
- Accepted July 1, 2003.
- © ERS Journals Ltd
References


