Article Text

Abstract
BACKGROUND Risks of lung cancer and of heart disease attributable to passive smoking have been evaluated mainly in non-smokers married to smokers, but there has been little quantitative assessment of the extent of exposure in marriage partners as indicated by markers of inhaled smoke dose.
OBJECTIVE To relate plasma cotinine concentrations in non-smoking English adults to the smoking behaviour of their partners and to demographic and other factors.
DATA Population survey. Data from two years (1994 and 1996) of the Health Survey for England.
MAIN OUTCOME MEASURES Plasma cotinine concentrations in non-smoking adults married to or cohabiting with a partner.
RESULTS There was a strong dose–response relation between cotinine concentrations in non-smoking adults and the smoking behaviour of their partners, rising from a geometric mean of 0.31 ng/ml in those with non-smoking partners to 1.99 ng/ml in those whose partners smoked 30 or more cigarettes per day. In addition, exposure was greater in men, in the autumn and winter, and in those living in more disadvantaged circumstances, and there was an increasing gradient of exposure from the south to the north of the country. On average, cotinine concentrations in non-smokers with a smoking partner were 0.6–0.7% of those in cigarette smokers.
CONCLUSIONS If cotinine is taken as a measure of risk relevant dose, the implied increase in risk of lung cancer in non-smokers with smoking partners is consistent with the risk observed in epidemiological studies. Smoking by partners in the home is a major source of non-smoking adults' exposure to passive smoking.
- passive smoking
- non-smoking partners
- cotinine
Statistics from Altmetric.com
Health effects of passive smoking in adults have been investigated mainly in non-smokers married to smokers. These studies have yielded consistent evidence of raised risks of both lung cancer and heart disease.1-4 Among children, adverse effects of parental smoking on a variety of conditions have been demonstrated,5 and these findings have been supplemented by extensive data on the extent of exposure as indicated by quantitative biomarkers which have shown the relative importance of mothers' and fathers' smoking and of demographic factors in determining exposure.6-9 There have been fewer quantitative studies of adults' exposure, and none in Britain that have been based on large and representative samples of the population. We here report on factors determining plasma cotinine concentrations in married or cohabiting non-smoking adults, using data from the Health Survey for England for 1994 and 1996. Our main focus is on the magnitude of the dose received by non-smokers with smoking partners, but we also consider a range of other potential determinants of passive smoking, including socioeconomic, demographic, seasonal, and regional effects.
Methods
The Health Survey for England is designed to generate a representative sample of the population living in private households in England. Using the postcode address file (PAF) as the sampling frame, a stratified random sample of households is identified. The survey has two stages. At the first stage, an attempt is made to interview all adults in eligible households, and the second stage is a nurse visit to take biological measures. In 1994 and 1996, 77% and 79% of eligible households cooperated with the survey interview. Smoking behaviour was ascertained at the initial interview, and blood for cotinine estimation was taken at the nurse visit, which usually took place about a week after the interview. In 1994, 15 809 adults were interviewed (92% of those in cooperating households), 13 731 saw a nurse, and 11 289 gave a blood sample. The comparable figures for 1996 were 16 443 (93%), 14 440 , and 12 158. In the two years combined, 67% of adults in cooperating households both participated in the interview and provided a blood sample. A full description of the survey methodology is given in the reports for each year, which are also available online.10 11
SMOKING BEHAVIOUR
Smoking behaviour was ascertained by individual interview of each adult in the household in the same way in both 1994 and 1996. The interview was conducted using a computer aided schedule. Variables for the partner's smoking in a married or cohabiting couple were generated for each respondent by linking to that individual's own self reported smoking and plasma cotinine within the household. Thus within a couple each partner's smoking behaviour was measured by that individual's responses.
A summary index of socioeconomic disadvantage at the level of the household was computed by combining information on occupational class, access to a car, housing tenure, and current unemployment. Each of the following was scored with a 1: head of household's occupation manual; no access to a car; rented housing tenure; head of household currently unemployed. Thus the total score could range from 0 in the most affluent households to 4 in the most deprived.
Season of the year at which the interview was conducted was dichotomised into spring and summer (April to September) and autumn and winter (October to March). Region was divided into North, Midlands, and South & West.
STATISTICAL ANALYSIS
Because the distribution of cotinine values in non-smokers is positively skewed, they were subjected to logarithmic transformation. Non-detectable concentrations were assigned a value of 0.05 before transformation. Multiple linear regression analysis was used to examine demographic circumstances and partner smoking as predictors of cotinine concentration. For each predictor variable geometric mean concentrations adjusted for other predictor variables were derived from analyses of covariance, using a method in which main effects and covariates were entered simultaneously.
COTININE ASSAY
Plasma cotinine was assayed by gas chromatography using a method sensitive to concentrations as low as 0.1 ng/ml.12 This assay has been very widely applied in studies of active13 and passive14 smoking. Regular internal quality controls were run to ensure comparability and reliability of results over time.
Results
Of a total of 32 252 adults surveyed in 1994 and 1996, there were 22 168 self reported non-smokers, of whom 15 312 had a measured plasma cotinine. Detectable concentrations of cotinine were found in 90.3%. Some 547 of self reported non-smokers had cotinine concentrations above a cutpoint of 15 ng/ml used for determining current smoking,15 and these respondents were therefore excluded from the analysis; 208 of these were self reported never regular smokers (2.1% of all 9927 never smokers), and 339 were self reported ex-smokers (6.3% of all 5385 ex-smokers). Among the confirmed non-smokers, the geometric mean cotinine concentration was 0.41 ng/ml. We here focus on 9556 married or cohabiting confirmed non-smokers with complete data available on demographic and socioeconomic variables (4576 men and 4980 women). The geometric mean cotinine concentration in these respondents was 0.38 ng/ml, slightly lower than in all adult non-smokers. A cotinine concentration for the partner was available for 8277 of these.
Among these 9556 married or cohabiting non-smokers, a total of 1410 (14.5%) had a partner who was a current cigarette smoker, and a further 225 (2.5%) had a partner who smoked cigars or a pipe but not cigarettes. Cotinine concentrations in the non-smoking member of a couple were strongly related to the partner's smoking behaviour, rising from a geometric mean of 0.31 ng/ml when the partner was also a non-smoker to 1.99 ng/ml when the partner smoked 30 or more cigarettes per day (fig 1). Cotinine concentrations were similarly related to the measured cotinine concentration in the partner, rising from 0.31 ng/ml when partners' cotinine was less than 15 ng/ml to 1.30 ng/ml when it was over 400 ng/ml.

Geometric mean plasma cotinine concentrations in married or cohabiting non-smokers by daily cigarette consumption in their partners. Health Survey for England 1994 and 1996.
To examine which of these measures of partners' smoking behaviour better predicts exposure, table 1 presents cotinine concentrations in the non-smoking partner conjointly by partners' cigarette consumption and cotinine level. Partners smoking cigars or a pipe but not cigarettes were excluded from this analysis, as their reported cigarette consumption was zero, but their cotinine concentration could be raised. In this table the cotinine categories were chosen so as to match the numbers in the cigarette consumption categories as closely as possible, so that, for example, 86% said they were non-smokers and 86% were in the lowest cotinine category. At each level of partners' cotinine there was a steady trend to increasing exposure with partners' cigarette consumption. However, the converse was not true. When partner reported being a non-smoker, measured exposure increased with increasing spouse cotinine, but there was no trend to higher exposure by spouse cotinine at higher levels of cigarette consumption. Reported cigarette consumption by the partner thus emerged as unequivocally the better predictor of exposure, with their cotinine having a clear supplementary value only when at variance with their reported non-smoking status. This was confirmed by multiple linear regression analysis, which found partners' cigarette consumption and cotinine both to be significant predictors overall, but with cotinine ceasing to add significantly to cigarette consumption when those claiming to be non-smokers were excluded. Nevertheless, since both of these indicators overall had independent predictive value, both were retained in further analyses of exposure predictors.
Geometric mean cotinine concentrations by partner's cigarette consumption and plasma cotinine
MULTIVARIATE PREDICTION OF EXPOSURE: PARTNER SMOKING AND OTHER POTENTIAL PREDICTORS
The association of exposure with variables additional to partner smoking was examined both univariately and in multivariate models that simultaneously adjusted for all other predictors. Factors considered as potential predictors of exposure included age, sex, socioeconomic disadvantage, season of the year at which measurements were taken, region of the country, respondents' smoking history (never smoker; ex-smoker), presence of other smokers in the household, and marital status (married; cohabiting). A variable representing year of survey was also entered, in order to test for possible differences in exposure over time. Table 2 gives univariate and adjusted geometric means for each of these variables. Variables are listed in the table in their order of entry to a stepwise multiple linear regression analysis, and the multiple r 2 gives the cumulative proportion of variance explained. The p values are from the final multiple regression model.
Predictors of exposure to passive smoking in non-smoking adults
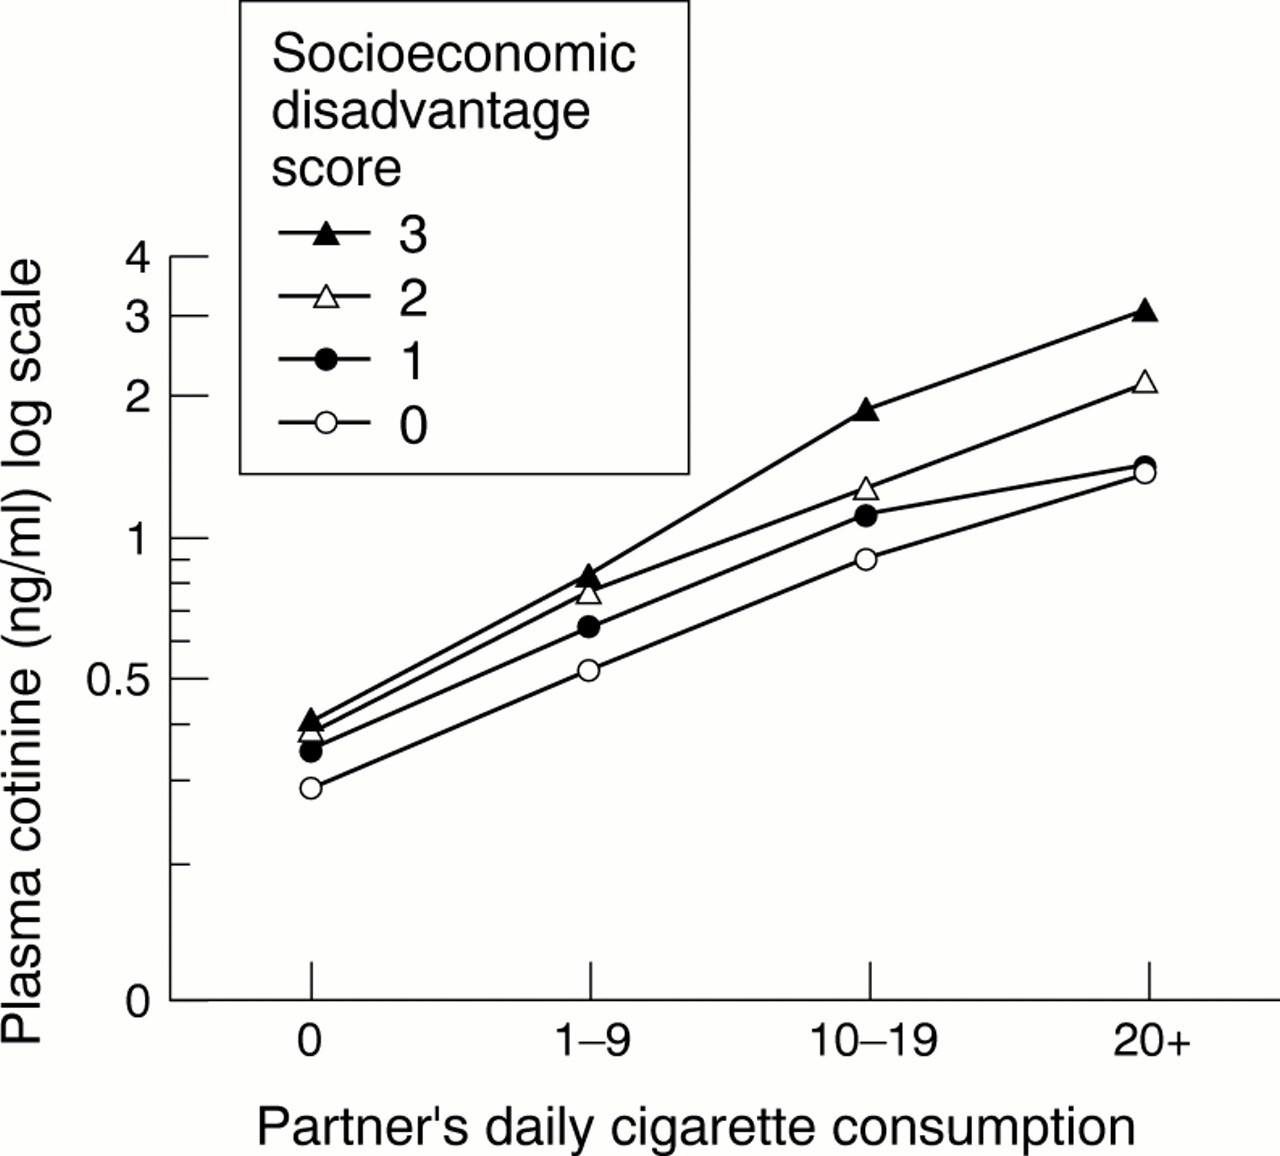
All of the variables listed in the table were significantly associated with exposure, both univariately and after adjustment for other predictors. After partners' cigarette consumption, which was confirmed as the main predictor, the main effects were associated with season of the year, sex, and socioeconomic disadvantage. Cotinine concentrations were some 0.1 ng/ml higher in autumn/winter than in spring/summer and a similar amount higher in men than in women. Both of these effects were little changed by adjustment for other predictors. The univariate difference of 0.5 ng/ml across categories of socioeconomic disadvantage was partly attributable to a higher incidence of partner smoking in those from more disadvantaged households. However, after adjustment for other predictors there remained a highly significant trend to higher exposure with increasing disadvantage, with exposure some 0.18 ng/ml higher in the most than in the least deprived category. As shown in fig 2, there was a gradient of exposure with increasing socioeconomic disadvantage at each level of partners' cigarette consumption.

Geometric mean plasma cotinine concentrations in non-smokers by partners' cigarette consumption and level of socioeconomic disadvantage.
Exposure was highest in those aged under 30, and lowest in those aged 60 and over, the adjusted mean difference amounting to 0.06 ng/ml. There was a gradient in exposure from the South and West through the Midlands to the North of the country, those living in the North having a mean cotinine that was 0.08 ng/ml higher than those in the South. Exposure was substantially higher in those from households where there were smokers other than the husband/wife present, but the size of this effect was much reduced after adjustment for other predictors. Exposure was a small amount higher in those who reported being ex-smokers rather than never smokers (adjusted mean difference 0.04 ng/ml), and in those who were cohabiting rather than married (0.05 ng/ml adjusted mean difference). Finally there was a small difference in exposure by year of survey, with average levels being 0.04 ng/ml higher in 1996 than in 1994. Partners' cigarette consumption by itself accounted for 14% of the variance in log cotinine, and the addition of all the other predictor variables brought the percentage of variance explained up to 20%. Predictors of exposure were closely similar in men and women (tables available oneTC).
PREDICTORS OF EXPOSURE IN NON-SMOKERS FROM NON-SMOKING HOUSEHOLDS
There was a marked range restriction in cotinine concentrations among non-smokers living in non-smoking households, with the median value in this group falling at 0.3 ng/ml and the 90th centile at only 1.1 ng/ml. We nevertheless thought it worthwhile to repeat our analysis of predictors of exposure in this subgroup, as any significant predictors would be likely to give an indication of factors of importance in determining exposure outside the home. As members of a couple would be likely to spend time in the same environments outside the home as well as within it, we included the cotinine concentration in the non-smoking partner as a potential predictor. The results are given in table 3, with variables again listed in their order of entry to a stepwise multiple regression analysis. The concentration of cotinine in the partner was easily the strongest predictor, with the simple correlation being 0.26. Exposure rose in a graded fashion from 0.23 ng/ml in those whose partners had undetectable cotinine to 0.74 ng/ml in those whose partners had a cotinine of 3 ng/ml or more. Adjustment for other predictors made essentially no difference to this association. Other predictors of exposure remained as in the earlier analysis, with male sex, autumn/winter season, higher levels of deprivation, younger age, and northern region all predicting higher exposure. Also, as in the earlier analysis, concentrations were slightly but significantly higher in 1996 as compared with 1994 and where the respondent was an ex- rather than never-smoker, and cohabiting rather than married. In total, these variables accounted for 10% of the variation in cotinine. Predictors of cotinine concentrations among non-smokers from non-smoking households were closely similar in men and women (table available oneTC).
Predictors of exposure in non-smokers living in non-smoking households
NON-SMOKERS' COTININES AS A PERCENTAGE OF ACTIVE CIGARETTE SMOKERS' COTININES
Table 4 gives the average cotinine concentrations in cigarette smokers from the two years of the survey and the values in non-smokers whose partners were cigarette smokers. The dose received by non-smokers expressed as a percentage of that in smokers was closely similar in the two years, and also did not differ much according to whether the estimate was based on arithmetic means or geometric means. The non-smoker dose in the two years combined was 0.69% of the smoker dose when expressed as an arithmetic mean and 0.63% when geometric means were used.
Mean cotinine concentrations in non-smokers with smoking partners as a percentage of cotinine concentrations in cigarette smokers
Discussion
This study provides new data on the extent of exposure of non-smoking adults in England to other people's tobacco smoke. Over 90% of respondents had measurable cotinine concentrations, indicating how difficult it is to avoid tobacco smoke altogether, but in the majority from non-smoking households exposure levels were low. Among the 14% who were married to or cohabiting with a cigarette smoker, cotinine concentrations showed a strong dose–response relation to the number of cigarettes smoked by the partner, indicating that smoking by partners is a major determinant of passive smoking among non-smoking adults. These are robust findings which were replicated in two years of the Health Survey for England.
Our study has a number of strengths. It was based on a large and representative survey of the general population, and included a measure of smoke uptake—plasma cotinine—in all adults living in the household. Cigarette smoking behaviour was reported directly by each partner, and is therefore likely to be more accurately measured than where the members of a couple report their partner's cigarette consumption. The proportion of adults in cooperating households who both participated in the interview and provided a blood sample yielding a valid cotinine assay was 64%. Individuals who did not provide a blood sample were more likely to be young and to come from homes where the head of household's occupation was manual.10-11However, the extent to which our findings are biased by differential participation rates is likely to be small. Since the under represented groups had higher measured levels of exposure, our findings are probably somewhat conservative, underestimating the extent of exposure in the population as a whole.
Of the two measures of partners' smoking, reported cigarette consumption and the corresponding plasma cotinine concentration, cigarette consumption was much the better guide to measured exposure in the non-smoking member of the couple. This stands in contrast to studies of smoking by mothers in pregnancy and birthweight in their babies, where maternal cotinine has consistently been found to be a stronger predictor than the number of cigarettes smoked.16-19 With passive smoking, it is the number of cigarettes lit and the sidestream smoke generated which determines exposure rather than the amount of smoke inhaled by the smoker himself or herself. Whether or not the smoker inhales has little bearing on ambient smoke levels. In our study the cotinine concentration in the smoking partner only added predictive power when it was at variance with their claimed non-smoking status. Since adults in a household were mostly interviewed together, this result is surprising, as their non-smoking partners would generally be well aware of whether or not they smoked. However, the overall impact of this misreporting of smoking status was small. Our measure of cigarette consumption did not differentiate between those smoked in the presence of the partner and those smoked outside the home at work or in other situations where they were not present. The slope of the dose–response relation we measured is therefore likely to underestimate the relation to cigarettes smoked in the partner's presence.
There are few comparable studies on adults in the literature. The Scottish Heart Health Study reported on cotinine concentrations in some 4000 men and women aged 40–59 years, but did not examine levels by spouse smoking.20 In the USA, Pirkle and colleagues reported on factors determining exposure in adults, using data from the Third National Health and Nutrition Survey (NHANES).21They found geometric mean serum cotinine concentrations of 0.15 ng/ml in those from non-smoking households and 0.73 ng/ml when there was one smoker in the household. The effects of smoking by partners and by others in the household were not distinguished in this study. The levels of exposure in the US study are lower than in the present study, both for non-smokers from non-smoking households (0.31 ng/ml here) and where the partner smoked cigarettes (1.02 ng/ml). These differences may reflect a number of factors, including: climate (generally warmer in the USA); different average room sizes; wider restrictions on smoking in public in the USA, limiting exposure outside the home; a different indicator of exposure in the home (smoking by household members rather than by partners); and a different cotinine assay. Bearing in mind these limitations, it would nevertheless seem likely that both exposure in non-smokers generally and the effects of partner smoking are somewhat greater in Britain than in the USA.
What this paper adds
Risks of lung cancer and of heart disease attributable to passive smoking have been studied mainly in non-smokers married to smokers, but there has been little quantitative assessment of the extent of exposure in marriage partners as indicated by markers of inhaled smoke dose. This study, based on a large and representative survey of adults in England, found a strong dose–response relation between cotinine concentrations in non-smoking adults and the smoking behaviour of their partners. Socioeconomic factors also contributed to measured cotinines. On average, cotinine concentrations in non-smokers with a smoking partner were 0.6–0.7% of those in cigarette smokers. Smoking by partners in the home is a major source of non-smoking adults' exposure to passive smoking.
In addition to the effects of spouse smoking, we identified a number of other predictors of exposure. The effect of season, which has previously been observed in studies of children7presumably reflects better ventilation in the warmer months of the year. The observation of higher exposure levels in men than in women replicates US findings21 but the causes are unclear. It could be simply that men are more likely to enter smoky environments, although among the correlated cotinine levels of non-smoking couples from non-smoking households the concentration in the man tended consistently to be higher. Another possibility is that there are underlying sex differences in nicotine metabolism and excretion, although there is little evidence for this.22 Higher exposure in individuals living in more disadvantaged circumstances has been reported previously in children.6 7 This effect could partly be caused by smaller room sizes in poorer households, but since the effect was also observed in those from non-smoking homes, it probably also suggests that poor people live in a generally smokier world, outside the home as well as within it. The regional differences we observed generally follow a North–South gradient, and may reflect both ventilation in response to temperature differences and differences in the prevalence of smoking and hence exposure in public places.
Several of our predictors point to lifestyle factors which influence exposure. We found that exposure was higher in young adults, in those who were ex-smokers, and in people who were cohabiting rather than married. These predictors were found in people from non-smoking households as well as in those with smoking partners, suggesting that they index exposure outside the home. It may be that the young, ex-smokers, and cohabitees are more tolerant of other people's smoke and more likely to spend time in smoky pubs and restaurants.
The Health Survey for England does not include questionnaire items inquiring about sources of exposure outside the home such as the workplace or leisure facilities. We were therefore unable to conduct analyses to address their contribution to exposure directly. The low average levels of exposure we observed and the importance of smoking by the partner as a predictor of cotinine may suggest that exposure within the home is now for many adults the most important determinant of exposure to passive smoking, as it is also for children.14It may well be that those with smoking partners were also more heavily exposed to other people's smoke outside the home, so that not all of their increased cotinine concentrations reflects exposure within the home. There are also particular occupational groups with documented heavy workplace exposure, especially non-smokers working in pubs and bars.23 However, for many adults in the population there seems little doubt that the home is now the major source of exposure. This speaks to the rapid progress that has been made in recent years in reducing smoking in public places and the workplace.
In their review of lung cancer risk from passive smoking, Hackshaw and colleagues estimated that non-smokers married to smokers absorbed about 1% of the nicotine intake of cigarette smokers, and concluded that this indicated an excess risk consistent with the findings from the epidemiological studies.2 Their estimate was derived from four small studies, two based on nicotine and two on cotinine. The cotinine studies gave a lower percentage estimate of 0.7%, similar to the findings of 0.6–0.7% in the present study. If cotinine is taken as a quantitative indicator of the extent of lung cancer risk from passive smoking, and taking the same approach as Hackshaw, our figure of 0.6–0.7% suggests an excess risk of 14% in non-smokers with smoking partners, slightly lower than their extrapolated risk of 19%. Our figure is still comfortably within the confidence limits of the adjusted risk estimate for lung cancer from spouse smoking from the epidemiological studies (point estimate 1.26, 95% confidence limits 1.07 to 1.47).2It should be noted that whether nicotine intake is a valid indicator of exposure to risk relevant aspects of passive smoking is open to question, as exposure to tar and other harmful components in non-smokers and smokers may be in a somewhat different ratio. Linear extrapolation of risk from dose also does not fit well with the cardiovascular data on passive smoking, where the observed risk is much greater than would be expected on the basis of inhaled dose.24 25