Article Text

Abstract
AIMS To describe the relation between oscillatory amplitude changes and arterial blood gas (ABG) changes in preterm infants receiving high frequency oscillatory ventilation, using a multiparameter intra-arterial sensor (MPIAS).
METHODS Continuous MPIAS ABG data were collected after amplitude changes and stratified according to Fio 2: high (> 0.4) or low (< 0.3). For each amplitude change, the maximum change (from baseline) in Paco 2 and Pao 2 over the following 30 minutes was determined. In total, 64 oscillatory amplitude changes were measured in 21 infants (median birth weight 1040 g; gestation 27 weeks).
RESULTS All amplitude increases produced Paco 2 falls (median −0.98 and −1.13 kPa for high and low Fio 2 groups respectively). All amplitude decreases produced Paco 2 rises (median +0.94 and +1.24 kPa for high and low Fio 2 groups respectively). About 95% of the change in Paco 2 was completed in 30 minutes. Amplitude changes did not affect Pao 2when Fio 2 > 0.4. When Fio 2 < 0.3, amplitude increases produced a Pao 2 rise (median = +1.1 kPa; P < 0.001) and amplitude decreases a fall (median = −1.2 kPa; P < 0.001).
CONCLUSIONS After oscillatory amplitude changes, the speed but not the magnitude of the Paco 2 change is predictable, and a rapid Pao 2 change accompanies the Paco 2 change in infants with mild lung disease and a low Fio 2.
Key messages
Key messages
A 3 cm H2O change in oscillatory amplitude results in a median change in Paco 2 of about 1.0 kPa (but the range of effect is wide)
Following changes in oscillatory amplitude:
the speed and direction of change in Paco 2 is predictable;
about 95% of the change in Paco 2 is completed within 30 minutes;
Pao 2 is unaffected if lung disease is severe;
if lung disease is mild/improving, rapid changes in Pao 2 occur (up to 4.7 kPa)
- arterial
- blood gas monitoring
- lung
- oscillatory amplitude
- prematurity
- ventilation
Statistics from Altmetric.com
High frequency oscillatory ventilation (HFOV) is establishing itself as an effective alternative to conventional tidal volume ventilation in newborn infants with severe lung disease. Its potential benefit is ventilation at a lower peak airway pressure and Fio 2, both of which may reduce lung injury. This has the potential to reduce air leak and chronic lung disease. These benefits have been shown in animal studies1-3 and clinical randomised controlled trials4-6 comparing elective or early HFOV and conventional ventilation.
The clinical studies showing benefit have used a “high lung volume strategy”. Oxygenation is controlled by changes in the Fio 2 and mean airway pressure. The high lung volume strategy seeks to “recruit” lung volume by progressively increasing the mean airway pressure but avoiding hyperinflation. These increases in mean airway pressure and lung volume allow reductions in the Fio 2. Thus the Fio 2is used as a crude surrogate for lung volume recruitment. The aim is to achieve an Fio 2 < 0.3. This signals adequate lung volume recruitment and is associated with an increase in lung compliance. Static volume pressure curves during HFOV3indicate that mean airway pressure can then be reduced without loss of lung volume. Ensuring adequate lung volume recruitment and avoiding hyperinflation is achieved with the aid of frequent chest radiographs. Subsequent weaning then involves reducing Fio 2before further reductions in mean airway pressure. Oscillatory amplitude is used to control ventilation and therefore Paco 2.
Oxygenation during HFOV is thought to be independent of frequency and tidal volume,7 except at very low values.8Thus mean airway pressure and Fio 2 alone are used to determine oxygenation. Conversely, CO2 elimination during HFOV is related to frequency and tidal volume and is thought to be independent of mean airway pressure.7 In clinical practice, changes in oscillatory amplitude (and only occasionally frequency) are mainly used to alter CO2 elimination. These relations have important implications for the clinician using a high lung volume strategy during HFOV: the ventilator settings that determine oxygenation appear to be independent of those that govern CO2 elimination.
We have recently completed a multicentre validation study of a multiparameter intra-arterial sensor (MPIAS) capable of continuous blood gas monitoring in the newborn infant.9 This has allowed us to make some novel observations about the acute arterial blood gas (ABG) changes that occur following changes in the ventilator settings during HFOV. In particular, we observed that the effect of changes in oscillatory amplitude appeared to differ during the disease process in the same infant and between infants with different disease severity.
Based on these initial observations, we have performed an observational study with the following aims:
to describe the relation between changes in oscillatory amplitude and changes in Paco 2 and Pao 2 using the MPIAS;
to compare effects of changes in oscillatory amplitude on ABG status at different severities of lung disease.
Methods
The study received local ethics committee approval. Informed parental consent was given before randomised changes in ventilation were performed. All infants were studied at the neonatal intensive care unit, St James' University Hospital, Leeds. This unit has a policy of elective HFOV (Sensormedics, 3100A) in all infants under 28 weeks gestation. In addition, those infants receiving conventional ventilation, with radiological evidence of severe lung disease, peak inspiratory pressure exceeding 30 cm H2O, or Fio 2 > 0.6 are switched to HFOV. Infants were managed according to the unit HFOV protocol, which is based on a high lung volume strategy.
In order to be eligible for study, subjects had to be preterm infants receiving HFOV, with an MPIAS in place and a clinical and radiological diagnosis of respiratory distress syndrome. Consequently, all infants had received at least one dose of surfactant and were more than 4 hours old. Infants in whom there was an identifiable (clinically and/or radiologically) additional cause of respiratory distress or congenital heart disease at the time of study were excluded.
The MPIAS (Neotrend; Diametrics Medical Ltd, High Wycombe, Bucks, UK) allows continuous monitoring of pH, Paco 2, and Pao 2.9 The cotside monitor displays continuous ABG status as a trend over time. Data can be displayed over time periods ranging from the previous 10 minutes to the previous 24 hours. ABG data can be retrieved at any time point available on the screen display. Hard copies of screen information can be printed when required.
Infants were managed using the unit's HFOV protocol, which indicates that the ideal is to maintain Paco 2 at 4.0–6.0 kPa and keep within 3.5–7.0 kPa (Pao 2equivalents are 7–10 kPa and 6–12 kPa respectively). Fio 2 was set at a level to maintain Pao 2 at 7–10 kPa. Most changes in oscillatory amplitude were clinically determined and driven by the unit's HFOV protocol. Changes in oscillatory amplitude were made in increments of 2 or 3 cm H2O. A small number of random changes in oscillatory amplitude (± 3 cm H2O) were also studied. This was to ensure a full range of Paco 2 values at the time of the change in oscillatory amplitude. Random changes in oscillatory amplitude were only performed when the Paco 2 and Pao 2 were in the ideal ranges and had stable baselines.
Clearly, it was necessary to ensure, as far as possible, that acute ABG changes were the result of the change in oscillatory amplitude and not some other factor. The time at which the oscillatory amplitude was changed is referred to as t0. Data collection took place only when the change in amplitude met the following criteria:
no other changes in ventilator settings;
inspiratory time 30%, frequency 10 Hz;
a period of stable Paco 2 and Pao 2 baselines before t0.
Paco 2 and Pao 2baselines were defined as stable, before the time of each change in oscillatory amplitude (t0), if they met one of the following criteria:
no change in Paco 2 (± 0.1 kPa) and Pao 2 (± 0.2 kPa) for more than five minutes before t0;
no change in Paco 2 (± 0.3 kPa) and Pao 2 (± 0.5 kPa) for more than 30 minutes before t0;
consistent linear change had been present for more than 20 minutes before t0.
DATA COLLECTION
For each change in oscillatory amplitude the following basic data were collected:
oscillatory amplitude, mean airway pressure, and Fio 2 immediately before t0;
change in oscillatory amplitude at t0;
lung inflation (posterior ribs) and grade of respiratory distress syndrome on last chest radiograph.
The minimum study period after t0 was 30 minutes. Where possible, further data were collected at 10 minute intervals after the end of the study period (after t30).
For each change in oscillatory amplitude, the following ABG data represent the minimum data set collected:
Paco 2 and Pao 2 at t0;
Paco 2 and Pao 2 at 5, 10, 20, and 30 minutes after t0 (t5, t10, t20, t30);
direction of change of Paco 2 and Pao 2 established before t5 (+ or − or 0);
earliest time (tmax30) at which maximum Paco 2/o 2 change (from baseline) occurred;
change (from baseline) in Paco 2(Δmax30Paco 2) and Pao 2(Δmax30Pao 2) at tmax30;
printout of MPIAS screen display during whole study period.
We tried to ensure that the ABG changes recorded at tmax30were as a result of the change in oscillatory amplitude, by establishing a temporal relationship. This was achieved by recording the direction (+ or −) of change in Paco 2 and Pao 2 established before t5. The tmax30 was calculated using this established directional change. If no change in baseline occurred before t5, this was also recorded, as it would be much less likely that subsequent ABG variations were due to the change in oscillatory amplitude. The Fio 2 at the time of the change in oscillatory amplitude (t0) was recorded from the Sensormedics 3100A. Data were stratified into those from severe (Fio 2 > 0.4) and mild (Fio 2 < 0.3) lung disease groups depending on the Fio 2 at t0.
STATISTICAL ANALYSIS
Data from the high (Fio 2 > 0.4) and low (Fio 2 < 0.3) inspired oxygen groups were compared using Mann-Whitney U tests. Increases and decreases in oscillatory amplitude were compared separately. This stratified data into four groups. Where patients contributed more than one set of data to each group, the mean values were used. Thus individual patients contributed only one data point to each group. Data from oscillatory amplitude changes performed when Fio 2 was 0.3–0.4 were not included in the statistical analysis.
Results
We studied 21 infants of median (range) birth weight and gestation 1040 (400–2740) g and 27 (23–35) weeks respectively. Data were collected from 64 changes in oscillatory amplitude (33 decreases and 31 increases), including 12 random changes and excluding two changes where ABG went outside the acceptable range before the end of the study period. The data were stratified according to the Fio 2 at t0. This resulted in 33 changes in oscillatory amplitude in the low Fio 2 (< 0.3) group and 21 in the high Fio 2 (> 0.4) group. Table 1 summarises the basic data, including ventilator settings and blood gases at t0, for increases and decreases in oscillatory amplitude.
Basic patient details and ventilation settings at t0
A comparison between infants in the high and low Fio 2 groups did not show any statistically significant differences for birth weight or gestation. However, there was a trend towards a longer gestation and higher birth weight in the high Fio 2 group, because most of these infants were rescued with HFOV rather than electively treated. As would be expected with more severe lung disease, infants in the high Fio 2 group also started each study period (t0) with a higher mean airway pressure and oscillatory amplitude, although this was not statistically significant. Amplitude was changed in increments of ± 2 (n = 16) or ± 3 cm H2O (n = 48). The mean change in amplitude does not differ between groups. No differences between the high and low Fio 2 groups were seen in the Paco 2 or Pao 2 at t0. High Paco 2 levels were seen before increases in oscillatory amplitude and low levels before decreases. This is to be expected as most of the ventilator changes were clinically determined.
CHANGES IN PaCO2
Table 2 and fig 1 summarise the changes in Paco 2 seen following changes in oscillatory amplitude. After all changes in amplitude, the direction of change in Paco 2 was established within five minutes of t0 (and usually considerably sooner). As expected, the main finding was that all increases in oscillatory amplitude resulted in a fall in Paco 2 and all decreases in amplitude resulted in a rise in Paco 2 (table 2). In the 30 minute study period, tmax30 was 30 minutes in 62 of 64 of the amplitude changes. No statistically significant differences in Δmax30Paco 2 were seen between the high and low Fio 2 groups, although there was a slight trend to smaller changes in the high Fio 2 group. The magnitude of Δmax30Paco 2 was 0.87 kPa (range 0.52–1.60; n = 16) and 1.14 kPa (range 0.36–2.83; n = 48) for changes in amplitude of ± 2 cm H2O and ± 3 cm H2O respectively. This suggests a trend towards smaller changes in Paco 2 with smaller changes in amplitude, but was not statistically significant.
Maximum change in Paco 2 and Pao 2 in 30 minute study period (Δmax30Paco 2and Δmax30PaO2).
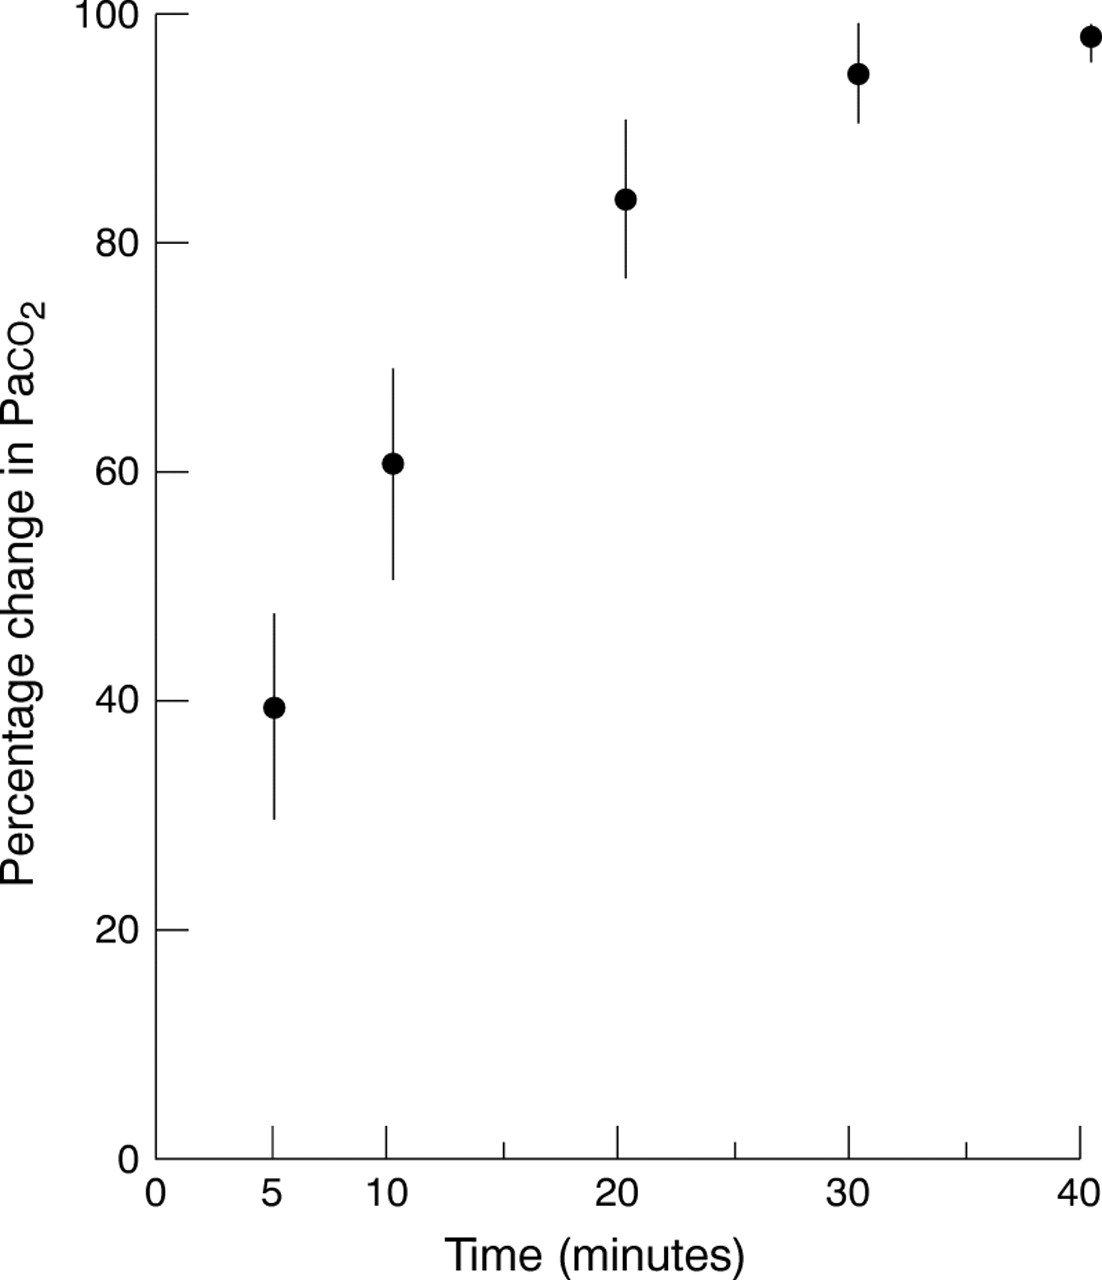
Graph showing percentage change in Paco 2 with time following a change in oscillatory amplitude. Median values with 95% confidence intervals for the median are shown at each time point.
In all 64 ABG traces obtained after changes in oscillatory amplitude, the change in Paco 2 with time followed an exponential curve. Although the study period was 30 minutes, in most ABG traces Paco 2 continued to change beyond t30 and data were collected until a new stable Paco 2 baseline was clearly established. In nine of 64 ABG traces, either a further change in ventilator settings was clinically indicated or a new spontaneous change in the Paco 2 occurred before a stable Paco 2 could be established. In the remaining ABG traces (55 of 64), it was possible to identify the period when the Paco 2 established a new stable baseline. The difference between the Paco 2 at this period and t0 enabled the total change in Paco 2 after a change in oscillatory amplitude to be calculated. Thus the percentage of the total change in Paco 2 that had occurred by any given time point could be established. Figure 1 shows the median percentage change at times t5, t10, t20 and t30 for all patients. The most important clinical finding from these data is that 95.2% (90.6 to 99.7) of the change in Paco 2 had occurred within 30 minutes of the change in oscillatory amplitude (median; 95% confidence interval for the median).
The exponential curve describing the percentage change in Paco 2 (ΔPaco 2) with time (t) in minutes fits the equation: ΔPaco 2 = 100(1 − e−0.1t)
CHANGES IN PaO2
Table 2 summarises the changes in Pao 2seen following changes in oscillatory amplitude. The most important finding is that changes in oscillatory amplitude did affect Pao 2 in the low Fio 2group but not in the high Fio 2 group. Increases in oscillatory amplitude resulted in a median rise of 1.1 kPa in the low Fio 2 group compared with 0.0 kPa in the high Fio 2 group (p < 0.001). Decreases in oscillatory amplitude resulted in a median fall of 1.2 kPa in the low Fio 2 group compared with a small rise of 0.2 kPa in the high Fio 2 group (p < 0.001).
All infants in the low Fio 2 group exhibited the same response: an increase in oscillatory amplitude resulted in a rise in Pao 2, and a decrease in oscillatory amplitude resulted in a fall in Pao 2. The change in Pao 2 occurred rapidly after the change in oscillatory amplitude. In this group, 31 of 33 changes in oscillatory amplitude resulted in a tmax30 for Pao 2 of less than 10 minutes (median = four minutes). More importantly, the direction of change in Pao 2 was established before t5 in all 24 changes in oscillatory amplitude. Thus there appeared to be a consistent and temporal relation between the changes in oscillatory amplitude and Pao 2.
In contrast, in the high Fio 2 group, there was no relation between the direction of change in oscillatory amplitude and the direction of the (small) change in Pao 2. Only seven of 21 had a tmax30of less than 10 minutes (median = 25 minutes), and in only seven of 21 was the direction of change in Pao 2 apparent before t5. This suggests that most of the changes in Pao 2 that were observed were not related to the change in oscillatory amplitude.
Most patients contributed data to either the high Fio 2 group or the low Fio 2 group. However, five of 21 contributed to both. Figure 2 shows the ABG traces of one of these patients. The first ABG trace shows the effects of changing the oscillatory amplitude with Fio 2 0.55 and the second with Fio 2 0.25. The same observation was made in all five patients contributing data to both Fio 2groups. This indicates that the effects of changes in oscillatory amplitude are reproducible both within and between patients with differing severities of lung disease.

(A) Screen printout of multiparameter intra-arterial sensor (MPIAS) showing pH, Paco 2, and Pao 2 changes over a one hour period, in a 27 week gestation infant aged 9 hours. Previous chest radiograph confirmed moderate/severe respiratory distress syndrome, Fio 2 0.55. The vertical line marks t0, when there was a 3 cm H2O reduction in oscillatory amplitude. There is a subsequent rise in Paco 2 (and corresponding fall in pH), but no change in the Pao 2 baseline. At the end of the study period, the Pao 2 falls sharply as Fio 2 is reduced to 0.45. (B) Screen printout of MPIAS showing pH, Paco 2, and Pao 2 changes over a one hour period, in the same infant 24 hours later. Previous chest radiograph confirmed improving respiratory distress syndrome, Fio 2now 0.25. The vertical line marks t0, when there was a 3 cm H2O increase in oscillatory amplitude. There is a subsequent fall in Paco 2 (and corresponding rise in pH). This is accompanied by a sharp increase in Pao 2 completed in six minutes (tmax30), and sustained thereafter.
Some data were recorded (n = 10) when the Fio 2 was between 0.3 and 0.4. Our study design excluded data from this “intermediate” Fio 2group in the statistical comparisons because we wanted to identify two distinct groups, one with severe and one with mild lung disease. The ABG traces obtained when the Fio 2 was 0.3–0.4 showed the same rapid change in Pao 2 after a change in oscillatory amplitude, but it was not sustained. In most cases, Pao 2 returned to baseline within 10 minutes.
Discussion
This study describes in detail, for the first time, the effects of changes in oscillatory amplitude on Paco 2 and Pao 2 in a clinical situation. Changes in oscillatory amplitude affect Paco 2 by altering tidal volume.6 Tidal volume measurements during HFOV are difficult and are used as a research rather than a clinical tool. Experimental data from animal and computer models, together with clinical studies have tried to establish the relation between tidal volume and Paco 2.7 ,10-15 There are considerable differences in the relation between tidal volume, frequency, and Paco 2 reported in these different studies. This has had limited clinical application, but has been used to establish changes in oscillatory amplitude as the method of controlling Paco 2 in clinical practice.
Our findings confirm that increasing oscillatory amplitude (and so tidal volume) improves CO2 elimination resulting in a fall in Paco 2. Decreases in amplitude have the opposite effect. We did not set out to quantify any relation between the magnitude of change in amplitude and the magnitude of change in Paco 2. The fact that no statistically significant differences were seen between changes in amplitude of ± 2 and ± 3 cm H2O is not surprising given the wide variation in the magnitude of change in Paco 2.
We were able to describe the percentage change in Paco 2 with time. This showed that about 95% of the change in Paco 2 is completed within 30 minutes of the change in amplitude. This provides the definitive answer to the question: in infants receiving HFOV, how soon after a change in oscillatory amplitude should ABG sampling be performed? Our data also indicate that changes in amplitude of 2–3 cm H2O will result in a median change in Paco 2 of about 1.0 kPa. These are useful guidelines for clinicians managing infants without the benefit of continuous MPIAS monitoring. However, there is a wide range for Δmax30Paco 2 after similar changes in oscillatory amplitude, highlighting the dangers of managing infants receiving HFOV without some form of continuous CO2 monitoring. Interestingly, major neonatal textbooks suggest ABG sampling 30–60 minutes after a change in conventional ventilator settings.16
Unexpectedly, we have shown that changing oscillatory amplitude does affect Pao 2, but only in mild or improving lung disease with a low Fio 2. Clearly, it is unlikely that the response in Pao 2 to a change in oscillatory amplitude is an all or none phenomenon based on high or low Fio 2. This is confirmed by qualitative information from the patients who contributed to the “intermediate” Fio 2 group and those that contributed to both the high and low Fio 2 groups. Changes in Pao 2 start as a transient phenomenon lasting about 10 minutes. The Pao 2 then takes longer and longer to return to the baseline as the lung disease improves further. Eventually the Pao 2 shows a sustained rise for the whole study period (fig 2B). This indicates that the effect of changes in amplitude on Pao 2 evolve as lung disease improves and Fio 2 falls.
Although this phenomenon needs further evaluation, it does suggest that the mechanisms governing gas exchange during HFOV change with the falling Fio 2. There are two main reasons why Fio 2 can be reduced using the high lung volume strategy in HFOV. The first reduction in Fio 2is associated with the recruitment of lung volume in the early phase of the high lung volume strategy. Further reductions in Fio 2 and ventilator settings result from improvements in lung disease. Five mechanisms of gas exchange in HFOV have been described,17 with the relative importance of each varying according to the region of the lung. Changes in the mechanical properties of the lungs may also alter the relation between the different modes of gas transport, and therefore the overall efficiency of HFOV. Such changes do occur with both changing lung volume18 ,19 and lung disease severity.7 ,20 ,21
The changes in the mechanisms of gas exchange during HFOV that would explain the differing effects of oscillatory amplitude on Pao 2 are a matter of speculation. We have noticed that the change in Pao 2 with time is similar to that produced by altering Fio 2. This would suggest that the change in Pao 2 may result from a change in alveolar Po 2. One possibility is that the increase in lung compliance associated with improving lung disease means that bulk convection plays a more important role in gas exchange. Increasing oscillatory amplitude would increase direct alveolar ventilation and so alveolar Po 2. Decreasing amplitude would have the opposite effect.
Whatever the mechanism of this phenomenon, the observed changes in Pao 2 following a change in oscillatory amplitude (up to 4.7 kPa) are clinically important. The clinician needs to be aware that improving lung disease and a falling Fio 2 in infants receiving HFOV indicate that changes in oscillatory amplitude will affect Pao 2 as well as Paco 2.