


Abstract
Background and objective: Idiopathic pulmonary fibrosis (IPF) patients report fatigue, possibly reflecting sleep disturbance, but little is known about sleep-related changes. We compared ventilation and gas exchange during sleep and exercise in a cohort of IPF patients, and evaluated associations with selected biological markers.
Methods: Twenty stable IPF patients (aged 67.9 ± 12.3 [SD]) underwent overnight polysomnography following an acclimatization night. Cardiopulmonary exercise testing was performed and inflammatory markers measured including TNF-α, IL-6, CXCL8, C-C motif ligand 18 (CCL-18) and C-reactive protein (CRP)
Results: Nine patients had sleep-disordered breathing (SDB) with an apnea–hypopnea frequency (AHI) ≥ 5/h, but only two had Epworth sleepiness score ≥10, thus having an obstructive sleep apnea syndrome. Sleep quality was poor. Transcutaneous carbon dioxide tension (PtcCO2) rose by 2.56 ± 1.59 kPa overnight (P = 0.001), suggesting hypoventilation. Oxygen saturation (SaO2) was lower during sleep than exercise (P < 0.01), and exercise variables correlated with resting pulmonary function. CCL-18 and CRP levels were elevated and correlated with PtcCO2 rise during sleep (P < 0.05). CCL-18 negatively correlated with diffusion capacity of carbon monoxide (DLCO), arterial oxygen (PaO2) and mean arterial carbon dioxide (PaCO2) (P < 0.05) and CRP negatively correlated with DLCO, PaO2, sleep SaO2 and oxygen uptake (VO2) during exercise (P < 0.05).
Conclusions: IPF patients desaturate more during sleep than exercise; thus, nocturnal pulse oxymetry could be included in clinical assessment. CCL-18 and CRP levels correlate with physiological markers of fibrosis.
Introduction
Idiopathic pulmonary fibrosis (IPF) is a chronic, progressive pulmonary disease with 5-year mortality rate of 70% after diagnosis.1 A recent review of the epidemiology of IPF finds a great variation in reported prevalence between studies2 with prevalence ranging from 0.7 per 100 000 in Taiwan to 63 per 100 000 in USA. Although some new therapeutic options have recently become available, survival with current treatments is disappointing.
Fatigue is a prominent symptom in IPF,3 which could reflect sleep disturbance. In IPF, sleep quality is diminished3 and a recent report demonstrated a high prevalence of obstructive sleep apnea (OSA) in a selected cohort.4 IPF patients demonstrate oxygen desaturation during exercise5 but there is limited data on the degree of oxygen desaturation during sleep, independent of apnea.6 An early report7 indicated that IPF patients desaturate more significantly during exercise than sleep.
There is growing interest in the relationship of biological markers with disease activity and prognosis. Regarding IPF, increased serum levels of the chemokine, C-C motif ligand 18 (CCL-18) have been reported to predict disease progression in patients with IPF.8 Other markers of systemic inflammation, including C-reactive protein (CRP) and tumor necrosis factor α (TNF-α) have been reported to be elevated in patients with OSA.9
The objective of the present study was to further explore the degree and mechanisms of sleep-disordered breathing (SDB) in a cohort of patients with stable IPF, and to compare disturbances in ventilation and gas exchange during sleep and exercise with physiological and biological parameters in these patients.
Methods
Subjects
This study was approved by the St Vincent’s University Hospital (SVUH) Ethics Committee (Ref. E.K. 1 October 2008). Patients were selected from the Hospital IPF database between June 2009 and March 2012. The study criteria included the following: age >18 years, confirmed diagnosis of IPF by ATS criteria, not on long term oxygen therapy, no active coronary artery disease or unstable co-morbid conditions. Subjects were asked to complete the Epworth Sleepiness Score (ESS) questionnaire and SF 36 quality of life (QOL) questionnaire. Baseline demographics were recorded including age, gender, body mass index (BMI), neck circumference, smoking history and previous treatment modalities for IPF.
Sleep studies
Patients were admitted for two consecutive nights to the sleep laboratory at SVUH. The first night was for acclimatization purposes where monitoring sensors were applied but not recorded, and the second night for polysomnography (PSG), which was performed using a commercial system (SOMNO medics, Germany), and following established techniques.10 All PSG records were scored by one experienced respiratory scientist (G.N.). The Linde TOSCA 500 system (Linde AG, Copenhagen, Denmark) provided continuous non-invasive monitoring of transcutaneous PCO2 (PtcCO2).
Pulmonary function testing and awake gas exchange measurements
Spirometry (forced expiratory volume in second [FEV1], forced vital capacity [FVC] and FEV1/FVC ratio), total lung capacity (TLC) and residual volume (RV) by both body plethysmography and helium dilution, and measurement of diffusing capacity for carbon monoxide (DLCO) by the single-breath technique was performed using a commercial system (Jaeger GmbH, Hoechberg, Germany). Resting awake arterial blood gases (kPa) were performed and alveolar-arterial (A-a) gradient calculated from the formula: A-a gradient = (PI Atmos−PaCO2/RER)−PaO2.
Cardiopulmonary exercise testing
Cardiopulmonary exercise testing (CPET) was performed on a bicycle ergometer (Ergoline GmbH, Germany) following ATS/ACCP recommendations11 using a commercial device (Jaeger Oxycon Pro). Data calculations were according to Wasserman.12
A qualified respiratory scientist supervised the study and the system continuously displayed VO2, carbon dioxide output (VCO2), heart rate, minute ventilation (VE), and work rate (Watts). The Modified Borg dyspnea scale was recorded before and after testing by each patient.13
Inflammatory marker measurements
TNF-α, interleukin-6 (IL-6) and interleukin 8 (CXCL8) were quantified by the Luminex technique using a MILLIPORE MILLIPLEX® MAP Kit (Millipore, Billerca, MA). High-sensitivity CRP and CCL-18 were quantified using an ELISA assay (R&D Systems Europe). The detection range for the CCL-18 ELISA was 7.81–500 pg/ml. The samples were diluted by a factor of 1/400 to ensure that all samples fell within the linear range of the standard curve. The detection range for CRP ELISA was 0.3–350 mg/l. The minimum detection concentrations for IL-6, CXCL8 and TNF-α are 0.20, 0.05 and 0.07 pg/ml, respectively.
Radiological assessment
High-resolution computed tomography of thorax (HRCT) was performed and scored by two thoracic radiologists J.D. and D. M.). Imaging was obtained on a Siemens Sensation 64-slice CT (Siemens, Erlangen, Germany).
Statistical analysis
Data are presented as mean ± standard deviation (SD) for normally distributed continuous variables, and as medians (interquartile ranges) for variables not normally distributed. Continuous outcome variables were analysed with a one-way analysis of variance. Correlations were analysed by Pearson testing and all P-values were two tailed. All analyses were performed using statistical software (PASW Statistics version 18).
Results
Twenty eligible patients completed the study. Clinical and anthropometric details are presented in Table 1.
Clinical and anthropometric findings
| Parameters | Total (Mean ± SD) (n = 20) | No SDB (AHI 0–5/h) (n = 11) | SDB (AHI > 5) (n = 9) | P-value |
|---|---|---|---|---|
| Age (years) | 67.90 ± 12.27 | 68.45 ± 12.58 | 67.22 ± 13.32 | 0.84 |
| BMI (kg/m2) | 28.50 ± 4.56 | 27.50 ± 1.71 | 29.72 ± 0.81 | 0.053 |
| Neck circumference (cm) | 39.61 ± 4.10 (n = 18) | 38.67 ± 4.06 (n = 9) | 40.56 ± 4.10 (n = 9) | 0.35 |
| Waist circumference (cm) | 103.63 ± 9.80 (n = 19) | 101.75 ± 13.48 (n = 10) | 104.86 ± 6.62(n = 9) | 0.51 |
| Hip circumference (cm) | 108.44 ± 8.82 (n = 16) | 106.63 ± 10.03 (n = 8) | 110.14 ± 7.65 (n = 8) | 0.23 |
| Smoking status | ||||
| Current smoker | 3 (15%) | 2 | 1 | |
| Previous smoker | 12 (60%) | 6 | 6 | |
| Never smoker | 5 (25%) | 3 | 2 | |
| Medical history, number (%) | ||||
| Gastroesophageal reflux | 0 | 0 | 0 | |
| Diabetes mellitus, type II | 4 (20) | 2 | 2 | |
| Hypertension | 2 (10) | 1 | 1 | |
| Coronary artery disease (inactive) | 7 (35) | 2 | 5 | |
| Other | 7(35) | 6 | 1 | |
| Medications | ||||
| IPF Medications | 3 (15) | 2 | 1 | |
| Prednisolone | 1 (5) | 1 | 0 | |
| No medication | 12 (60) | 5 | 7 | |
| Steroids and IPF medications | 4 (20) | 3 | 1 | |
| Steroids therapy, number (%) | ||||
| Current steroids | 1 (5) | 1 | 1 | |
| Previous steroids | 5 (25) | 4 | 0 | |
| Never | 14 (70) | 6 | 8 | |
| Basis of diagnosis, number (%) | ||||
| Biopsy | 3 (15) | 2 | 1 | |
| Radiology | 17 (85) | 9 | 8 |
SDB, sleep disorder breathing; SD, standard deviation; BMI, body mass index.
Sleep-related findings
Table 2 shows the sleep distribution in the overall cohort, which indicates reduced sleep efficiency, increased proportion of light sleep and diminished slow wave and rapid eye movement (REM) sleep when compared with similar normal populations.14 Nine patients (45%) had evidence of SDB based on apnea hypopnea index (AHI) ≥ 5 events/hour but only two of these had significant daytime sleepiness (ESS ≥ 10). Thus, only 10% of patients fulfilled the minimum diagnostic criteria for an obstructive sleep apnea syndrome (OSAS).15,16 BMI was higher in patients with AHI ≥ 5 (Table 1; P = 0.053), and BMI positively correlated with AHI (r = 0.59, P = 0.001). Table 2 further compares the sleep architecture between the two groups with and without SDB (AHI ≥ 5 and AHI < 5). Stage 1 and REM sleep distribution were similar between the two groups but patients with AHI ≥ 5 had more stage 2 (P = 0.004) but less slow-wave sleep than patients with AHI < 5 (P = 0.04).
Sleep stages distribution and sleep architecture
| Parameters | Whole group | No OSA (AHI 0–5) | OSA (AHI > 5) | P-value |
|---|---|---|---|---|
| Polysomnography | ||||
| Latency to sleep (min) | 27.4 ± 13.1 | 22.35 ± 7.67 | 33.70 ± 16.13 | 0.098 |
| Sleep Efficiency | 75.1 ± 10.3 | 75.31 ± 9.94 | 74.79 ± 11.38 | 0.92 |
| Stage 1 sleep (%) | 19.4 ± 15.7 | 20.49 ± 19.87 | 17.95 ± 9.43 | 0.73 |
| Stage 2 sleep (%) | 52.9 ± 13.8 | 44.89 ± 8.57 | 62.83 ± 12.88 | 0.004* |
| Stage 3/4 sleep (%) | 14.5 ± 9.9 | 18.54 ± 9.71 | 9.84 ± 8.35 | 0.04* |
| Stage REM sleep (%) | 11.5 ± 6.8 | 13.24 ± 7.63 | 9.36 ± 5.43 | 0.23 |
| Arousal (respiratory) | 4.1 ± 8.9 | 1.01 ± 1.63 | 7.9 ± 12.64 | 0.014* |
| Index/hour | 1.01 ± 0.52(SEM) | 7.9 ± 4.47(SEM) | ||
| Arousal (desaturations) | 3.23 ± 7.23 | 0.91 ± 1.97 | 6.14 ± 10.23 | 0.19 |
| Index/hour | 0.91 ± 0.63(SEM) | 6.14 ± 3.62 |
*P < 0.05.
Oxygen desaturation during sleep was evident in the overall cohort (P < 0.0001), but, as expected, was greater in the group with AHI ≥ 5 (Supplementary E-Table S1). There was a strong correlation between mean awake SaO2 and mean sleep SaO2 (r = 0.71, P < 0.001), and also minimum sleep SaO2, r = 0.72, P < 0.001 (Supplementary E-Table S2). Transcutaneous carbon dioxide tension (PtcCO2) rose by 2.56 ± 1.59 kPa during sleep compared with pre-sleep levels (P = 0.001, 95% CI 1.42–3.69 kPa). There was no difference in the degree of CO2 rise between the two groups.
Resting pulmonary function and gas exchange
Pulmonary function testings (PFTs) showed a restrictive ventilatory pattern, with no significant difference in the degree of restriction between the two groups (AHI ≥ 5 and AHI < 5), but TLC by body box plethymography was lower in patients with AHI ≥ 5 (P = 0.049; Table 3). Spirometry data and DLCO did not correlate with AHI. AHI negatively correlated with TLC (Supplementary E-Table S3).
Pulmonary function and arterial blood gas data
| Parameters | Total (Mean ± SD) (n = 20) | No SDB (AHI < 5) (n = 11) | SDB (AHI ≥ 5) (n = 9) | P-value |
|---|---|---|---|---|
| Pulmonary function | ||||
| FEV1 (L) | 2.20 ± 0.54 | 2.21 ± 14.86 | 2.17 ± 0.35 | 0.88 |
| FEV1 (% pred) | 84.04 ± 18.68 | 89.55 ± 14.87 | 76.84 ± 22.86 | 0.20 |
| FVC (L) | 2.67 ± 0.64 | 2.68 ± 0.76 | 2.65 ± 0.50 | 0.93 |
| FVC (% pred) | 82.18 ± 15.28 | 85.18 ± 15.99 | 78.05 ± 14.18 | 0.32 |
| DLCO (ml/min/Hg) | 12.61 ± 4.18 | 13.78 ± 5.03 (n = 9) | 11.30 ± 2.80 | 0.22 |
| DLCO (% pred) | 51.08 ± 14.96 | 55.27 ± 15.30 | 46.37 ± 14.01 | 0.23 |
| TLC helium dilusion | 4.3 ± 0.91 (n = 18) | 4.49 ± 1.08 (n = 10) | 4.06 ± 0.62 | 0.31 |
| TLC (% pred) | 70.36 ± 10.15 | 73.42 ± 9.28 | 66.51 ± 10.46 | 0.16 |
| TLC body box | 4.50 ± 1.1 (n = 15) | 5.13 ± 1.13 ((n = 7) | 3.95 ± 0.79 | 0.044* |
| TLC (% pred) | 75.33 ± 11.99 | 81.81 ± 11.33 (n = 7) | 69.66 ± 9.94 | 0.049* |
| RV helium dilusion | 1.54 ± 0.3 (n = 18) | 1.62 ± 0.4 ((n = 9) | 1.46 ± 0.28 (n = 9) | 0.32 |
| RV (% pred) | 65.57 ± 12.87 | 69.4 ± 12.21 | 61.7 ± 13.01 | 0.21 |
| Arterial blood gases | ||||
| PaO2 (kPa) | 10.97 ± 1.4 | 10.6 ± 1.4 | 11.5 ± 1.3 | 0.15 |
| PaCO2 (kPa) | 5.32 ± 0.5 | 5.40 ± 0.6 | 5.22 ± 0.33 | 0.46 |
AHI, apnoea-hyponea index; FEV1, forced expiratory volume in 1 s; FVC, functional vital capacity; TLC, total lung capacity; DLCO, diffusion capacity of carbon monoxide; RV, residual volume; PaO2, arterial oxygen tension and PaCO2, arterial carbon dioxide tension; SDB, sleep disordered breathing; SD, standard deviation. *P < 0.05.
The mean PaO2 was 10.97 ± 1.37 kPa and the mean PaCO2 5.32 ± 0.47 kPa. The mean A-a gradient was elevated at 5.26 ± 1.68 kPa (normal 2–4 kPa). There was a weak inverse correlation between diffusing capacity and both PaO2 and A-a gradient, but no correlation between PaO2 and FEV1, FVC or TLC. There was no correlation between PaCO2 and any of the variables on PFT (Supplementary E-Table S2).
Exercise-related findings
A total of 18 subjects satisfactorily completed the CPET protocol. CPET data demonstrated a reduced maximal workload at 53.1 ( ± 19.1)% predicted and a moderately reduced VO2 max (70.9 ± 15.8 % predicted). The mean resting SaO2 was 97.6 ± 0.9% and mean SaO2 at the end of exercise was 92.8 ± 3.8 %.
Comparison of gas exchange between sleep and exercise
Minimum SaO2 during sleep was lower compared with exercise (P < 0.001) even in patients with AHI < 5 (Table 4 and Figure 1). The magnitude of oxygen desaturation was twice as great during sleep compared with exercise (P < 0.044), even in the group with AHI < 5 (Table 4).
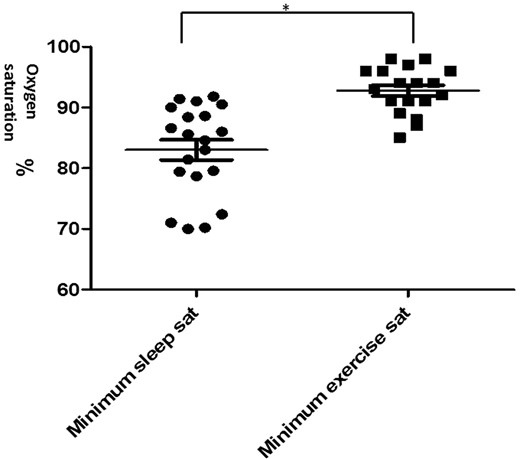
Scattergram comparing minimum SaO2 during sleep and exercise. Values are mean ± SEM. *P < 0.05 comparing mean minimum sleep and exercise saturation.
Comparison of sleep and exercise data
| Parameters | As a group | AHI < 5 | AHI ≥ 5 | P-value |
|---|---|---|---|---|
| Minimum SaO2 during sleep | 83.0 ± 7.41 | 84.4 ± 7.6 (n = 11) | 81.3 ± 7.2 (n = 9 | 0.3 |
| Minimum SaO2 during exercise | 92.6 ± 4.0 | 93.1 ± 3.6 (n = 10) | 91.9 ± 91.9 (n = 8) | 0.56 |
| Fall in SaO2 during sleep | 10.70 ± 6.96 | 8.9 ± 6.8 | 12.8 ± 6.9 | 0.30 |
| Fall in SaO2 during exercise | 4.80 ± 3.60 | 4.3 ± 2.8 | 5.4 ± 4.5 | 0.57 |
| CT 90 (min.s) | 19.33 ± 11.1 | 2.31 ± 1.1 | 24.15 ± 15.8 | 0.045 |
| CT 88 | 9.3 ± 6.5 | 1.4 ± 0.66 | 17.2 ± 17.3 | 0.02 |
| CT 86 | 6.1 ± 4.7 | 0.5 ± 0.4 | 11.7 ± 9.2 | 0.037 |
| P-value (minimum SaO2 during sleep vs. exercise) | <0.001 | 0.16 | <0.001 | |
| P-value (fall in SaO2 during sleep vs. exercise) | 0.007* | 0.1 | 0.044* |
SaO2, oxyhemoblobin saturation; CT 90, time spent below 90% in oxyhemoglobin saturation during sleep; CT 88, time spent below 88% in oxyhemoglobin saturation during sleep; CT 86, time spent below 90% in oxyhemoglobin saturation during sleep. *, statistically significant.
Values are expressed as means ± SD except for CT90, CT 88 and CT 86, whereby values are expressed as means ± SEM.
Health-related QOL
Health-related QOL was assessed by the SF-36 questionnaire and compared with previously published data17 for a general Irish population of similar age (Table 5).
QOL (sf 36) scores of IPF patients compared with an equivalent normal population matched for age
| Parameters | IPF Patients (Mean ± SD) | 95% CI | Normal population (Mean ± SD) | 95% CI | P-value |
|---|---|---|---|---|---|
| Physical function | 49.70 ± 23.0 | 39.6–59.8 | 83.20 ± 22.9 | 73.8–92.6 | 0.003* |
| Role of physical function | 43.80 ± 42.8 | 24.9–62.7 | 80.5 ± 34.5 | 69–92 | <0.001 |
| Body pan | 54.35 ± 35.9 | 38.6–70.15 | 77.6 ± 26.4 | 67.6–87.6 | ns |
| General health | 55.25 ± 22.2 | 45.5–65.0 | 73.8 ± 21.1 | 64.8–82.8 | 0.001* |
| Vitality | 55.25 ± 17.1 | 47.7–62.8 | 64.8 ± 20.4 | 56–73.6 | ns |
| Social function | 73.5.1 ± 25.1 | 62.45–84.6 | 84.1 ± 23.1 | 74.7–93.5 | ns |
| Role of emotion | 68.4 ± 45.2 | 48.5–88.3 | 83.2 ± 32.0 | 72.1–94.3 | ns |
| Mental health | 63.4 ± 20.0 | 54.6–72.2 | 77.8 ± 16.5 | 69.8–85.8 | ns |
*P < 0.05.
IPF patients had significantly lower scores in three of the eight SF-36 domains. Mean composite physical score for the study population was 51.6 ( ± 12.8), lower than the mean composite mental score of 63.2 ( ± 13.7). Among the mental parameters, vitality was the most impaired domain with a mean of 55.2 ( ± 17.1).
The presence of SDB did not affect reported QOL; mean total score 59.1 ± 5.08 in the AHI ≥ 5 group and 66.9 ± 4.28 (P = 0.26) in those with AHI < 5. Comparison of the different domains of physical and mental scores revealed IPF patients with AHI ≥ 5 reporting more impairment in physical functioning than those with AHI < 5 (P = 0.036) (Supplementary E-Table S4).
Relationship of cytokines and resting physiological variables with exercise capacity and nocturnal gas exchange
CCL-18
Median concentration of CCL-18 was elevated at 64.15 ng/ml (43.67–94.73). There was no difference in the magnitude of CCL-18 between the two groups (AHI ≥ 5 and AHI < 5). However, CCL-18 levels were negatively correlated with DLCO and PaCO2 (Table 6).
Correlation between CCL-18 and gas exchange and exercise capacity data
| Parameters | Whole group | No SDB | SDB |
|---|---|---|---|
| PFT | |||
| DLCO | −0.55, P = 0.019* | r = −0.64, P = 0.12 | r = −0.87, P = 0.002* |
| Awake arterial blood gas | |||
| PaCO2 | −0.52, P = 0.017* | r = −0.70, P = 0.025* | r = −0.18, P = 0.69 |
| PaO2 | −0.48, P = 0.025* | r = −0.32, P = 0.36 | r = −0.65, P = 0.06 |
| A-a gradient | 0.65, P = 0.007* | r = 0.47, P = 0.25 | r = 0.75, P = 0.052 |
| Sleep gas exchange | |||
| CO2 rise | 0.73, P = 0.011* | r = 0.54, P = 0.27 | r = 0.91, P = 0.031* |
| Exercise capacity | |||
| VO2 max | −0.42, P = 0.10 | r = −0.38, P = 0.35 | r = −0.43, P = 0.29 |
Definitions for abbreviations: SDB, sleep disordered breathing; DLCO, diffusion capacity of carbon monoxide; PaO2, arterial oxygen tension; A-a gradient, alveolar-arterial O2 tension gradient; VO2 max, maximal oxygen uptake. *P < 0.05.
CCL-18 has no correlation with PtcCO2 value but CCL-18 was shown to have a strong correlation with CO2 rise during sleep [r = 0.73, P = 0.011 (overall group)], particularly in the SDB group (r = 0.91, P = 0.031); no SDB group (r = 0.54, P = 0.27). CCL-18 has no correlation to radiographic parameters on HRCT (fibrosis, reticulation or ground glass score).
In contrast, CCL-18 levels positively correlated with A-a gradient and CO2 rise during sleep (r = 0.73, P = 0.011) (Figure 2). There was no correlation between CCL-18 levels and measures of exercise capacity.
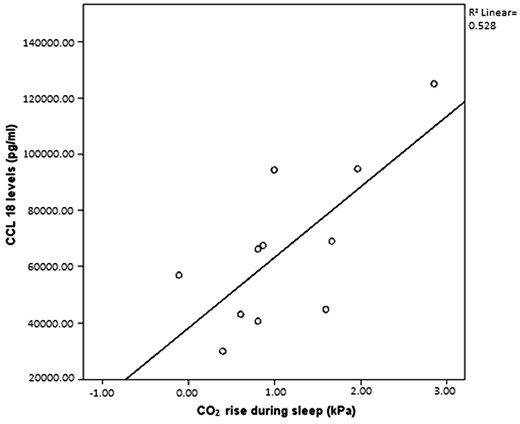
Correlation between CO2 rise during sleep and CCL-18 levels.
CRP
CRP levels were elevated at 1.88 (0.88–2.85) mg/l but levels were similar in the two groups (AHI ≥ 5 and AHI < 5). CRP correlated with some resting and exercise physiological variables, correlating inversely with DLCO (r = − 0.53, P = 0.034) (Supplementary E-Table S5). CRP also correlated with mean sleep SaO2 and also CO2 rise during sleep (r = 0.69, P = 0.02). CRP has no correlation with PtcCO2 value. CRP did not show any correlation with radiographic parameters on HRCT.
TNF-a, IL-6 and CXCL8 levels did not differ between the two groups (AHI ≥ 5 and AHI < 5) (Supplementary E-Table S6) and these cytokines did not relate to any physiological measurements during resting and exercise, or to the degree of fibrosis on HRCT.
HRCT findings
Subjects had moderate fibrotic disease (mean fibrosis score of 21.4 ± 14.1%). Mean fibrosis score correlated with both DLCO (r = − 0.51, P = 0.043), and A-a gradient (r = 0.57, P = 0.018).
Discussion
In this detailed study of pulmonary physiology and biomarkers in IPF patients, we found greater oxygen desaturation during sleep than exercise. The fall in SaO2 during sleep was twice that during exercise, regardless of the presence of SDB. PtcCO2 levels rose significantly during sleep but did not differ between those with or without SDB, suggesting a degree of hypoventilation separate to co-existing sleep apnea. Furthermore, waking SaO2 correlated well with both mean and minimum sleep SaO2, consistent with previous findings from our group in IPF and chronic obstructive pulmonary disease.6,18 Sleep quality was generally poor with only minor differences between those with and without SDB. Although AHI ≥ 5 was documented in almost half of patients, the presence of an OSAS, as defined by AHI ≥ 5 plus daytime sleepiness,15 was only found in 10% of patients. CCL-18 and CRP levels correlated with physiological markers of fibrosis.
The physiological basis for greater oxygen desaturations noted during sleep compared with exercise in IPF has a number of potential mechanisms. IPF patients have ‘stiff’ lungs, with increased elastic recoil and decreased compliance.19 To overcome both airway resistance and lung compliance, patients adapt by taking rapid, shallow breaths to minimize the work of breathing. A fall in SaO2 with exercise is not uncommon as the disease progresses and can be explained by the combination of two mechanisms. First, the decreased diffusing capacity of the lungs combined with the increased cardiac output associated with exercise and thus decreased circulation time at the level of the alveolar capillary does not allow adequate time for oxygen diffusion across the thickened membrane. Second, there is a worsening of ventilation perfusion mismatching during exercise as a result of increased respiratory rate.
The reasons for greater oxygen desaturation during sleep compared with exercise are less clear. AHI ≥ 5 was found in almost half of patients, which may be a contributing factor, although this did not correlate with lower mean or minimum SaO2. Our previous findings of decreased respiratory rate during sleep in IPF may contribute to decreased minute ventilation during sleep,6 supported by the observed increase in PtCO2 among the present patients. However, other previous reports found a drop in respiratory rate only with the addition of supplemental oxygen.20,21 Functional residual capacity can fall by 20% on lying down and a further 10% with the onset of sleep, which can lead to an increased atelectasis and ventilation perfusion mismatch and thereby an increase in dead space.22
CCL-18 levels are a predictor of disease activity in IPF, and our findings of a relationship between CCL-18 levels and lung function impairment are similar to previous reports.23 Here, we also describe a strong relationship between CCL-18 levels and both arterial oxygen and carbon dioxide tension. The mechanisms of increased serum CCL-18 concentrations in patients with IPF remain unclear, but may include underlying changes in macrophage activation leading to an increase in systemic CCL-18 concentrations.24–26 Prasse et al.8 have shown that in the lung CCL-18 is mainly produced by macrophages and alveolar macrophages from patients with IPF and other fibrotic lung diseases produce up to 100-fold higher CCL-18 levels than alveolar macrophages from healthy volunteers or patients with non-fibrotic lung disease.8 Serum CCL-18 concentrations correlate with disease progression and clinical course in patients with fibrotic lung disease.8,27
The association of CRP with physiological markers and SDB in IPF patients is novel. We demonstrate a significant relationship between CRP and A-a gradient, CO2 rise during sleep, mean sleep SaO2 and exercise capacity indicators. CRP is a non-specific inflammatory marker and is well documented to be elevated in coronary artery disease and obstructive lung disease.28,29 The role of inflammation in IPF remains controversial and the finding of an increased CRP in the context of this study may relate to inflammation elsewhere in the body, due to the non-specific nature of this biomarker.
Overall, these results regarding biomarkers suggest that CRP and CCL-18 may be useful markers of fibrotic activity, daytime hyperventilation and nocturnal hypoventilation.
Our findings of poor sleep quality in IPF patients are consistent with previous reports.30,31 Sleep quality was especially poor in those with AHI ≥ 5, where respiratory arousals were also more frequent. The finding of AHI ≥ 5 in 45% of our cohort is higher than a general population of similar age, but lower than previously reported by both Mermigkis et al.30 and Lancaster et al.4 However, only 10% of our cohort fulfilled the standard criteria for OSAS.15 Thus, our findings support the view that poor sleep quality in IPF is predominantly a direct result of the disease itself rather than co-existent sleep apnea. Recent work from Kolilekas et al.31 found that intermittent sleep oxygen desaturation significantly exceeds that of maximal exercise and is associated with survival in IPF patients.31 Our study added further to this observation by testing not only physiological variables but also biological. Our study differed by having an acclimatization night to improve reliability of reported sleep disturbance and PtcCO2 measurement to aid investigation of mechanisms of oxygen desaturation.
Our study has several strengths. We undertook a broad range of detailed physiological and biological measurements that provide novel data, particularly relating to biological markers associated with SDB in IPF patients. We acknowledge the limitation of relatively small patient numbers, but these were sufficient to demonstrate clear differences in the primary study end points.
The clinical implications of this study are that nocturnal oxymetry may be indicated in patients with IPF as part of the initial investigations, including when evaluating the need for oxygen supplementation. Also, raised levels of the biological markers, CCL-18 and CRP provide evidence in support of the biological impact of this desaturation as a clinically important event and a marker of poor prognosis.
Supplementary material
Supplementary material is available at QJMED online.
Acknowledgements
The authors thank all subjects for participating in this study and all staff members of the Sleep Laboratory at St Vincent’s University Hospital for their help and support.
Funding
Supported by the Lung Research Fund at St Vincent’s Hospital and Science Foundation of Ireland. The funding body had no influence over the design, data collection, analysis or manuscript writing of this article.
Conflict of interest: None declared.
