


Forced vital capacity and forced expiratory volume in six seconds as predictors of reduced total lung capacity
- J. Vandevoorde 1 ,
- S. Verbanck 2 ,
- D. Schuermans 2 ,
- L. Broekaert 1 ,
- D. Devroey 1 ,
- J. Kartounian 1 and
- W. Vincken 2
- Dept of1 General Practice, and 2Respiratory Division, Academic Hospital, University of Brussels, Brussels, Belgium.
- J. Vandevoorde, University of Brussels (Vrije Universiteit Brussel), Dept of General Practice, Laarbeeklaan 103, B-1090 Brussels, Belgium. Fax: 32 24774301. E-mail: Jan.Vandevoorde{at}vub.ac.be
Abstract
The present study aims to derive guidelines that identify patients for whom spirometry can reliably predict a reduced total lung capacity (TLC). A total of 12,693 lung function tests were analysed on Caucasian subjects, aged 18–70 yrs.
Restriction was defined as a reduced TLC. Lower limits of normal (LLN) for TLC were obtained from the European Respiratory Society recommended reference equations. Reference equations from the National Health and Nutrition Examination Survey III were used for forced vital capacity (FVC) and forced expiratory volume in six seconds (FEV6). The performance of FVC and FEV6 to predict the presence of restriction was studied as follows: 1) using two-by-two (2×2) tables; and 2) by logistic regression analysis. Both analyses were performed in obstructive (defined as forced expiratory volume in one second (FEV1)/FVC or FEV1/FEV6 <LLN) and nonobstructive subgroups, and separately for males and females.
The 2×2 tables showed generally low positive and high negative predictive values for FVC or FEV6 below their LLN in predicting a reduced TLC. Logistic regression analysis showed that in nonobstructive subjects, restriction can be positively predicted if FVC or FEV6 is <55% predicted (males) or <40% pred (females). Restriction can be ruled out if FVC or FEV in six seconds is >100% pred (males) or >85% pred (females).
In obstructive patients, spirometry cannot reliably diagnose a concomitant restrictive defect, but it can rule out restriction for patients with forced vital capacity or forced expiratory volume in six seconds >85% pred (males) or >70% pred (females).
- Forced expiratory volume in six seconds
- forced vital capacity
- restrictive ventilatory defect
- spirometry
- total lung capacity
Pulmonary function tests are performed to diagnose or rule out obstructive, restrictive or mixed ventilatory defects 1. Airway obstruction is directly defined by spirometry and is characterised by the presence of a low forced expiratory volume in one second (FEV1)/forced vital capacity (FVC) or FEV1/forced expiratory volume in six seconds (FEV6) ratio 1–3. The spirometric diagnosis of restriction is more problematic; while the presence of a restrictive pulmonary impairment can be suspected if FVC or FEV6 are low, their positive predictive value (PPV) is low, e.g. 58% in a study population of 264 White patients with a low FVC and a normal FEV1/FVC ratio 4. Current interpretative guidelines are based on the assumption that a reduced total lung capacity (TLC) is the gold standard for the diagnosis of a restrictive ventilatory defect, thus requiring lung volume measurement by gas dilution or whole body plethysmography techniques 1.
Previous studies have demonstrated that FEV6 can be a reliable surrogate for FVC in the detection of obstruction as well as in the exclusion of restriction 2, 3, 5, 6. As FEV1/FVC (or FEV1/vital capacity (VC)) is considered as a “de facto gold standard” for the detection of obstruction, FEV6 can never be shown to outperform FVC (or VC) in the denominator of this ratio to better reflect true airway obstruction. For restriction, however, the performance of both spirometric indices, FVC (or VC) and FEV6, can be tested alongside against the measurement of TLC. In fact, Swanney et al. 5 demonstrated that FEV6 is equivalent to FVC in the detection of a reduced TLC by testing whether it made any difference if FVC or VC were replaced by FEV6 in three different spirometry-based algorithms for predicting a reduced TLC. For instance, the American Thoracic Society algorithm was used to compare the performance of the combined condition (FEV1/VC ≥lower limits of normal (LLN) and FVC<LLN) versus the combined condition (FEV1/FEV6≥LNN and FEV6<LLN), against the gold standard (TLC<LLN). This yielded a PPV of ∼55% for both and a negative predictive value (NPV) of 99% for both. However, the PPV only provides an overall measure of probability for the presence of a reduced TLC in all subjects with a reduced FVC or FEV6. Since the probability of the presence of restriction will obviously vary as the measured FVC or FEV6 values lie further from the cut-off point, a clinically relevant piece of information is overlooked.
The dependence of the probability of restriction (defined as a reduced TLC 1) as a function of FVC or FEV6 can be elegantly characterised by use of a logistic regression analysis. This approach offers the possibility to choose a level of tolerance on probability (e.g. 5% error) and to determine the corresponding cut-off points for FVC and FEV6 measurements that can positively predict or exclude a reduced TLC. In contrast to previous studies, the present authors opted to take a practice-oriented approach by first classifying the subjects into obstructive and nonobstructive groups, before assessing the performance of FVC and FEV6 to detect a low TLC in either subgroup. The effect of sex on the relationship between FVC or FEV6 and TLC was also investigated. The purpose of the proposed logistic regression analyses was to derive sex-specific algorithms that define patient groups for which spirometry (FVC or FEV6) can suffice to diagnose restriction, and for whom the more complex and expensive TLC measurements can be avoided.
METHODS
The study population comprised all consecutive Caucasian, adult patients referred to the pulmonary function laboratory of the Academic Hospital of the University of Brussels (Vrije Universiteit Brussel, Brussels, Belgium) between January 1992 and September 2005. Test results were included if subjects had undergone both spirometry and TLC measurements on the same visit. For subjects who had undergone several such examinations over this 14-yr period, only the measurements from their first visit were used. Spirometry had been performed with a mass flow sensor (SensorMedics model 2200; Viasys Health Care, Yorba Linda, CA, USA) and lung volume measurements had been made using a body plethysmograph (SensorMedics model 6200 Bodybox; Viasys Health Care). Both tests were carried out according to the guidelines of the European Respiratory Society (ERS) 7 by highly trained pulmonary function technicians. While FEV1 and FVC values were directly available, the relatively new FEV6 value had to be extracted from the retrieved spirometric curves.
Reference equations from the National Health and Nutrition Examination Survey III 8 were used to calculate the LLN, which correspond to the fifth percentile, for FEV1, FEV6, FVC, FEV1/FEV6 and FEV1/FVC. Predicted values were obtained for FEV1, FEV6 and FVC using reference equations from the same study. For TLC, LLN were obtained from reference equations endorsed by the ERS 9, which apply to a height range of 1.55–1.95 m in males, and 1.45–1.80 m in females, and to ages between 18–70 yrs.
All of the following analyses were performed separately for males and females. Sex-separated patients were first classified into obstructive and nonobstructive subgroups on the basis of whether their FEV1/FVC or FEV1/FEV6 fell below the respective LLN or not. The performance of spirometry to detect a reduced TLC was then further explored within each of these two subgroups. A restrictive pulmonary impairment was defined as a TLC below its LLN 1, and served as a gold standard for the comparison of FVC and FEV6 performance to detect restriction. This was done using two different methods. The first method considers fixed cut-offs, using the percentage of the predicted value (% pred) for FVC (<80% pred) or FEV6 (<82% pred) to define a spirometric restrictive pattern; the 82% pred cut-off for FEV6 was based on the present authors’ earlier work 6. The second method considers a spirometric restrictive pattern when FVC or FEV6 fall below their respective LLN. The fixed cut-off and LLN methods were then used to determine sensitivity, specificity, PPV and NPV for the detection of a reduced TLC by means of two-by-two (2×2) tables, and to determine the probability of a reduced TLC for each given value of FVC and FEV6 by means of logistic regression.
In the logistic regression analysis, the presence of restriction, as determined by TLC measurement, served as the dependent variable, while FVC or FEV6 served as an independent variable. For each independent variable (x), the probability of the presence of a reduced TLC (p) was then calculated by fitting the function:
p = e(a+bx)/(e(a+bx)+1) (1)
where a and b are the parameters fitted by the logistic model 10.
Finally, the possibility of ascertainment bias was assessed by comparing the frequency of a spirometric restrictive pattern, defined as FVC<LLN, in the present study population with that in the total group of patients attending the lung function laboratory over the course of the same 14-yr study period, i.e. also including patients who did not undergo lung volume measurement. Again, for those subjects, only the measurements from their first visit were used.
RESULTS
A total of 12,693 pulmonary function tests obtained from consecutive Caucasian subjects were eligible for analysis, taking into account restrictions for age (18–70 yrs) and height (1.55–1.95 and 1.45–1.80 m in males and females, respectively) imposed by the combined sets of reference equations for the spirometric indices and TLC 8, 9. The present study population (n = 12,693) comprised almost 80% of the entire patient population attending the lung function laboratory, i.e. including those patients who underwent spirometry without TLC measurement (n = 16,134). The prevalence of patients with FVC<LLN was very similar between the population under study (21.8% = 2,765 out of 12,693) and the total population (21.9% = 3,540 out of 16,134). This suggests there was no significant ascertainment bias in the population under study. Characteristics of the present study population are presented in table 1⇓: 56.2% were male, 34.2% were categorised as obstructive and 10.6% as restrictive. Both obstruction and restriction were more frequent in males than in females (obstruction: 37.3% (males) versus 30.3% (females); restriction: 14.7% (males) versus 5.3% (females)).
Subject demographics
Two-by-two tables
Part of table 2⇓ shows the sensitivity and specificity results for FVC and FEV6 in predicting a reduced TLC (TLC<LLN) in the nonobstructive population, i.e. subjects with FEV1/FVC or FEV1/FEV6≥LLN. When using FVC<LLN as the method to detect a reduced TLC, FVC had a sensitivity of 68% and a specificity of 94% in males. With a 17.7% prevalence of restriction in nonobstructive males, PPV was 70% and NPV 93%. For the females, sensitivity and specificity were 81 and 92%, respectively. With a prevalence of 6% in nonobstructive females, PPV and NPV were 38 and 99% respectively. As can be appreciated from table 2⇓, very similar results were obtained when using either the LLN of FEV6, or FVC and FEV6 with their respective fixed cut-off points to determine a spirometric restrictive pattern.
Comparison of forced vital capacity(FVC) and forced expiratory volume in six seconds (FEV6) for the detection of a reduced total lung capacity (TLC)#
Table 2⇑ also shows the results of the same analysis in the obstructive population. In this group, FVC<LLN produced a sensitivity of 90% and a specificity of 69% in males. The prevalence of restriction was 9.7% in obstructive males, and the corresponding PPV was only 24% while the NPV was 99%. For the females, sensitivity and specificity were 91 and 72%, respectively. With a prevalence of 3.9% in obstructive females, PPV and NPV were 11 and 100%, respectively. Again, similar results were obtained when using either FEV6<LLN or the fixed cut-off points for FVC and FEV6 to determine a restrictive spirometric pattern.
Logistic regression analysis
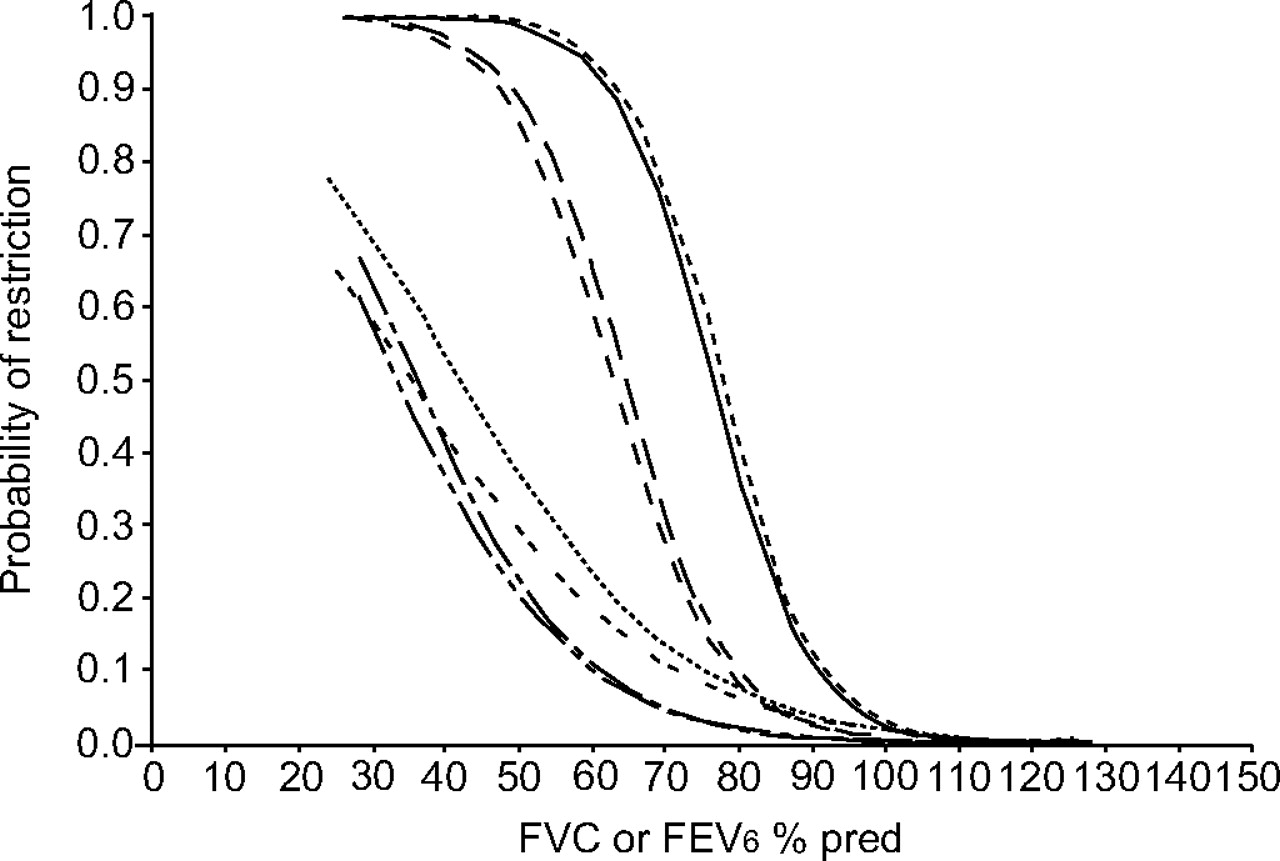
Figures 1⇓ and 2⇓ show the probability curves for detecting restriction (defined as TLC<LLN) as a function of FVC or FEV6, resulting from sex-specific logistic regression analysis, in the obstructive and nonobstructive groups. These curves plot the probability of finding restriction (on the y-axis) depending on a subject's FVC or FEV6 (on the x-axis). Measured values for FVC and FEV6 ranged from 25–150% pred and from 0.3–2×LLN. For instance, figure 1⇓ shows that for nonobstructive subjects with a FVC of 70% pred, the probability of restriction, based on a reduced TLC, is 73% for males, while it is only 27% for females. For an obstructive patient with the same FVC, the probability of restriction is as low as 14% (males) or 5% (females). Figure 2⇓ shows that the probability curves are very similar when using FVC or FEV6 expressed as a fraction of their respective LLN. When using FEV6 instead of FVC, corresponding probabilities are slightly greater in the nonobstructive group and lower in the obstructive group, especially in males. However, the difference in probability between FVC and FEV6 did not exceed 1%, justifying the use of one common cut-off for FVC and FEV6.

Probability of true restriction (defined as total lung capacity<lower limit of normal) in males and females, respectively, using % predicted (% pred) for forced vital capacity (FVC) or forced expiratory volume in six seconds (FEV6), in the nonobstructive and obstructive groups. Nonobstructive: –––––: FVC, male; ------: FEV6, male; – – –: FVC, female; — — —: FEV6, female. Obstructive: ········: FVC, male; -- -- --: FEV6, male; –– · –– ·: FVC, female; — ·· — ·· : FEV6, female.

Probability of true restriction (defined as total lung capacity<lower limit of normal (LLN)) in males and females separately, using forced vital capacity (FVC) or forced expiratory volume in six seconds (FEV6) as a fraction of their respective LLN, in the nonobstructive and obstructive groups. Nonobstructive: –––––: FVC, male; ------ : FEV6, male; – – – : FVC, female; — — — : FEV6, female. Obstructive: ········: FVC, male; -- -- --: FEV6, male; –– · –– · : FVC, female; — ·· — ·· : FEV6, female.
Table 3⇓ translates the logistic regression findings into guidelines for detection and exclusion of a reduced TLC in the different patient groups. For instance, in the nonobstructive group, the presence of a restrictive impairment can be predicted with a probability of >95% if the measured value of FVC or FEV6 falls below 55% pred in males or 40% pred in females. Similarly, it can be ruled out with a <5% error if measured values are >100% pred in males or 85% pred in females. Similar algorithms are obtained when using LLN. Finally, it is noted that in obstructive patients, even a markedly reduced FVC or FEV6 cannot predict the presence of a reduced TLC with >75% certainty (see figs 1⇑ and 2⇑).
Spirometry-based algorithm for the diagnosis or exclusion of a reduced total lung capacity (TLC)
The gain, in terms of using spirometry as a substitute for TLC measurement, is more marked for the exclusion than the diagnosis of restriction. Indeed, when applying the algorithm of table 3⇑ to the present study population, 7% of restricted patients (TLC<LLN) would have been detected without lung volume measurements, whereas 68% of subjects without restriction would have been identified with spirometry only.
DISCUSSION
The present study confirms the results of previous studies, where 2×2 table analysis had indicated a low PPV and high NPV for FVC and FEV6 in predicting a restrictive ventilatory defect 4, 5, 12. In the present work, a logistic regression analysis was included to provide FVC and FEV6 cut-offs leading to sex-specific algorithms that enable the identification of patients with a reduced TLC, solely on the basis of spirometry (table 3⇑). The striking similarity between all logistic curves for FVC and FEV6 allowed the current authors to propose common cut-off values for FVC and FEV6. From the present results, it is clear that spirometry is more suitable for the exclusion than for the diagnosis of restriction. The algorithms used herein were also designed to better relate to the clinical context in which subjects are first categorised as obstructive or nonobstructive, based on either the FEV1/FVC or FEV1/FEV6 ratio, and subsequently classified as restrictive, based on either FVC or FEV6. This distinction clearly revealed the expected differences in performance of either FVC or FEV6 for predicting restriction in obstructive versus nonobstructive subjects. The current authors have no explanation for the marked sex-related differences in FVC or FEV6 cut-offs. Although the lower PPV and higher NPV in the female subgroup could be explained by the lower prevalence of restriction, the logistic regression analysis does suggest an intrinsic sex difference.
In the nonobstructive subjects, it is possible to define cut-off points for FVC (% pred) or FEV6 (% pred) beyond which a low TLC can be positively predicted or excluded by spirometry alone (figs 1⇑ and 2⇑). Figure 1⇑ also very clearly demonstrates that the most commonly used cut-off for spirometric detection of restriction (FVC<80% pred, in the face of a normal or above normal FEV1/FVC) should be used with caution. Indeed, when applying an FVC of 80% pred to the nonobstructive subgroup, the corresponding probability of true restriction would only be 37% in males and 8% in females.
In obstructive patients, spirometry cannot be used to detect a concomitant restrictive defect due to a very high false positive rate. This is not surprising, since a reduced FVC in patients with obstructive lung disease may result from lung hyperinflation and air trapping, characterised by an increase in the residual volume, with a normal or above normal TLC. In addition, lung hyperinflation has shown to be highly correlated with the degree of airway obstruction 13. Nevertheless, in the obstructive group, spirometry can still be used to rule out a reduced TLC for patients with FVC or FEV6 ≥85% pred in males and ≥70% pred in females.
Criticisms of the method
Subjects were included only if both spirometry and lung volume measurements had been performed on the same day. This raises the potential of ascertainment bias. However, the overall PPV and NPV results (table 2⇑) are consistent with results of previous studies, reporting a prevalence of restriction ranging 12.3–21.2% 4, 5, 12. In addition, the present study shows a similar frequency of a spirometric restrictive pattern between the study population and the entire population attending the lung function laboratory.
Another possible criticism of the present study concerns the reference values of the spirometric indices and lung volumes, which were derived from different sources. However, to the best of the present authors’ knowledge, there is no single source available which provides reference values for all parameters used in the present study.
CONCLUSION
The present study demonstrates that forced expiratory volume in six seconds is equivalent to forced vital capacity in the detection of a reduced total lung capacity. A sex-dependent algorithm has been developed for nonobstructive and obstructive subgroups, to identify patient groups for whom a reduced total lung capacity can be either positively detected or ruled out solely by use of a forced expiratory volume in six seconds or forced vital capacity measurement. This algorithm could help clinicians, especially those in primary care, to decide whether lung volume measurements are necessary for the diagnosis of restriction.
Statement of interest
None declared.
- Received March 16, 2007.
- Accepted September 19, 2007.
- © ERS Journals Ltd