


Automatic detection of sleep-disordered breathing from a single-channel airflow record
- 1Dept of Pulmonology, Fukuoka National Hospital, Fukuoka, and 2Dept of Public Health Medicine, Graduate School of Comprehensive Human Sciences, University of Tsukuba, Tsukuba, Japan.
- H. Nakano, Dept of Pulmonology, Fukuoka National Hospital, 4-39-1 Yakatabaru, Minami-ku, Fukuoka, 811-1394, Japan. Fax: 81 929669444. E-mail: nakano_h{at}palette.plala.or.jp
Abstract
Single-channel airflow monitors developed for screening of sleep-disordered breathing (SDB) have conflicting results for accuracy. It was hypothesised that the analytical algorithm is crucial for the performance and the present authors tried to develop a novel computer algorithm.
A total of 399 polysomnography (PSG) records were employed, including a thermal sensor signal. The first 100 records were used in the development of the algorithm and the remainder for validation. In addition, 119 PSG records, including a thermocouple signal and a nasal pressure signal, were used for the validation. The algorithm was designed to obtain a time series (flow-power) using power spectral analysis, which expresses fluctuation in the airflow signal amplitude. From the time series the algorithm detects transient falls of the flow-power and calculates flow-respiratory disturbance index (RDI), defined as the number of falls per hour.
In the validation group, the areas under receiver operating characteristic curves for diagnosis of SDB (apnoea/hypopnoea index ≥5) were 0.96, 0.95 and 0.95, for the records of the thermal sensor, thermocouple and nasal pressure system, respectively. The diagnostic sensitivity/specificity ratios of the flow-RDI were 96/76, 88/80 and 97%/77%, respectively.
The present results suggest that a single-channel airflow monitor can be used to detect sleep-disordered breathing automatically if the analytic algorithm is optimised.
- Power spectral analysis
- screening
- signal processing
- sleep apnoea
Sleep-disordered breathing (SDB) is known to be a relatively common condition which can affect 24 and 9% of middle-aged males and females, respectively, when it is defined by five or more episodes of apnoea or hypopnoea per hour of sleep regardless of symptoms 1. Many studies have indicated that SDB, even in a mild stage, is strongly associated with cardiovascular morbidity 2–4, as well as traffic accidents 5–6. Thus, undiagnosed SDB is considered an important public health problem 7. In a clinical setting, the exact diagnosis of SDB is made by polysomnography (PSG), which is a labour-intensive and time-consuming process, and is thus impractical to perform as part of a general population health check-up. In Japan, several surveys using pulse oximetry have been performed and a high prevalence of SDB was found in working populations 8. However, this method has a limitation since oximetry cannot always detect apnoea events, especially for nonobese subjects 9. Recently, Ayappa et al. 10 reported that manual analysis of the flow signal could provide a result similar to that obtained by full PSG analysis. Furthermore, several single-channel airflow monitors have been developed for automated detection of SDB 11–13. Studies for the accuracy of these monitors have provided conflicting results and it is unclear whether performance depends on the signal acquisition system, including the sensor, or on the analytical algorithm. It was hypothesised that automated analysis of a single-channel airflow record may have a good diagnostic performance for SDB when the analytic algorithm is fully optimised. In order to test the hypothesis, a novel computer algorithm for flow signal analysis was developed to detect SDB and it was validated against a series of PSG records. The algorithm was developed for a thermal flow sensor, but it was also validated for another type of thermal sensor and a nasal pressure sensor.
METHOD
Subjects
A retrospective sample of diagnostic PSG records from January 2002 to September 2003 (group 1) was used. A thermal sensor was employed to detect airflow. Group 1 contained 418 PSG records from patients who were referred for suspected SDB from general practitioners or consulted the present authors’ clinic due to the presence of symptoms suggestive of SDB, i.e. habitual snoring (n = 355), daytime sleepiness (n = 351), witnessed apnoea (n = 346) and nocturnal choking (n = 140). From the sample, the first 105 records (development group) were used for the development of the algorithm and the subsequent 313 records (validation group) were used for the validation of the algorithm. From the development group, five records were excluded due to poor signal quality. From the validation group, 14 records were excluded due to failure in channels other than airflow. Records with poor airflow signal were not excluded from the validation group, even if the record was difficult to interpret by visual inspection, since the aim of the development of the algorithm was its use in a fully automated analysis of the airflow record. The characteristics of the patients are listed in table 1⇓.
Characteristics of subjects in group 1
Another series of diagnostic PSG records from July 2005 to December 2005 (group 2), when both a nasal prong-pressure transducer and a thermocouple sensor were used to detect airflow, were employed to evaluate the applicability of the algorithm to other types of flow sensor. Group 2 contained 120 PSG records, of which only one record was excluded due to failure in a respiratory movement channel. These PSG records included either or both nasal prong-pressure record (n = 117) and thermocouple record (n = 116).
PSG
The sensors for PSG were fixed by technicians in the Fukuoka National Hospital (Fukuoka, Japan) but the sensors were not monitored after the start of the recording. PSG was recorded using a polygraph system (EEG7414; Nihon Kohden, Tokyo, Japan). Oronasal airflow was monitored with a thermal sensor as follows: 1) for group 1, a polyvinylidene fluoride (PVDF) film (PVDF sensor; Dymedix Corporation, Minneapolis, MN, USA); and 2) for group 2, a thermocouple sensor (Pro-Tec, Mukilteo, WA, USA). In group 2 a nasal prong-pressure transducer (PTAF; Pro-Tec) was also used to monitor airflow. Thoracic and abdominal respiratory movements were monitored by respiratory inductive plethysmography (RIP; Respitrace; Ambulatory Monitoring Inc., Ardsley, NY, USA), which was calibrated by an iso-volume manoeuvre before the test. Signals of airflow and respiratory movement were recorded at a sampling frequency of 10 Hz. Oxyhaemoglobin saturation was monitored using a pulse oximeter (OLV-3100; Nihon Kohden) at the fastest response mode and recorded at a sampling frequency of 1 Hz. Sleep stages were scored manually according to standard criteria 14. The oximetry data were analysed automatically with a personal computer to detect any arterial oxygen saturation (Sa,O2) dip ≥3% lasting for 10–120 s. The oxygen desaturation index (ODI) was defined by the number of Sa,O2 dips per hour of examination. Hypopnoea (including apnoea) was defined as follows: 1) a ≥50% reduction of amplitude in the RIP sum signal lasting ≥10 s; or 2) a discernible reduction (≥30–<50%, duration ≥10 s) in the RIP sum signal associated with ≥3% oxygen desaturation or an arousal 15, 16. The scoring of apnoea–hypopnoea events was performed by automated detection based on the RIP amplitude criteria, followed by a thorough manual review and editing. The manual review was performed on the computer screen and the amplitude of each signal was adjusted to be adequate for visual analysis. The RIP sum channel was used primarily for hypopnoea identification; however, in a few cases where airflow signal correlated with change in oxygen saturation better than RIP signal, the raw airflow channel was used. The scoring was carried out before the development of the algorithm for the current study. The apnoea/hypopnoea index (AHI) was calculated as the number of apnoea and hypopnoea events per hour of sleep. Respiratory effort-related arousals (RERAs) were not scored. Due to the scoring method outlined previously, in most cases the thermal sensor signal did not contribute to the AHI value.
Development of algorithm
For the automated analysis of the airflow signal, the following procedures (fig. 1⇓) were developed using the PSG data from the development group.

Schematic display of signal processing in the algorithm. a) Procedures to obtain flow-power time series from raw data of airflow signal are shown for a 60-s segment, which includes an apnoea event. b) Filtered flow-power time series usually showed a fall, designated as a flow-power dip, at an apnoea/hypopnoea event. A flow-power dip is defined as a fall of more than a threshold value within 30 s, followed by a normalisation part starting within 90 s. The computer algorithm detects any decrease as a possible start-point of the flow-power dip and determines whether the following part satisfies the above conditions.
Generation of flow-power time series
The first step of the algorithm was generation of a time series which expressed the variation of the respiratory airflow. For this step, a fast Fourier transformation (FFT) of the airflow signal was used to obtain the short-time power spectrum within the bandwidth of respiratory frequency. This power spectrum was designated as “flow-power.” The time window used for the FFT was the Hanning window of 128 points (12.8 s). The bandwidth of respiratory frequency was set at 0.167–0.533 Hz (10–32 cycles·min−1) since respiratory frequencies between apnoea events were observed within this range in the 100 subjects included in this section of the study. FFT was performed every 2 s (overlapped windows). The flow-power was logarithmically transformed and expressed in dB (the maximal value was set as 0 dB).
Power dB = 10×log10 (power/maximal power) (1)
Thereafter, the flow-power time series was low-pass filtered to obtain a smooth contour.
Detection of the flow-power dip
The second step of the algorithm was detection of the SDB events. The typical change in flow-power at the SDB event was a transient decrease, which was detected when there was a decrease greater than the threshold value within 30 s followed by a normalisation part starting within 90 s (fig. 1b⇑). Such a decrease in the flow-power was designated as a “flow-power dip.”
Tuning of the algorithm
To determine the aforementioned threshold value for the detection of flow-power dips, the present authors compared the concordance between the number of apnoea–hypopnoea events detected by PSG and the number of flow-power dips at various threshold values. Thereafter, flow-power dips were detected at the determined threshold and a respiratory disturbance index (RDI) was obtained, defined as the number of flow-power dips per hour of examination. To determine an appropriate flow-RDI cut-off value, a receiver operating characteristic curve (ROC) was constructed to diagnose three levels of SDB (AHI ≥5, ≥10 and ≥15).
Validation of the algorithm
The developed algorithm was applied to the PVDF thermal sensor record of the validation group in group 1 and to the nasal pressure record and thermocouple record in group 2 in order to calculate flow-RDI. The square root of the pressure was used as the flow signal for the nasal prong-pressure transducer system 17.
The relationship between the flow-RDI and the AHI was evaluated using Pearson's correlation coefficient. The agreement between these data was analysed as described by a Bland–Altman plot 18. The diagnostic ability of the flow-RDI for SDB was evaluated in terms of sensitivity and specificity.
To evaluate event-by-event agreement, the present authors compared the events detected using three methods of automated detection according to the algorithm, visual inspection of the flow sensor record and of full PSG records, during mid-1-h sleep in 100 consecutive PSG records. Visual detection of apnoea–hypopnoea events (≥50% reduction of amplitude, lasting ≥10 s) from the flow sensor record was performed on the computer screen, which visualised only the flow sensor record. The event-by-event agreement was evaluated using the proportion of specific agreement (PSA) 19, 20. In addition, in order to evaluate the effect on flow-RDI of artefacts and irregular breathing while awake, the awake flow-RDI for ≥10-min continuous awake segments was calculated in 50 patients in group 1 who had low sleep efficiency (<66%).
Comparison with other methods
Comparison with a conventional automatic analysis of flow signal
The diagnostic performance of the developed algorithm was compared with that of a conventional automated analysis using the flow-channel data of the validation group in group 1. A computer program was employed (Screening.exe 21 for flow signal alone; NGK SparkPlug Co. Ltd, Nagoya, Japan) as the conventional analysis of the airflow signal. This program is designed to detect a flow signal amplitude decrease (>50%; duration ≥10 s) from baseline. The number of events per hour of examination obtained by the program was designated as “conventional RDI.” The diagnostic performance of conventional RDI was evaluated as described previously. To compare the diagnostic sensitivity and specificity between the flow-RDI and the conventional RDI, the ROCs were constructed and the areas under the curves (AUCs) calculated. The comparisons of the AUCs were performed by the Hanley and McNeil method 22.
Comparison with oximetry
The diagnostic ability of flow-RDI and ODI were compared in the validation group in group 1. A separate comparison was also conducted for normal-weight group (body mass index (BMI) <25) and overweight/obese group (BMI ≥25).
RESULTS
Development of algorithm
Flow-power time series
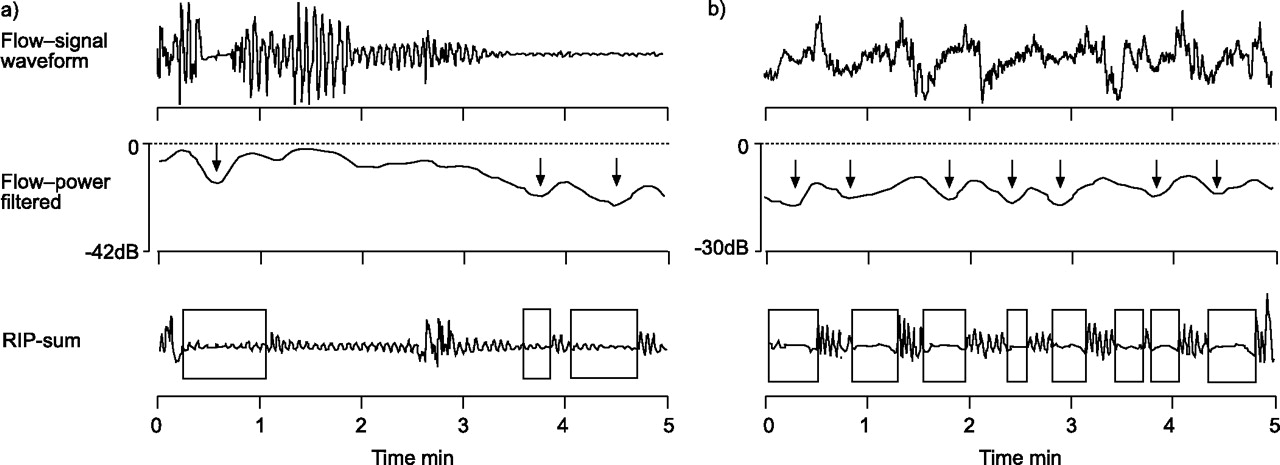
A representative case is shown in figure 2⇓. Transient decreases in the flow-power (flow-power dip) corresponding to SDB events were clearly identified in the filtered flow-power time series. Even in the case of a noise-contaminated airflow signal, the filtered flow-power time series depicted SDB events clearly (fig. 3⇓).

10-min flow trace in which 14 events of apnoea or hypopnoea were observed. Filtered flow-power shows a clear transient decrease (flow-power dip; ↓), which corresponds to an apnoea or hypopnoea event. The change in arterial oxygen saturation (Sa,O2 dip; ↓) follows that of flow-power with a time-lag of ∼30 s.

Two cases with poor airflow signal quality. The arrows in the flow-power trace indicate the positions of automatically detected flow-power dips. The boxes in the respiratory inductive plethysmography (RIP)-sum of chest and abdominal signals traces indicate apnoea/hypopnoea events detected by visual inspection of full PSG records. In a) the amplitude of the flow signal decreased in the latter part of the trace. All three events were correctly detected by the automatic flow analysis. In b) the flow signal was very poor due to noise contamination. Although the flow signal was difficult to interpret visually, seven out of eight events were correctly detected by the automatic flow analysis.
Determination of the threshold for the flow-power dip
In the development group, the intra-class correlation coefficients between the number of flow-power dips and the number of apnoea–hypopnoea events were 0.72, 0.93, 0.94, 0.91 and 0.87, for the flow-power dip thresholds of 3, 4.5, 6, 7.5 and 9 dB, respectively. As a result, the appropriate threshold was determined to be 6 dB.
Determination of the cut-off value for flow-RDI
From the ROCs for the diagnosis of three levels of SDB in the development group, the appropriate flow-RDI cut-off values were determined to be 5, 7.5, and 10 for the SDBs of AHI ≥5, ≥10 and ≥15, respectively. The sensitivity and specificity at these cut-off values were 92 and 80, 93 and 84, and 90% and 83%, respectively.
Validation of the algorithm
Agreement between flow-RDI and AHI
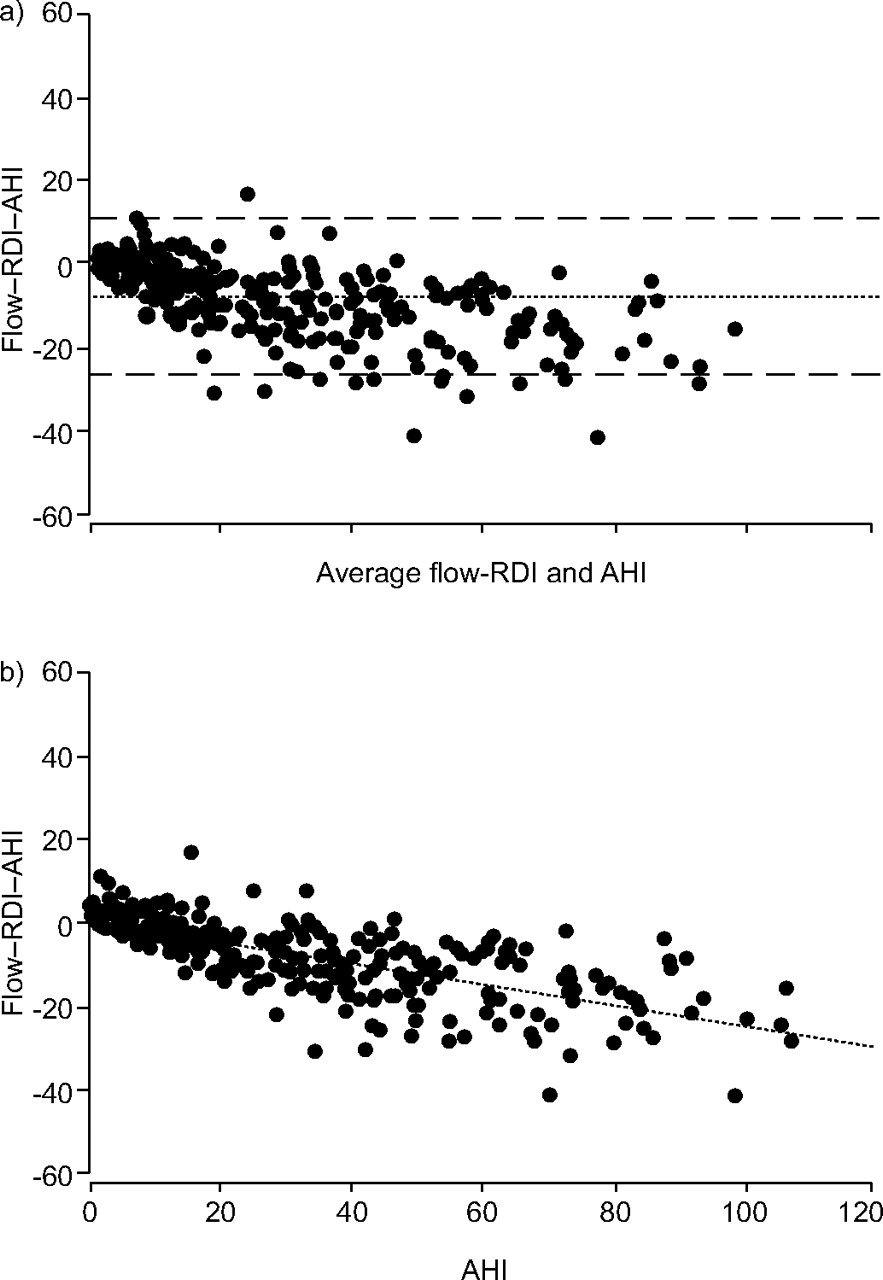
The correlation coefficients between flow-RDI and AHI were high regardless of flow sensor type (table 2⇓). Bland–Altman analysis showed that the difference between flow-RDI and AHI was narrower for the nasal pressure sensor compared with the other sensors. The bias in group 1 (PVDF sensor) is shown in figure 4⇓. The bias was highly correlated with AHI (fig. 4b⇓).

Bland–Altman plots. a) Variance between the flow-respiratory disturbance index (RDI) and the apnoea/hypopnoea index (AHI). ·······: Bias (mean difference); – – –: limit of agreement (mean±1.96SD). b) Relationship between the AHI and the flow-RDI versus AHI difference. ·······: Regression line. p<0.0001, r = -0.713, y = 0.5-0.263x.
Agreement between apnoea/hypopnoea index (AHI) and flow-respiratory disturbance index (RDI)
Diagnostic ability of flow-RDI
The diagnostic sensitivity and specificity of flow-RDI in the validation group of group 1 are shown as ROCs (fig. 5⇓). The sensitivity and specificity at the pre-set flow-RDI cut-off value are shown in table 2⇑. The sensitivity was relatively high (0.95–0.97) and the specificity was moderate (0.73–0.82) for the PVDF and nasal pressure sensors. Conversely, the sensitivity was lower and the specificity higher for the thermocouple sensor when compared with the values obtained for the other sensors. The cut-off value of the flow-RDI for the thermocouple sensor to obtain sensitivity and specificity similar to the other sensors was 4.0, 5.0 and 7.5, for AHI ≥5, ≥10 and ≥15, respectively.
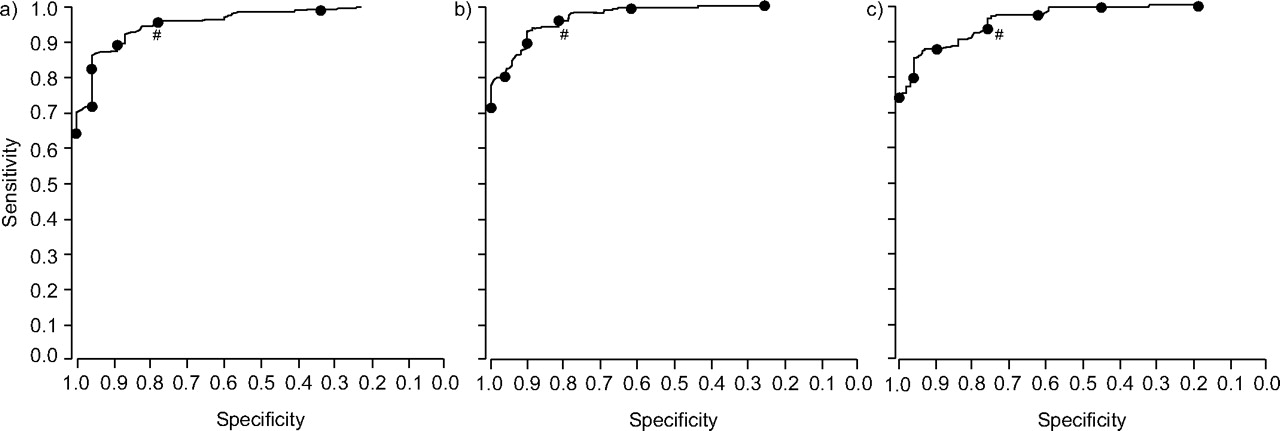
Receiver operating characteristic (ROC) curve showing the relationship between diagnostic sensitivity and specificity of the flow-respiratory disturbance index (RDI) in the validation group when the following cut-off values are used: a) apnoea/hypopnoea index (AHI) ≥5 (area under ROC curve (95% confidence interval) 0.957 (0.936–0.979)); b) AHI ≥10 (0.971 (0.955–0.988)); and c) AHI ≥15 (0.962 (0.942–0.982)). The cut-off values of the flow-RDI were: a, b) 15.0, 12.5, 10.0, 7.5, 5.0 and 2.5, respectively; and c) 17.5, 15.0, 12.5, 10.0, 7.5, 5.0 and 2.5, respectively. #: cut-off values of flow-RDI determined in the development group where a) 5.0, b) 7.5 and c) 10.0.
Event-by-event analysis
The analysis of event-by-event agreement showed that the ratio of number of events detected by the automated analysis to that of total PSG apnoea–hypopnoea events was 77, 73 and 89% for the PVDF, thermocouple and nasal pressure sensors, respectively (fig. 6⇓). The ratio of number of false positive events to that of total events detected by the automated analysis was 9, 11 and 14% for the PVDF, thermocouple and nasal pressure sensors, respectively (fig. 6⇓).

Event-by-event agreement between automatic flow analysis and full polysomnography (PSG) manual analysis for a) group 1 using a polyvinylidenefluoride sensor, b) group 2 using a thermocouple sensor, and c) group 2 using a nasal pressure sensor. □: events detected by full PSG manual analysis, a) 2,744, b) 2,420, and c) 2,420; ▒: flow-power dips detected by automatic flow analysis, a) 2,303, b) 1,974, and c) 2,501; ░: events detected using both methods, a) 2,103, b) 1,763, and c) 2,151.
The PSA between PSG analysis and automated analysis was 0.833, 0.802 and 0.874 for the PVDF, thermocouple and nasal pressure sensors, respectively. The PSA between PSG analysis and flow record manual analysis was 0.835, 0.806 and 0.893 for the PVDF, thermocouple and nasal pressure sensors, respectively.
Analysis of waking time
The mean±sd flow-RDI while awake was 13.2±11.5. The awake flow-RDI had weak but significant correlation with patient's AHI (r = 0.28, p = 0.045). The mean awake RDI for patients with AHI <15 was significantly lower than that for patients with AHI ≥15 (6.9±6.1 versus 15.2±12.2; p = 0.0036 by Welch's t-test).
Comparison with other methods
Comparison with a conventional automated analysis programme
The correlation coefficient between the conventional RDI and the AHI was 0.888 (95%confidence interval 0.861–0.910). Bland–Altman analysis showed that the mean±1.96 sd difference between the flow-RDI and the AHI was -3.2±22.2. The AUCs were 0.903, 0.924 and 0.919 for AHI ≥5, ≥10 and ≥15, respectively, all of which were significantly lower than those of the flow-RDI (p = 0.000002, 0.000020 and 0.000035 for AHI ≥5, ≥10 and ≥15, respectively).
Comparison with oximetry analysis
The diagnostic sensitivity and specificity of the ODI at the same cut-off value as flow-RDI were 94 and 84, 93 and 87, and 92% and 82% for the AHI cut-off values of ≥5, ≥10 and ≥15, respectively. The AUCs were 0.966, 0.977 and 0.961 for AHI ≥ 5, 10 and 15, respectively. All these parameters for diagnostic ability were similar to those of the flow-RDI. However, the diagnostic sensitivity of ODI was influenced by body habitus. The diagnostic sensitivity of ODI in the normal-weight group was 86, 87 and 84% for AHI ≥5, ≥10 and ≥15, respectively, while in the overweight/obese group it was 99, 97 and 97%, respectively. By contrast, the diagnostic sensitivity of the flow-RDI in the normal-weight group was 90, 95 and 96% for AHI ≥5, ≥10 and ≥15, respectively, while in the overweight/obese group it was 99, 96 and 94%, respectively.
DISCUSSION
A new algorithm was developed for fully automated detection of SDB from a single-channel airflow signal. The algorithm utilises power spectral analysis to detect the variation of airflow signal amplitude. In the validation phase of the present study, it was shown that the algorithm had a relatively high diagnostic performance when the AHI by the manual full PSG analysis was used as the diagnostic gold standard. The diagnostic sensitivity was less affected by the subjects' body habitus compared with an oximetry analysis. The algorithm was applicable not only to the thermal sensor that was used for the development of the algorithm but also to another type of thermal sensor and a nasal pressure sensor.
Technical aspect
The algorithm is unique in several points. First, it utilises power spectral analysis, by which it can lessen the effect of noise contamination since fluctuation of the airflow signal outside the possible frequency range of respiration can be eliminated. Second, it generates a time series of logarithmic power of airflow fluctuation (flow-power). The change in logarithmic power is proportional, not to the difference but to the ratio between two points. When a 6-dB decrease is observed in the time series, it means that the mean amplitude during ∼10 s decreased to one-half of that value during the preceding part. This property provides an advantage since the same scale can be used even when the level of flow signal changes due to change in the condition of the airflow sensor (e.g. a change in location) during a whole night's recording. Third, it processes the flow-power time series by a low-pass filter, which can eliminate changes irrelevant to apnoea–hypopnoea cycles. Fourth, it detects a transient decrease in flow-power (flow-power dip). The algorithm can detect the flow-power dip in a simple automated way. It is believed that these characteristics of the algorithm make the single-channel monitoring relatively accurate in the diagnosis of SDB.
Most automated analyses of airflow to detect apnoea–hypopnoea events are considered to employ waveform analysis, which detects the events based on decrease in amplitude of the airflow waveform. Although the conventional waveform analysis programme that was tested in the present study follows the apnoea–hypopnoea definition literally, a considerable number of the events detected by the programme appeared not to be real events upon visual inspection. A pattern recognition method on waveform is thought to be susceptible to various kinds of artefact. To the present authors’ knowledge, only one prior study 23 has used power spectral analysis for airflow signal. Matrot et al. 23 used short-time Fourier transform to calculate the spectral power profile of the respiratory signal, which is the same method used by the present authors. However, the second part of the analysis is different from the method used in the present study. Matrot et al. 23 used normalisation of the signal before power spectral analysis and detected apnoea–hypopnoea using a threshold for the spectral power. No normalisation of the signal was used in the present study, but logarithmic transformation was employed for the spectral power. Such different strategy was considered to be relevant to the different setting. Matrot et al. 23 developed the programme to monitor activity and apnoeas of mice for relatively short times, while the present authors developed the programme to monitor breathing events of humans throughout the night. In the present setting, the combination of normalisation and threshold is thought to work incompletely. In a different study by Nakano et al. 24, power spectral analysis was also used to detect SDB from tracheal sound record. However, the purpose of power spectral analysis is different, since in the tracheal sound analysis the power spectral analysis is used to calculate sound power, which is related to airflow velocity, but in the present algorithm the power spectral analysis is used to obtain the magnitude of airflow signal fluctuation corresponding to respiration.
Performance of the algorithm
The flow-RDI obtained by the algorithm has a relatively accurate diagnostic performance despite the fact that it uses only one channel and it uses completely automated analysis.
It is difficult to compare the performance of the algorithm with other algorithms since almost all of them can only be applicable for the monitors originally equipped with them. The performance of the developed algorithm could be compared with that of a conventional automatic analysis programme on the market, demonstrating the superiority of the algorithm. Several previous studies on the diagnostic accuracy of portable monitors have shown that automated scoring of respiratory signals is far less accurate compared with manual scoring 25, 26. By contrast, it was demonstrated that the performance of the algorithm is almost comparable with manual analysis of flow signal alone according to the event-by-event analysis. From these facts, it is believed that the programme developed is superior to many conventional algorithms.
The Bland–Altman plot showed considerable systematic bias between the flow-RDI and the AHI. The bias, which was highly correlated with the AHI, means systematic underestimation of the flow-RDI. The underestimation is considered to be due to two reasons. One is the failure of the algorithm to detect a certain proportion of hypopnoea events, which was demonstrated by the event-by-event analysis and could cause underestimation of 23%. The other reason is that the flow-RDI uses examination time as the denominator while the AHI uses sleep time. Mean sleep efficiency in the validation group (78%) can cause underestimation of 22%. However, this underestimation is considered to be partially counterbalanced by detection of events during waking time. The counterbalance is believed not to be accidental but relevant to SDB, since the awake flow-RDI was correlated with the AHI. The resulting actual effect of underestimation was 26% of AHI. The event-by-event analysis also showed false detection of 200 events·100 h−1. This false detection was not correlated to the AHI and could cause flow-RDI to be overestimated by 2.0 events·h−1. This overestimation explains the positive bias for subjects with low AHI in the AHI versus bias plot.
The AHI-dependent systematic bias between the AHI and the flow-RDI is considered to be an important advantageous feature of the algorithm in two points. One is that such bias can be partially compensated by multiplying the flow-RDI by a specific coefficient. The other is that subjects with relatively low AHI (AHI <20) are less affected by the bias, resulting in less adverse effects for the diagnostic ability. Other reports 11, 13, 25, 26 on validation of automated analysis do not show such an AHI-dependent systematic bias but rather a random and larger bias.
Performance of sensors
The algorithm was originally developed for the analysis of thermal flow sensor signals. It is well known that the change in thermal flow signal is not linear to the change in actual airflow 27 and hypopnoea detection by thermal flow sensor may underestimate SDB.
The thermal sensor used in group 1 utilises a PVDF film, which is reported to have a very fast response to temperature change and an excellent ability to detect hypopnoea when compared with conventional thermal sensors 28. Although the PVDF and thermocouple sensors could not be compared directly, the event-by-event agreement was better for the PVDF sensor in group 1 than for the thermocouple sensor in group 2. Furthermore, it was shown that the nasal pressure sensor was far better than the thermocouple sensor in view of the event-by-event agreement in group 2. These findings agree with the known difference in sensitivity among these sensors.
However, diagnostic ability of the flow-RDI expressed as AUC of ROC was not so different among them. The high AUC means that the flow-RDI at an appropriate cut-off value can have high diagnostic ability. Actually, the appropriate cut-off values were lower for the thermocouple sensor and equivalent or higher for the nasal pressure sensor than those for the PVDF sensor, corresponding to the difference of the sensor characteristics. It is believed that the aforementioned characteristics of the algorithm may make such adjustment capable to improve the diagnostic ability of the low-performance sensor. Another possible way to adjust the sensor sensitivity is to choose an appropriate threshold value to detect the flow-power dip, which was not tested in the current study.
Study limitations
The present study had several limitations. First, the diagnostic ability of a monitor to identify SDB must be dependent on the population studied. In the current study, the subjects belonged to a population with relatively high probability of presenting SDB since they had symptoms suggestive of the condition. Therefore, the present findings may not be applicable to the general population. However, the characteristic of the flow-RDI by which the diagnostic sensitivity was less affected by subjects' body habitus when compared with oximetry analysis is one of its advantageous features, since mean BMI of the general population tends to be lower than that of clinical samples. Secondly, the present study used a flow signal channel from PSG records to validate the algorithm as a simulation of single-channel monitoring. A real validation of the algorithm needs to use the flow signal record in the home. Thirdly, RERAs were not included in SDB events. If these were included, the estimated diagnostic ability may have become worse. Fourthly, although the algorithm is relatively immune to noise contamination, a record which is occupied exclusively by noise may be interpreted as having no events. For practical use, it may not be so difficult to register noise segments as invalid segments based on the power spectral property. However, in the present study such a process was not implemented, since the present authors intended to show the usefulness of flow-power dip analysis. Finally, the single-channel flow analysis has inevitable disadvantages; one is the inability to calculate sleep time as the denominator of AHI and the other is the inability to distinguish obstructive and central events. However, for the purpose of mass screening for SDB, the advantage of simplicity and easy applicability might predominate over such disadvantages.
In conclusion, a new computer algorithm has been developed which can automatically detect sleep-disordered breathing from the airflow record alone. The system needs no manual edit and is relatively accurate. It is believed that not only the performance of sensors but also the analytical algorithm is crucial for the development of simple portable monitors applicable for mass screening for sleep-disordered breathing.
- Received July 11, 2006.
- Accepted December 28, 2006.
- © ERS Journals Ltd