


A prediction rule for clinical diagnosis of severe acute respiratory syndrome
- P. L. Ho 1 ,
- P. H. Chau 2 ,
- P. S. F. Yip 2 ,
- G. C. Ooi 3 ,
- P. L. Khong 3 ,
- J. C. Ho 3 ,
- P. C. Wong 3 ,
- C. Ko 3 ,
- C. Yan 3 and
- K. W. Tsang 3
- 1University Depts of Microbiology, 2Statistics and Actuarial Science, and 3Diagnostic Radiology and Medicine, The University of Hong Kong, Queen Mary Hospital, Hong Kong SAR, China.
- K. W. T. Tsang, Division of Respiratory and Critical Care Medicine, University Dept of Medicine, The University of Hong Kong, Queen Mary Hospital, Pokfulam, Hong Kong SAR, China. Fax: 852 29049443. E-mail: kwttsang@hku.hk
Abstract
A prospective study was undertaken to identify clinical, radiographical, haematological and biochemical profiles of severe acute respiratory syndrome (SARS) patients.
A prediction rule, which demarcates low from high risk patients for SARS in an outbreak situation was developed. A total of 295 patients with unexplained respiratory illnesses, admitted to Queen Mary Hospital, Hong Kong SAR, China, in March to July 2003, were evaluated for clinical, radiological, haematological and alanine transaminase (ALT) data daily for 3 days after hospitalisation.
In total, 44 cases were subsequently confirmed to have SARS by RT-PCR (68.2%) and serology (100%). The scoring system of attributing 11, 10, 3, 3 and 3 points to the presence of independent risk factors, namely: epidemiological link, radiographical deterioration, myalgia, lymphopenia and elevated ALT respectively, generated high and low-risk (total score 11–30 and 0–10, respectively) groups for SARS. The sensitivity and specificity of this prediction rule in positively identifying a SARS patient were 97.7 and 81.3%, respectively. The positive and negative predictive values were 47.8 and 99.5%, respectively.
The prediction rule appears to be helpful in assessing suspected patients with severe acute respiratory syndrome at the bedside, and should be further validated in other severe acute respiratory syndrome cohorts.
- Coronavirus infection
- diagnosis
- pneumonia
- severe acute respiratory syndrome
Severe acute respiratory syndrome (SARS), caused by a novel coronavirus (SARS-CoV), inflicted catastrophe on the economy and immeasurable suffering, particularly among healthcare workers, from February to June 2003. SARS remains a major health threat and this risk is continually aparent, initially by the two single laboratory-acquired cases in Singapore and Taiwan, and more recently by the four community-acquired cases in Guangdong 1. These cases pronounce the need of continued vigilance and vigour in public health measures, and research into the poorly understood pathogenesis, clinical features, radiological appearance and treatment in SARS.
The control of SARS requires early diagnosis and prompt isolation of all suspected cases, as a single index case could result in massive outbreaks 2–5. Diagnostic criteria proposed by the World Health Organization (WHO) and Center of Disease Control and Prevention of USA (CDC) are predominantly epidemiologically orientated, and understandably rely heavily on microbiological testing for the presence of SARS-CoV 6, 7. The latter comprises primarily of serology and RT-PCR to demonstrate the presence of specific anti-SARS-CoV immunoglobulin (Ig) G and viral RNA in blood and respiratory specimens, respectively 6, 8. The use of RT-PCR, despite the initial optimism, does not permit complete confidence at early stages of the disease 5, 9–10, and takes 2–3 days for most microbiology laboratories to complete. Presence of anti-SARS-CoV IgG usually occurs earliest on day 10 of the illness, and serological detection is, therefore, not useful in the initial stages of SARS 5, 11.
The current authors undertook this prospective study, during the 2003 SARS outbreak, to identify clinical, radiographical, haematological and biochemical profiles of SARS patients, and to compare these with those from control patients with non-SARS respiratory illness. The current authors attempted to develop a prediction rule, to demarcate low- from high-risk patients for SARS. They believed this prediction rule should help clinicians in the initial diagnosis and management of potential SARS patients.
METHODS
Patient recruitment and study design
Patients with an unexplained respiratory illness, with fever or history of such in the preceding 48 h (>38°C), namely those with upper (rhinorrhea, blocked nose or sore throat) or lower (cough, sputum production or dyspnoea) respiratory symptoms were admitted to the isolation wards of Queen Mary Hospital, Hong Kong, China, for further evaluation and management during the 2003 SARS outbreak. A final diagnosis of SARS was made when patient had fever (≥38°C), respiratory symptoms, a four-fold increase in anti-SARS-CoV IgG in acute and convalescence serum 5, 11, 12, and/or detection of SARS-CoV RNA 6, 8.
The derivation cohort comprised of 295 patients each with an unexplained respiratory illness admitted to isolation wards in Queen Mary Hospital, between 17th March and 20th July 2003 11. The standard antimicrobial regimen was i.v. cefepime plus oral clarithromycin or i.v. levofloxacin in the presence of penicillin allergy for 10–14 days 2, 11.
Radiographical, haematological, biochemical and microbiological evaluation
A chest radiograph, complete blood counts, alanine transaminase (ALT) and renal function tests were performed daily 13. Chest radiographs were scored according to the per cent of lung involvement in each lung (0 = normal, 1 = 10%, 2 = 20%, 10 = 100% involvement). Summation of scores from both lungs provided the radiographical score for a particular chest radiograph for each patient. A radiographic progress was regarded as improved, unchanged or deteriorated if the radiographical score (within 5%) on day 3 was <, equal to, or > that derived on day 1, respectively 13. Symptoms, travel and contact history were prospectively obtained by infection control nurses with a standardised questionnaire. An epidemiological link was defined as a history of contact with a SARS patient, or visiting a hospital with nosocomial SARS outbreak, in the 10 days preceding disease onset. Microbiological tests comprised blood culture, sputum bacterial culture, and nasopharyngeal aspirate for common respiratory viral antigens (influenza, parainfluenza, respiratory syncytial virus and adenovirus) and viral culture.
Data analysis and predictive rule development
Logistic regression models were applied to identify parameters independently associated with SARS 14. The following parameters were entered for analysis: history of epidemiological link, myalgia and pneumonic symptoms at presentation (presence or otherwise for cough, sputum production, dyspnoea and chills), temperature ≥38°C or history of such in the previous 48 h, upper respiratory tract symptoms (any of rhinorrhoea, blocked nose or sore throat), and gastrointestinal symptoms (any of vomiting, nausea, abdominal pain or diarrhoea). Abnormal laboratory results (presence or otherwise in the first 3 days for thrombocytopenia i.e. platelet count <150×109·L−1), leukocytosis (total leukocyte count >11×109·L−1), lymphopenia (<1.5×10⁹·L−1), and elevation of ALT (>53 U·L−1) were also identified for each patient 2, 11. A radiographic response was also assessed for each patient by comparing radiographs between day 1 and day 3. A stepwise procedure was used in the selection of independently significant predictors adjusted for other predictors (p<0.05).
Based on the fitted model, the fitted probabilities could reflect how likely the case would be a SARS case. The current authors followed the approach described by Fine et al. 15 on assessment of severity of community-acquired pneumonia, to use score in place of probability in the prediction rule model. To generate a simple-integer point score, the fitted regression coefficients of the final logistic model were rescaled by dividing their values by the smallest fitted coefficient and rounded to the nearest integer, which retained the relative size of effects of each of the risk factors. For each binary risk factor, the best condition is defined to be absence of risk factor; for radiographic score, the best condition is defined to have improvement on day 3 when compared with day 1. Zero score will be assigned to patients who were in the best condition of the corresponding risk factor. The sum of these scores, i.e. the total risk score, represented the overall risk of a case being SARS. The cut-off for a positive diagnosis in the prediction rule was determined by the receiver operating characteristic (ROC) curve.
Statistical analysis
Chi-squared, unpaired t-tests or Mann-Whitney U-tests were employed whenever appropriate in the univariate analysis. A p-value of <0.05 was taken as significant.
RESULTS
Patient demography and investigation profiles
A total of 303 patients with unexplained respiratory illness were admitted to the isolation wards during the study period. Of these, eight were excluded as either day 1 or day 3 chest radiographs was missing at the time of analysis. Forty-four patients met the diagnostic criteria for SARS after 2 days (median, interquartile range 1–5), when ribavirin and steroid (methylprednisolone n = 38, hydrocortisone n = 6) were commenced as standard anti-SARS protocol 2, 11.
In the remaining 251 patients (non-SARS group), SARS was finally excluded by RT-PCR and SARS-CoV antibody testing, as described above. Of these, 118 had radiographical evidence of consolidation. Between-group comparison showed no significant difference in age, sex distribution, respiratory symptoms, myalgia, fever, upper respiratory tract or gastrointestinal symptoms between the two non-SARS subgroups, i.e. those with (n = 118) and without radiographical consolidation (n = 133), (p>0.5, data not shown). Although both non-SARS subgroups had a lower frequency of epidemiological link than SARS patients (table 1⇓, 72.7%, p<0.001 for both), those without pneumonia had a higher frequency compared with their counterparts (11.5 versus 2.5%, respectively, p = 0.01).
Clinical features and demography of patients with severe acute respiratory syndrome(SARS) and control patients (univariate)
Microbiological confirmation of SARS-CoV infection was obtained on all 44 SARS patients (RT-PCR in sputum, nasopharyngeal aspirate, stool or urine, 68.2%; and four anti-SARS-CoV IgG, 100%). In the non-SARS pneumonia group, the putative aetiology for the pneumonia was found in 24 (20.3%) patients. The positive sputum microbiology included Mycobacterium tuberculosis (n = 4), Haemophilus influenzae (n = 4), Staphylococcus aureus (n = 2), Klebsiella pneumoniae (n = 1), Escherichia coli (n = 1) and Pseudomonas aeruginosa (n = 1). Four non-SARS pneumonia patients (including three with positive sputum microbiology) had bacteremia, including E. coli (n = 2), K. pneumoniae (n = 1) and S. aureus (n = 1). Evidence of respiratory virus infection was documented in nine other patients with non-SARS pneumonia as follows: influenza A (n = 5), influenza B (n = 1), parainfluenza virus 3 (n = 2) and respiratory syncytial virus (n = 1).
Independent risk factor evaluation
In univariate analysis, seven parameters had positive correlations for SARS: epidemiological link, myalgia, chills, thrombocytopenia, lymphopenia, elevated ALT and chest radiograph progression. Three parameters including cough, sputum production and chest radiograph improvement had negative correlations for SARS. Table 1⇑ shows that SARS patients appear to be more likely to show unchanged versus improvement in radiographical progress than controls (odds ratio (OR) 3.63; 95% confidence interval (CI) 0.47–28.11). Similarly, SARS patients were more likely to have deterioration in radiographical progress than improvement, when compared with controls (OR 28.23, 95% CI 3.64–219.15).
In the logistic regression analysis, only five of the 14 parameters were found to be independent predictors for SARS. These comprised: a positive epidemiological link (coefficient 5.5; OR 235; 95% CI 29.1–1895; p<0.0001), myalgia (coefficient 1.4; OR 4.1; 95% CI 1.4–12.3; p = 0.01), lymphopenia between day 1–3 (coefficient 1.6; OR 4.7; 95% CI 1.2–19.3; p = 0.03), elevated ALT between day 1–3 (coefficient 1.4; OR 3.8; 95% CI 1.3–11.5; p = 0.02), and radiological progression (no change versus improved: coefficient 0.5; OR 1.7; 95% CI 0.11–24.3; p = 0.7, deteriorated versus improved: coefficient 5.1; OR 157; 95% CI 6.2–3978; p = 0.002, deteriorated versus no change: coefficient 4.6 ; OR 94.5; 95% CI 11.3–792; p<0.0001).
Scoring system for high- or low-risk groups for SARS
The final model has an adjusted coefficient of determination of 0.73, which showed reasonably good fit. The following point scores were used to measure the magnitude of the association of each predictor with SARS: epidemiological link, 11 points; myalgia at presentation, 3 points; radiographic deterioration between day 1–3, 10 points and no change, 1 point; lymphopenia between day 1–3, 3 points; and elevated ALT between days 1–3, 3 points. The maximum total risk score is 30, which is most likely to be a SARS case for any given patient.
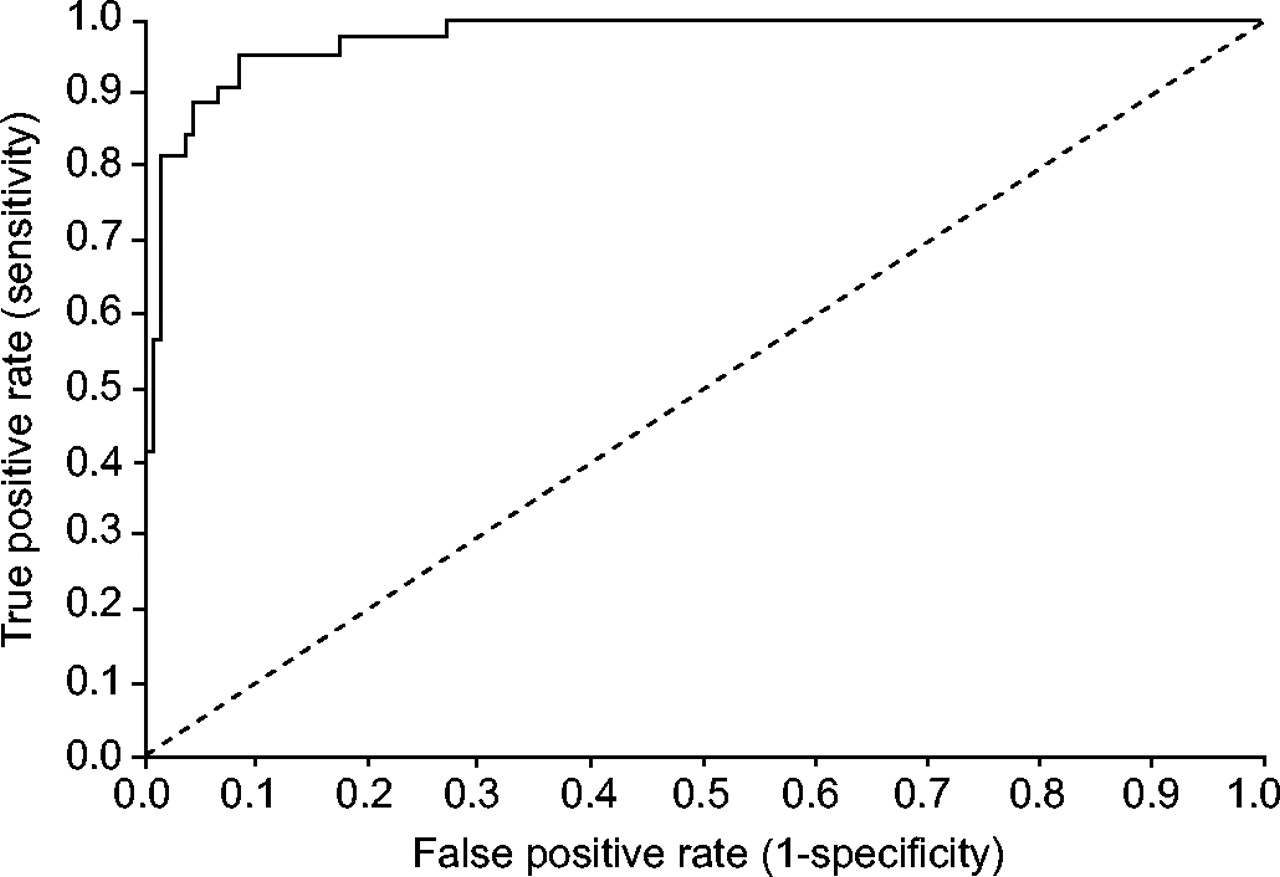
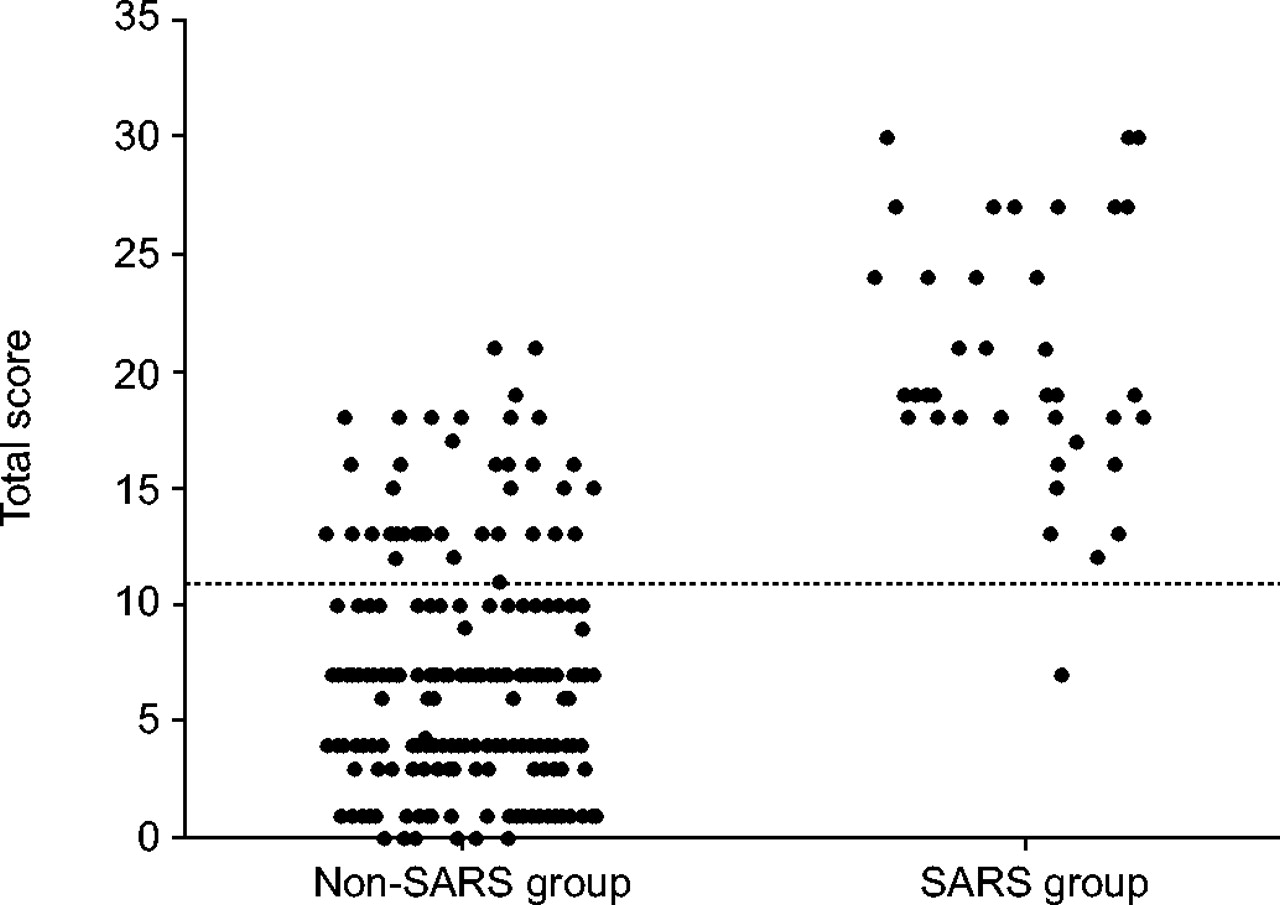
The distribution of the total risk score for patients in the SARS and non-SARS groups have been evaluated by a ROC curve and scatter plot (fig. 1⇓ and 2⇓). This prediction rule classified SARS and non-SARS patients with a ROC curve area (±se) of 0.96±0.011, 95% CI 0.95–0.99. Table 2⇓ shows the risk classification into high (score 11–30) and low (score 0–10) risks for SARS, according to the aforementioned prediction model. The sensitivity and specificity of this scoring system in positively identifying a SARS patient are 97.7 and 81.3%, respectively. The positive and negative predictive values are 47.8 and 99.5%, respectively. This model therefore appears to have a very strong power for a negative prediction.

Receiver operating characteristic (ROC) plot of the total risk scores for the bedside prediction of severe acute respiratory syndrome. Area under the ROC curve (±se): 0.96±0.011; 95% confidence interval 0.95–0.99. ═: line of no discrimination.

Evaluation of the sensitivity and specificity of a prediction rule for the clinical diagnosis of severe acute respiratory syndrome (SARS). Each patient was assigned a total risk score according to the number of independent predictors present. The cut-off line for positive diagnosis was established by the receiver operating characteristic curve.
Risk classification for severe acute respiratory syndrome(SARS) according to the bedside prediction model
DISCUSSION
In the cohort of 295 adult patients initially admitted to isolation wards at Queen Mary Hospital with unexplained respiratory illness 8, 16, those subsequently diagnosed to have SARS differed from their counterparts in displaying a positive epidemiological link, myalgia, lymphopenia, elevated ALT, and radiological deterioration versus improvement. The epidemiological link, defined as a history of contact with a SARS patient, or visiting a hospital with nosocomial SARS outbreak, in the 10 days preceding disease onset, is more specific than that proposed by WHO 16. A component of the latter defined such link as “residing in an area with recent local transmission of SARS” 16, which would have classified the Hong Kong population as having a positive link, and thus was effectively useless for the current authors' practice during the 2003 outbreak. Therefore, the presence of an epidemiological link (11 points) is highly predictive of SARS even in the absence of all the other factors. Conversely, in the absence of an epidemiological link and without the benefit of radiograph observation over the next 2–3 days, the highest possible score on day 1 is 9 points (generated by the presence of myalgia (3 points), lymphopenia (3 points) and elevated ALT (3 points)), and thus inadequate to category a patient into high risk group. Nonetheless, even in the absence of an epidemiological link, the presence of radiographic deterioration and any one of the aforementioned predicting factors could readily classify a patient as high risk for SARS on day 3. The strength of the prediction model includes the availability of a stringently recruited control group, which is one of the largest 17, 18. In addition, most of the SARS patients in the current study were not healthcare workers, as there was a very low staff infection rate (namely two cases altogether who were not recruited), and thus diagnostically more challenging. The prediction rule of the current authors had a high negative predictive value but a low positive one, and thus has such limitation in identifying SARS patients. Nonetheless, it is a useful aid to exclude SARS as a diagnosis in the presence of an unexplained respiratory illness during an outbreak, for clinical management as well as implementation of isolation policy for protection of staff, other patients and the community at large.
The recent four cases in Guangdong, China have vividly shown the difficulties in diagnosing SARS, especially for sporadic cases in a non-outbreak situation 1. Since March 2003, the WHO and CDC diagnostic criteria have been revised several times, probably due to their low sensitivity (17–36%) 8, 16, 17, 19. The most updated versions of these diagnostic criteria, requires the presence of clinical symptoms, epidemiological contacts and laboratory evidence of SARS-CoV infection 6, 7. The criteria on evaluation of symptoms and radiographic appearances are actually unhelpful at the bedside. Although there is a wide spectrum of radiological pattern in SARS, including the presence of ground glass opacities, frank consolidation and nodular patterns 11, 20, 21, the current authors have previously shown, albeit qualitatively, that rapid progression is the most characteristic for SARS 2, 5, 11. Without a gold diagnostic standard, it had been impossible to determine the usefulness of RT-PCR and serological testing for SARS-CoV. Nasopharyngeal aspirate and stool samples could be used for early diagnosis of SARS by detection of genomic RNA using real-time quantitative RT-PCR assay for SARS CoV, although the sensitivity is at most 80% 9. RT-PCR systems to detect blood or serum SARS-CoV RNA provide a sensitivity of 50–87% during the first week of illness, but drop to 25% at day 14 after fever onset 10. Bedside diagnosis of SARS, therefore, remains a key process in the management of a patient suspected to have SARS.
Two scoring systems, designed to demarcate severe acute respiratory syndrome from other patients, have been developed. Data derived from 232 patients were used to derive a scoring system whereby attribution of 3, 3, 2, 1, 1, 1 and 1 points was made to the presence of multilobar radiographic infiltrates, sputum monocyte predominance, lymphopenia, epidemiological linkage, high lactate dehydrogenase, high C-reactive protein, and prolonged activated partial prothrombin time, respectively. At a cut-off of 6 points, the sensitivity and specificity in diagnosing severe acute respiratory syndrome were reported as 100 and 93% 17. Another system, derived from data on eight probable severe acute respiratory syndrome cases out of 70 patients presenting to an emergency department, showed a 6-item scoring system based on the presence of cough, myalgia, diarrhoea, rhinorrhoea or sore throat, lymphopenia, thrombocytopenia. This was reported to detect severe acute respiratory syndrome with 100% sensitivity and 86.3% specificity 18. While these systems appear to be simple and user-friendly, they unfortunately lack control data to support their validity. In addition, these authors have not stringently defined the selection criteria thus restricting the extrapolation of their findings to other centres. While the current study has a control group, it suffers from a small sample size and a lack of validation as it is only derived from one centre and thus could be potentially biased and not applicable to other populations. The effects of variation in the prevalence during the outbreak, which could have affected the predictive values of the model, were not evaluated. These effects could potentially affect the clinical application of the model and should therefore be addressed in future studies. The validity of the current authors' prediction model should also be evaluated in other cohorts, including those in Hong Kong, mainland China, Singapore, Toronto and Taiwan. It is also important to test its validity in the form of sensitivity and specificity should severe acute respiratory syndrome recur.
Acknowledgments
The authors would like to thank A. Wong, W. Wong, and P. Lee for their invaluable assistance in collecting data prospectively directly from the severe acute respiratory syndrome patients at Queen Mary Hospital, Hong Kong SAR, China.
- Received June 25, 2004.
- Accepted June 2, 2005.
- © ERS Journals Ltd