


Time domain and flow indices of bronchial hyperresponsiveness: association with asthma symptoms, atopy and smoking
- 1Dept of Medicine, University of Birmingham, UK. 2Dept of Environmental and Occupational Medicine, University of Aarhus and 3Dept of Occupational Medicine, Aalborg Regional Hospital, Denmark
- M.R. Miller, Dept of Medicine, Selly Oak Hospital, Birmingham, B29 6JD, UK. Fax: 44 1216278292. E‐mail: martin.miller@uhb.nhs.uk
Abstract
Conventional measures of bronchial hyperresponsiveness (BHR) are only weakly associated with respiratory symptoms in epidemiological studies. Partial and maximal forced expiratory manoeuvres were recorded during histamine challenge testing in 1,959 young male farmers. Analysis was performed to test whether novel measures of BHR, using alternative flow and time domain indices, are more closely associated with asthma symptoms, smoking status and atopy than forced expiratory volume in one second (FEV1) and conventional measures of BHR.
The first moments to 75% and 90% of the forced vital capacity (FVC) were calculated from full (F) and partial (P) forced expiratory manoeuvres (i.e. α175%F, α175%P), together with the instantaneous flows when 40% and 30% of the FVC remained to be expired (MEF40 and MEF30). BHR was measured by the provocative dose causing a 20% change (PD20) in the FEV1 and α175%, and also by the method of log dose slopes (LDS).
Asthma was diagnosed from symptoms associated with asthma in 158 (8.1%) of the subjects. PD20 FEV1 could only be recorded in 190 subjects (9.7%), of whom only 48 had asthma, whereas LDSFEV1 was recorded in 1,725 (88%) subjects. From the prechallenge data, α175%, expressed as standardised residuals, showed the largest difference between smokers with and without asthma symptoms, and no indices showed significant differences between nonsmokers with and without asthma symptoms. From BHR data in both smokers and nonsmokers, LDSFEV1 showed one of the largest differences between those with and without asthma symptoms. With smoking status and atopy accounted for, the greatest partial correlation with asthma diagnosis was found for LDSMEF40P, and then for LDSFEV1, but LDSMEF40P was measurable in only just over one-half of the subjects.
The authors conclude that time-domain indices are promising measures for longitudinal epidemiological studies concerning the relationship between bronchial hyperresonsiveness and environmental exposures. However, indices from the partial flow-volume loop suffer from censored data.
- bronchial hyperresponsiveness
- lung function
This study was supported by, the Danish Medical Research Council and the Danish Agricultural Research Council.
Bronchial hyperresponsiveness (BHR) is used in epidemiological studies as a measure of asthma or symptoms associated with asthma. The total provocative dose required to cause a 20% fall in the forced expiratory volume in one second (FEV1) (PD20) when compared to the postsaline value is a common descriptor of BHR 1. However, only ∼10–15% of a normal population have a PD20 that can be measured. The use of log dose slopes (LDS) has been proposed to avoid problems of censored data 2, 3. The assumption that a given percentage change in FEV1 due to a bronchoconstricting agent is equivalent for subjects with a large FEV1 (for example a tall young male) and those with a smaller FEV1 (for example a short, older female) for PD20 and LDS was implicit. The authors have studied the use of time-domain indices from the forced expiratory manoeuvre 4, 5 to assess BHR as these indices are better standardised for size and sex than FEV1. Also studied were indices from the partial flow-volume loop, where intrinsic bronchial tone has not been removed by deep inspiration 6, to see if this is a better estimate of BHR at a lower provocation dose 7.
Methods
The data from the Sund Stald (SUS) study 8, which investigated the effect of farming on bronchial responsiveness was analysed. Full data were available on 1,959 male students prior to starting their training in farming. The data for the few female farming students were excluded since their number was too low to allow sex effects to be taken into consideration in the analysis.
Each subject answered a modified Medical Research Council (MRC) questionnaire on respiratory symptoms with additional questions on allergy, asthma, family history of allergy, smoking and occupational history. Asthma was diagnosed 8 if subjects answered positively to at least one of four Group A questions (has a doctor told you have asthma? do you have asthma? have you ever had asthma? do you ever wheeze?) and to at least two of eight Group B questions (do you ever have chest tightness? do you wake in the morning with a tight chest? do you cough on waking in the morning? do you wake with a cough? do you wheeze when exposed to cold air? do you wheeze with exercise? do you wheeze when exposed to pollen? do you use asthma drugs?). Atopy was defined from skin-prick tests 8 and BHR to histamine was measured using the method described by Yan et al. 9. Partial and full flow-volume loops were recorded as a continuous manoeuvre, starting with the partial expiration from just above functional residual capacity. The blow was recorded with a pneumotachograph (PT) whose thermal stability was obtained by resting the PT on a fan in between blows 10. The following were calculated: forced vital capacity (FVC), FEV1, peak expiratory flow (PEF), and the instantaneous flows at the lung volume where 40% and 30% of the largest prechallenge FVC was still to be expired (MEF40, MEF30) with the suffix F denoting indices from the full blow and P for those from the partial blow. Indices with suitable prediction equations 5, 11 were expressed as standardised residuals (SR) (e.g. FVCSR) to express deviation from predicted values:  where RSD is the residual standard deviation from the regression equation used.
Time-domain analysis on both the F‐ and P‐expiratory blows was undertaken with data being timed from a new start time zero defined by back extrapolation 12. The first moments were standardised by truncation with respect to volume at 75% and 90% of the expired volume (α175% and α190%) from both the full and the partial loop, since this reduces signal noise 4. MEF40P data were accepted if the start of the partial blow was >20% below the total lung capacity (TLC) and >50% above the residual volume (RV), and α175%P, α190%P and MEF30P were accepted if the start was >40% above RV. LDS 2 were calculated from the postsaline value and the last dose value as:  which for FEV1 was denoted as LDSFEV1. For subjects with a >20% fall in FEV1 and α175% the PD20 was calculated by interpolation.
Statistics
Nonparametric comparisons between groups of subjects were made since some indices had unequal variances and non-normal distributions. Partial correlation coefficients were calculated to explore relationships between symptoms and indices of lung function and bronchial responsiveness. A level of 5% for indicating significant differences, when testing null hypotheses, and where N multiple comparisons were made a level of 5/N was used (Bonferroni correction).
Results
The questions with the most positive responses were: “Have you ever had asthma?” in 7%, “Do you ever wheeze?” in 8%, “Do you ever have chest tightness?” in 18% and “Do you cough on waking in the morning?” in 6%. Asthma was diagnosed in 8.1% (158) of the 1,959 subjects by the criteria of at least one Group A and two Group B questions answered positively. Of these 158 there were 78 smokers and 80 nonsmokers, with the expected numbers being 54 and 104 respectively (Chi-squared=18.1, p<0.001). PD20 was only recorded in 190 subjects (9.7%), of whom only 48 had asthma. PD20 values for FEV1 and α175% were obtained in only 30% and 34% of those diagnosed with asthma, and in 8% and 17% of nonasthmatics, whereas LDSFEV1 was recorded in 1,725 (88%) subjects and 150 (95%) of the asthmatics. Of the asthmatics, 2.5% had high reactivity (PD20 ≤0.045 mmol histamine) and 11% medium reactivity (0.045 mmol ≤PD20 ≤0.358 mmol histamine).
Only 125 subjects (6%) had at least one weal greater than the histamine control and were deemed atopic. Atopy was present in 23% of the asthmatics compared to the expected 8% (Chi-squared =50.7, p<0.001). The partial correlation coefficients for asthma symptoms with atopy (r=0.10) and with smoking status (r=0.10) were significantly different from zero (p<0.0001) when controlling for the other attribute.
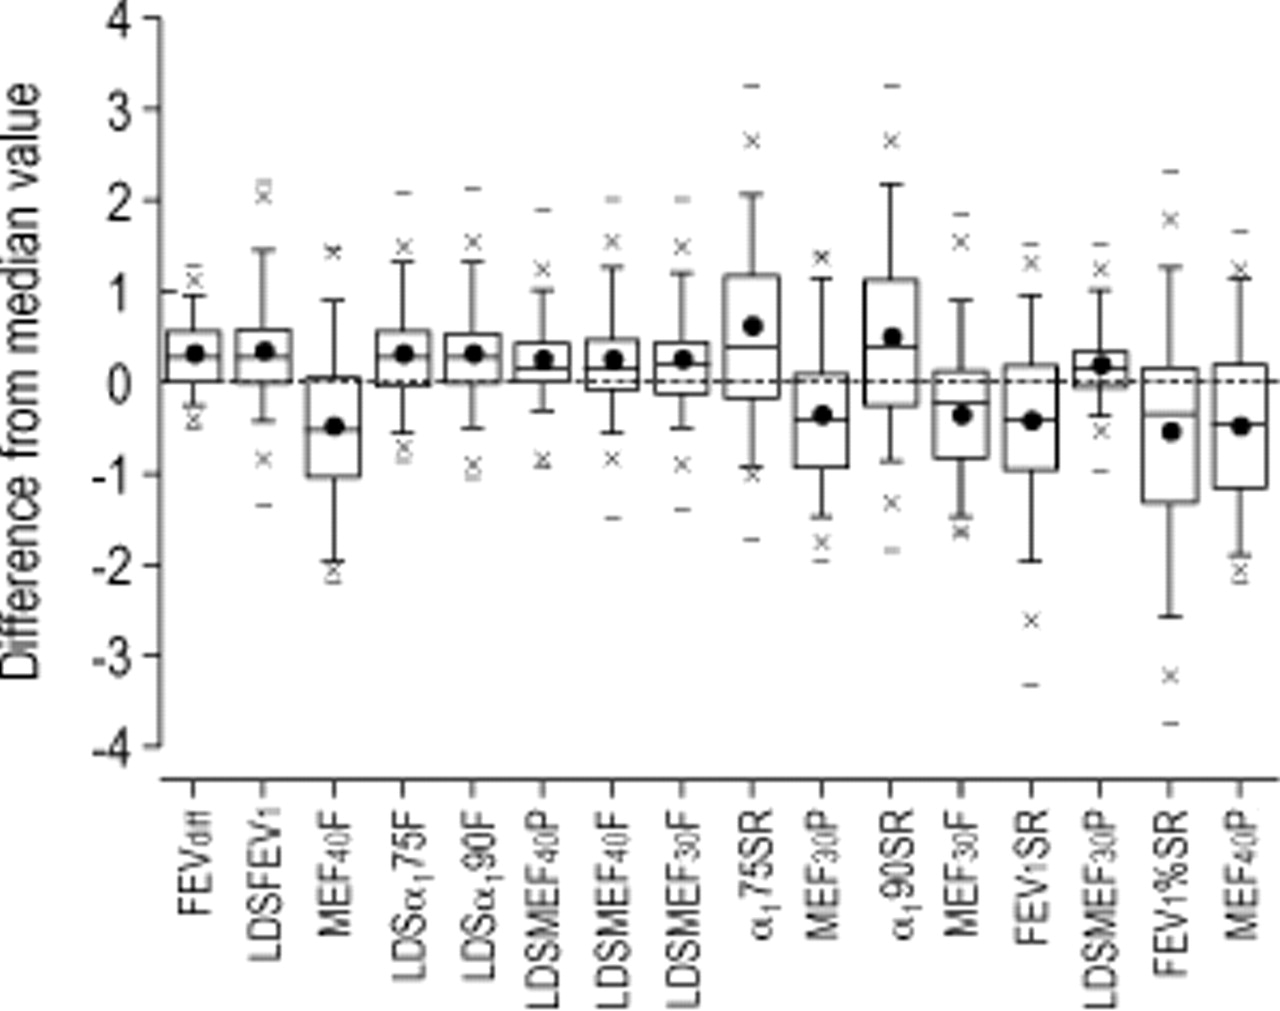
The mean and range of values for all the indices are shown in table 1⇓. The percentage of subjects with censored data for indices of BHR ranged from 90% for PD20 and 80% for PD20 α175%, to 10% for LDSFEV1. Figure 1⇓ shows the box-plot data for indices that demonstrated a significant difference between the values for the asthmatic nonsmokers from the median value of the nonasthmatic nonsmokers. The indices are ranked with the most significant on the left. For the nonsmokers the LDSFEV1 was the index that was most significantly different between those with asthma symptoms and those without, and none of the prechallenge indices were significantly different. The absolute drop in FEV1 after histamine (FEVdiff) was almost as good as LDSFEV1 in this respect. Figure 2⇓ shows the box-plot data for indices that demonstrated a significant difference between the values for asthmatic smokers from the median value of the nonasthmatic smokers. Again FEVdiff was as good as LDSFEV1 in distinguishing asthmatics from nonasthmatics in smokers but α175%SR was the first size standardised index from the prechallenge data to show a significant difference.

Box plot for 80 nonsmoking asthmatic males showing differences from the median value for the 1,213 nonasthmatic nonsmoking males for the indices with significant differences, ranked with the index with the most significant difference on the left (Mann- Whitney U‐test with correction for multiple comparisons, p<0.001). –: maximum and minimum values; x: the 1st and 99th percentiles; whiskers on the box: 5th and 95th percentiles; horizontal line in the box: median; •: mean value. FEVdiff: absolute drop in forced expiratory volume in one second (FEV1) after histamine; LDS: log dose slope; MEF40: instantaneous flow when 40% of the forced vital capacity (FVC) remained to be expired; MEF30: instantaneous flow when 30% of the FVC remained to be expired SR: standardised residual; F: full forced expiratory manoeuvres; P: partial forced expiratory manoeuvres; α175: the first moment of the spirogram truncated at 75% of FVC; α190: the first moment of the spirogram truncated at 90% of FVC.
Box-plot for 78 smoking asthmatic males showing differences from the median value for the 588 nonasthmatic smoking males for the indices with significant differences, ranked with the index with the most significant difference on the left (Mann-Whitney U‐test with correction for multiple comparisons, p<0.001). –: maximum and minimum values; x: the 1st and 99th percentiles; whiskers on the box: 5th and 95th percentiles; horizontal line in the box: median; •: mean value. FEVdiff: absolute drop in forced expiratory volume in one second (FEV1) after histamine; LDS: log dose slope; MEF40: instantaneous flows when 40% of the forced vital capacity (FVC) remained to be expired; F: full forced expiratory manoeuvres; P: partial forced expiratory manoeuvres; α175: the first moment of the spirogram truncated at 75% of FVC; α190: the first moment of the spirogram truncated at 90% of FVC.
The median (1st quartile, 3rd quartile) values for the indices
Partial correlation coefficients for the association between an index and the diagnosis of asthma from symptoms, having controlled for smoking status and atopy, are shown in table 2⇓. The relationship with diagnosis of asthma from symptoms was the best for LDSMEF40P, and then LDSFEV1, which correlated better with asthma than the FEV1diff on its own. Of the prechallenge indices α190%SR and α175%SR were better related to symptom diagnosis than FEV1SR. The most prevalent single symptom in the subjects was that of “ever having a tight chest” and for this symptom LDSMEF30F was best related. Table 3⇓ shows the bivariate Spearman correlation coefficients between various indices. Unlike LDSFEV1, LDSα175%F was not significantly correlated with the start value of the index, and of the indices from the full loop was least correlated with LDSFEV1.
Partial correlation coefficients significantly different from zero for the association between indices of lung function and the diagnosis of asthma, having controlled for smoking status and atopy
Matrix of bivariate Spearman correlation coefficients between selected indices
Discussion
Data from a large population survey, using both conventional and novel indices of BHR from both partial and maximal expiratory flow volume (PEFV MEFV) curves, have been presented here and have confirmed that LDSFEV1 is the key index of lung function that relates to asthma symptoms. In smokers the prechallenge indices of α175%SR and MEF40, of which the latter retains size bias, were also significantly related to asthma symptoms and this was not found in nonsmokers.
For these findings to be relevant to other populations various aspects of the analysis need to be considered. Censored data for the indices of hyperresponsiveness in this study may occur for several reasons. When calculating LDS a log transformation cannot be obtained if the postchallenge result moves in the direction opposite to that expected, and is of such a degree that the percentage change divided by dose is <−1 (see Methods). PD20 was a poor index in the present study, as in other studies 13, because so few subjects in a random population have a 20% drop in FEV1 after histamine challenge. The number of censored subjects in LDS values for the subjects was small for FEV1 and α175%. LDS data have the merit of being readily calculated from routine challenge data and are statistically suited for detecting relationships with symptoms 3. If a subject was not able to start the P blow between 20–50% of FVC their PEFV data and MEF40 were rejected. If the start was <40% of FVC the MEF30 data were rejected. Despite training the subjects the authors were not able to get a correct start position for all of them and so there were fewer data for MEF40P and MEF30P and their LDS. These censored data diminish the possible value of these indices as a longitudinal study requires data on subjects to determine the predictive value of the index with respect to asthma management or future development of asthma. The valid data for these indices were not better than conventional indices. So for these reasons PEFV data do not appear helpful in studies of the epidemiology of asthma. Other workers have recorded PEFV data in a high proportion of young subjects 14 but this and one other study 15 found conventional indices were still superior.
The LDSFEV1 was negatively correlated with the prechallenge start value for this index, and this was also true for LDSMEF30 and LDSMEF40. However LDS for the time-domain indices showed no significant correlation with their start values. Whilst the LDS indices from the full loop all correlated with one another, the LDSα175%F showed the weakest correlation with LDSFEV1 at 0.55, suggesting there was different information within this index.
There is no gold standard for diagnosing asthma but one study of >9,000 subjects found that the symptoms of wheeze plus two nocturnal symptoms gave the highest specificity (86%) and sensitivity (80%) for diagnosing asthma 16. Within-day PEF variability improves the sensitivity of the diagnosis of asthma 17 but LDS data are most often used to explore causation and risk factors for asthma rather than facilitate the diagnosis of asthma in individual subjects. The present definition of asthma has been made from symptoms without reference to lung function data. This has the advantage of there being no prior relationship with lung function when looking for indices that might predict who develops asthma in a longitudinal study. However, the symptom profile chosen did not include questions concerning symptom variability and so may not have been optimal. The authors believe their panel of questions will detect asthma but may possibly include subjects with smoking-related symptoms and not asthma. Asthma was diagnosed in 8.1% of the subjects which was within the range of 0.7–15% found in rural populations 18, 19, arguing that the data have not been unduly diluted with false positives. Furthermore, the smokers were all young with low exposure and no dose-related smoking effect on their lung function 8. Thus, the authors believe their symptom diagnosis of asthma was suitable for the analysis.
From the prechallenge data α175% expressed as SR showed the greatest difference between smokers with symptoms and those without symptoms having taken age and size into consideration. It has been observed previously, in a study of >1,000 subjects with a wider age distribution than that presented here, that α175% was more sensitive than FEV1 at detecting early change in function from cigarette smoking 20. Whilst absolute MEF40 showed even larger differences between smokers and nonsmokers, this index is not standardised for age, size, or FVC, so it is less satisfactory for use in population surveys.
It is concluded that for epidemiological studies using prechallenge data the time-domain indices are those best related to symptoms associated with smoking.
- Received January 29, 2001.
- Accepted January 23, 2002.
- © ERS Journals Ltd