


Increased frequency dependence of specific airway resistance in patients with laryngeal hemiplegia
- V. Fasano 1 ,
- L. Raiteri 1 ,
- E. Bucchioni 1 ,
- S. Guerra 1 ,
- G. Cantarella 2 ,
- M.G. Massari 2 ,
- B.M. Cesana 3 and
- L. Allegra 1
- 1Institute of Respiratory Diseases, 2Ear, Nose and Throat Institute and 3Epidemiology Unit, University of Milan, Ospedale Maggiore of Milan, IRCCS, Italy
- V. Fasano, Institute of Respiratory Diseases, Pad. Litta Ospedale Maggiore of Milan IRCCS Via F. Sforza, 35 20122, Milano, Italy. Fax: 39 0255190332
Abstract
The aim of this study was to investigate whether patients with laryngeal hemiplegia (LH) show a frequency-dependent increase in specific airway resistance (sRaw), measured by body plethysmography.
In addition to the flow-volume loop, usually considered in the functional evaluation of upper airway obstructions, variations in sRaw at respiratory frequencies of 30±5 (=0.5 Hz), 60±5 (=1 Hz) and 90±5 breaths·min−1 (=1.5 Hz) in 21 never-smoking patients (LH group, mean age±sd 55±12.09 yrs; 17 females) whose unilateral vocal-cord paralysis was documented by laryngoscopy and who had no signs or symptoms of other respiratory diseases studied. They were compared to 21 healthy control subjects (C group: 50.1±15.44 yrs; 10 females).
The sRaw values at 30±5 breaths·min−1 were similar in the two groups (5.54±1.88 versus 5.68±1.06 cmH2O·s−1; p=ns), but at increasing frequencies (30±5, 60±5 and 90±5 breaths·min−1), they progressively and significantly increased in the LH patients (from 5.54±1.88 to 6.63±1.96 and 8.05±2.6 cmH2O·s−1; p<0.0005), and not significantly in controls (5.68±1.06, 5.85±0.95 and 5.9±1.12 cmH2O·s; p=ns). Linear discriminant analysis using ΔsRaw (sRaw at 1.5 Hz-sRaw at 0.5 Hz) and forced inspiratory flow at 50% of the vital capacity made it possible to correctly classify all of the controls and 19 of the 21 patients.
In conclusion, the multiple, rapid and noninvasive plethysmographical testing of frequency-dependent increase in specific airway resistance with the flow-volume loop, allows the sufficiently satisfactory discrimination of laryngeal hemiplegia patients from controls.
- Body plethysmography
- forced inspiratory flow at 50% of the vital capacity
- inspiratory flow
- laryngeal hemiplegia
- specific airway resistance
The upper airway is the primary conduit for the movement of gases essential for life. Fine neural control, synchronized with diaphragmatic and other respiratory muscle contractions facilitates the continuous exchange of air necessary for cellular respiration. Any condition altering this fine relationship, such as lesions of the peripheral nerves, muscles or mucosa of the upper airway, can cause laryngeal dysfunction. The diagnosis of laryngeal dysfunction can be made by means of direct visualization, pulmonary function tests, electromyography, and various radiological techniques 1.
An obstructive lesion of the upper airway from the carina to the epiglottis can produce changes in pressure on the airway wall and limit airflow. One of the most widely used pulmonary function tests for evaluating airflow limitation is the flow-volume loop (V'/V), with an analysis of forced inspiratory and expiratory flows, the configuration of which can categorize airway obstruction into one of three types: 1) variable extrathoracic obstruction; 2) variable intrathoracie obstruction and 3) fixed obstruction. The parameters used to evaluate these three kinds of obstruction are forced inspiratory flow at 50% of the vital capacity (FIF50%), forced expiratory flow at 50% of the vital capacity (FEF50%) and the FEF50%/FIF50% ratio 2.
A fixed lesion limits airflow during both inspiration and expiration. When it makes the airway more compliant, the obstruction is variable; variable intrathoracic lesions mainly limit expiratory flow and variable extrathoracic lesions affect inspiration.
The incidence of obstructing lesions of the laryngotracheal airway is increasing and the use of cuffed endotracheal tubes for controlled ventilation, prolonged tracheal intubation, physical or chemical trauma to the major airways, and neoplasias all seem to be more common. Vocal-cord paralysis continues to be a significant problem, as a postoperative complication (the most common source is after thyroidectomy, as in the present patients) or due to other causes (neurological, vascular, functional, etc).
Airway resistance (Raw), which accounts for ∼85% of total lung resistance (Rtl) 3, is another sensitive measure of middle-proximal obstruction. The upper airway contributes 40–70% of Rtl to airflow during breathing at rest 4, 5, whereas the small airways of <2 mm in diameter are low-resistance pathways that normally contribute ∼20% of total flow resistance 6, 7.
Raw measurements were first described by DuBois et al. 8 and, when coupled with body plethysmography, facilitate multiple, rapid and non-invasive measurements over a range of lung volumes. The plethysmographic technique has two variants: panting and quiet breathing, which differ in terms of the instructions given to the patient and the contribution of oropharyngeal resistance to Raw. In particular, panting tends to fix the position of the vocal cords and glottis in such a way as to maximize the opening of the upper airway leading, in some normal subjects, to decreased resistance at higher respiratory rates 8, 9.
Patients with unilateral vocal-cord paralysis usually have a reduced FIF50%, a FEF50%/FIF50% ratio >l, and normal upper airway resistance during resting ventilation 10.
The aim of this study was to investigate whether these patients show a frequency-dependent increase in specific airway resistance (sRaw), measured using the plethysmographical technique.
The working hypothesis was that a flaccid vocal cord may cause a turbulent flow, through the orifice, with the likelihood of it becoming more evident and increasing respiratory frequency.
Material and methods
Subjects
The study involved 21 never-smoking patients (laryngeal hemiptegia (LH) group, mean age±sd 55±12.09 yrs; 17 females) with unilateral vocal-cord paralysis and no other respiratory disease indicated by history, signs, symptoms or functional tests forced expiratory volume in one second (FEV1) and forced vital capacity (FVC) >80% of the predicted values).
The vocal-cord paralysis was secondary to thyroidectomy in all cases, and the diagnosis was established by laryngoscopy. The control group (C group) consisted of 21 normal subjects (mean age±sd: 50.1±15.44 yrs; 10 females) with no respiratory diseases and with normal respiratory function (FEV1 and FVC >80%).
The functional characteristics and sRaw values (at 0.5, 1.0 and 1.5 Hz) of the two groups are summarized in table 1⇓.
Group characteristics
Methods
After being informed about the test, the subjects were seated with their noses clipped in an upright position in the open plethysmograph, to which they were connected by means of an incompressible cylindrical mouthpiece (diameter 27 mm). At the beginning of the study, slow vital capacity and forced expiratory and inspiratory flow were measured using a Fleisch no.3 heated pneumotachograph volume calibrated with an 11 syringe. Subsequently, plethysmography was carried out using a constant volume (850 L) whole body plethysmograph (Werner Gut, Basel, Switzerland) with electronic body, temperature and pressure, saturated with water vapour (BTPS) compensation and mechanical time constant always close to 10 s.
The box pressure (Pbox) was calibrated daily, in terms of volume (Vbox), using a reciprocating manual pump with a stroke volume of 1 L at a frequency ranging from ∼0.5–2 Hz. The results were processed using the software system. The X-Y plots of the signals were displayed on a storage oscilloscope and printed on standard paper with the following amplification: V'/V loop: flow: 1 L·s−1 per 6 mm (deflection); volume: 1 L per 12 mm; ITGV loop: Vbox: 10 mL per 2.65 mm; mouth pressure (Pmouth): 10 cmH2O per 12 mm. Raw loop: Vbox: 10 mL per 2.65 mm; flow: 1 L·s−1 per 12 mm.
With the plethysmograph closed after a period of 1 min to reach thermal equilibrium, resistance measurements were made in a random order at the three different frequencies of 30±5 (=0.5 Hz), 60±5 (=1 Hz) and 90±5 breaths·min−1 (=1.5 Hz), each measurement lasted nearly 30 s; the number of breaths per minute was recorded simultaneously, using a metronome to help the subjects achieve the required respiratory rate. The door of the plethysmograph was opened for 2 min after each measurement in order to prevent a progressive increase in box temperature. At increasing respiratory frequencies, sRaw were measured at progressive low tidal volumes, so that the maximum variation of inspiratory and expiratory flow at each frequency remained ∼2 L·s−1. Observers monitored the manoeuvres on the oscilloscope screen, in order to ensure that six satisfactory Vbox/V'loops (“Raw” loops) were obtained and stored; at this point, each subject was instructed to support his cheeks and chin firmly with both hands. Breathing was continually monitored by the operator in order to establish a stable baseline representing functional residual capacity (FRC); the airway was occluded by closing the shutter to measure intrathoracic gas volume (ITGV).
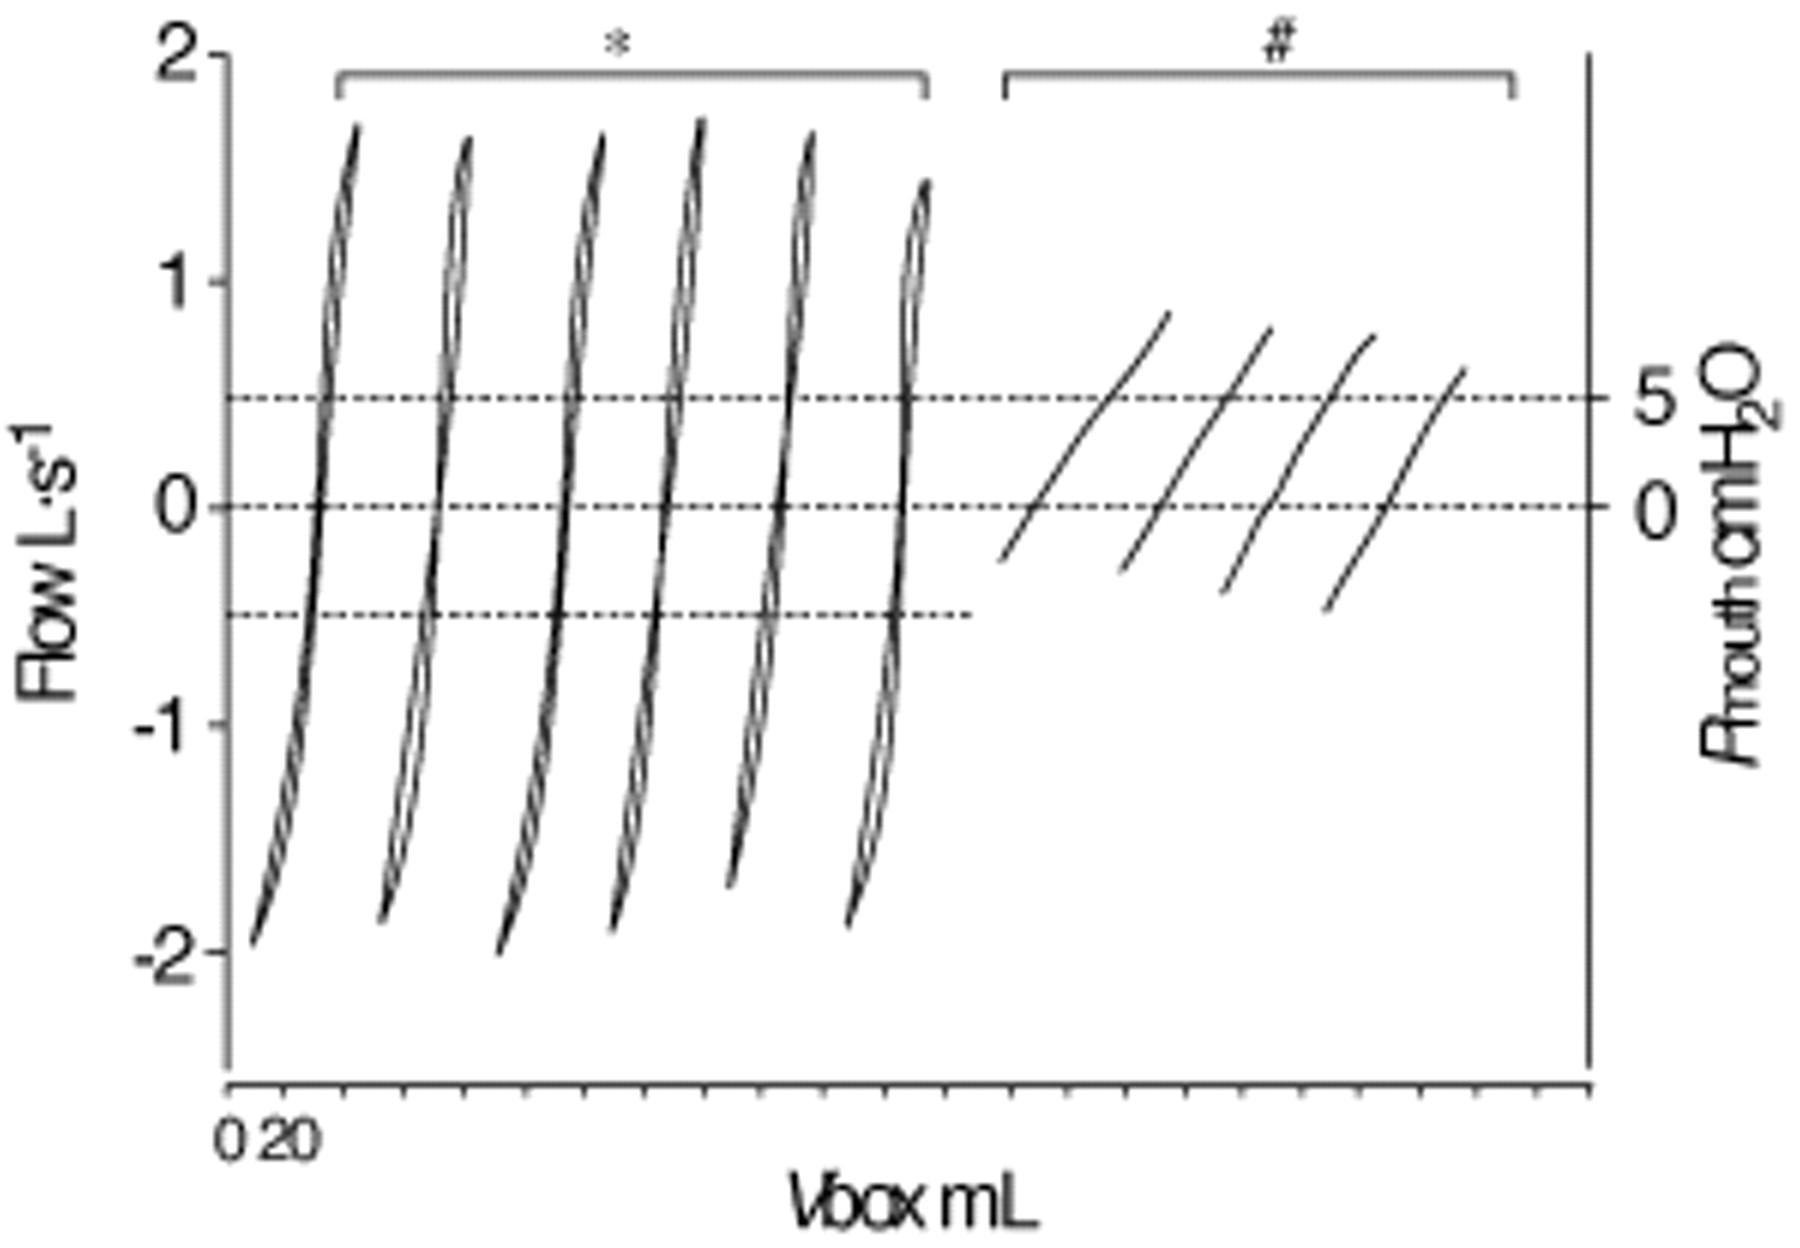
Subsequently, the results were taken from the “best” Vbox/V'loop appearing on the computer monitor in the range of ±0.5 L·s−1: the loop that was closest to the mean, smoothest, cleanest and artifact free. The same criteria were applied to ITGV. Actual acceptable traces recorded for both loops (“Raw” and ITGV) are shown in figure 1⇓. In order to avoid possible variations in Raw due to changes in ITGV, the sRaw value was always considered, because this only depends on the Pbox/V' ratio regardless of the value of alveolar pressure versus Pbox. Each sRaw measurement was calculated by the software using the following two-step procedure:

An actual plethysmographical recording of one subject at a respiratory frequency of 32 breaths·min−1. *: the six specific airway resistance (“Raw”) loops obtained by plotting plethysmographical volume changes (ΔVbox) against variations of inspiratory and expiratory flow; #: four intrathoracic gas volume (ITGV) loops obtained by plotting plethysmographical volume changes (ΔVbox) against variations in mouth pressure (ΔPmouth). Corresponding Raw values: 1.89; 1.78; 1.96; 1.84; 1.78; 1.76. Corresponding ITGV values: 3.88; 3.76; 3.84; 3.72.
Step 1: 
 In step 2, sRaw was obtained as: Raw×ITGV, particularly:
  Hence:
Statistical analysis
All of the data are expressed as mean values±sd. The predicted values proposed by the European Respiratory Society guidelines were used for all of the forced expiratory parameters 11, and those proposed by Bass 12 were used for FIF50%.
The mean respiratory parameters of the patients and control groups were compared using a t-test or Wilcoxon's rank-sum test for unpaired data.
The relationships between the changes in sRaw (1.5–0.5 Hz) and ITGV values at increasing respiratory frequencies were investigated by means of Spearman's rank-correlation coefficient.
In order to discriminate between the controls and laryngeal hemiptegia (LH) patients, FIF50% and sRaw changes (ΔsRaw=sRaw at 1.5 Hz-sRaw at 0.5 Hz) were examined using linear discriminant analysis. The discriminatory validity of the function was assessed on the same sample and by the “resubstitution” method 13 in which discriminant analysis is iteratively carried out on the sample, minus one different subject, at each time (the first, the second and, finally, the last); the equations obtained are then used to classify the excluded subject. An α of 0.05 was the level significance chosen for all of the statistical tests. Statistical analyses were carried out by means of SAS (version 6.12).
Results
The LH group had significantly lower FIF50% values compared to those predicted by Bass 12 (2.66±0.86 versus 3.83±0.76 L·s−1; p<0.0005) and a mean FEF50%/FIF50% ratio>l (1.53±0.43); the other forced respiratory parameters were not statistically different from their predicted values: FEV1: 2.61±0.71 versus 2.53±0.68 L; FEF50%: 3.94±1.36 versus 4.02±0.81 L·s−1. None of the forced respiratory parameters for the C group was statistically different from the predicted value: FEV1: 2.97±0.83 versus 2.92±0.76 L; FEF50%: 4.22±1.32 versus 4.27±0.77 L·s−1; FIF50%: 5.04±1.86 versus 4.38±0.80 L·s−1, FEF50%/FIF50%: 0.91±0.34.
At the three respiratory frequencies investigated, the median values (range) of the number of breaths·min−1 were 29 (26–35), 58 (55–65) and 89 (85–95) in LH patients, and 29 (25–34), 60 (55–64) and 92 (85–96) in the C group.
The sRaw values of the LH patients were similar to those of the controls at 30±5 breaths·min−1 (5.54±1.88 versus 5.68±1.06 cmH2O·s; p=0.776) but they progressively and significantly increased with respiratory frequency (30±5, 60±5 and 90±5 breaths·min−1: from 5.54±1.88 to 6.63±1.96 and 8.05±2.6 cmH2O·s; Spearman's: r=0.4715; p<0.0005).
Conversely, no significant increase was observed in the C group, whose corresponding values were 5.68±1.06, 5.85±0.95 and 5.9±1.12 cmH2O·s; (r=0.0994; p=0.142). These results are summarized in figure 2⇓.

Specific airway resistance values (sRaw) of each subject at respiratory frequencies of 0.5, 1 and 1.5 Hz. a) In the laryngeal hemiplagia (LH) group (n=21), there is a statistically significant increase in sRaw values as respiratory frequency increases (p<0.0005). b) In the control (C) group (n=21), the increase in respiratory frequency does not lead to any significant variation in sRaw (p=ns).
As shown in figure 3⇓, there was no significant variation in ITGV at increasing frequencies in either the LH (2.59±0.59, 2.61±0.62 and 2.57±0.62 L) or the C group (2.87±0.75, 2.86±0.77 and 2.78±0.78 L). Figure 4⇓ shows the relationship between FIF50% and sRaw difference (ΔsRaw=sRaw at 1.5 Hz-sRaw at 0.5 Hz). The controls had significantly higher FIF50% values (112.5±29.85 versus 67.1±19.14, p=0.0001) and significantly lower ΔsRaw values (0.22±0.767 versus 2.50±1.4821, p=0.0001) than the LH patients.

Intrathoracic gas volume (ITGV) values of each subject evaluated at respiratory frequencies of 0.5, 1 and 1.5 Hz. There is no significant variation in intrathoracic gas volume (ITGV) values at increasing frequencies in either the a) laryngeal hemiplagia (LH) or the b) control (C) group (p=ns).

Relationship between forced inspiratory flow at 50% of the vital capacity (FIF50%) and change in specific airway resistance (ΔsRaw) (1.5–0.5 Hz) in the laryngeal (•) and control (C) (○) group. Separate analyses of the two groups did not reveal a linear correlation. The C group (n=21) has significantly higher FIF50% than the LH group (n=21), and lower ΔsRaw (1.5–0.5 Hz) values. x1=−10.10390+FIF50%·0.17915+ΔsRaw (1.5–0.5 Hz)·0.21941; x2=−591155+FIF50%·0.10797+ΔsRaw (1.5–0.5 Hz)·1.83210.
In particular, eight of the 21 controls had negative ΔsRaw values due to decreased resistance, but the values increased in all of the LH patients because of the presence of vocal-cord paralysis.
When ΔsRaw and FIF50% are considered separately, there was a considerable overlap between LH patients and controls: 11 of the 21 controls had ΔsRaw values within the LH range of values, and eight (or nine) of the 21 LH patients had FIF50% values within the control range.
However, linear-discriminant analysis made it possible to separate the two groups using a composite index, based on spirometric and plethysmographic data and given by the equations shown at the bottom of figure 4⇑.
Having calculated the X1 and X2 values, a subject was classified as a “control” if X1 >X2 and as a “patient” if X1 <X2. Using these equations, all of the controls were correctly classified and 19 of 21 LH patients; in particular, LH patients no. 15 and no. 17 were wrongly classified as controls because of their high FIF50% values (99 and 93 respectively).
Furthermore, using a more conservative criterion for assessing the validity of the classificatory rule (resubstitution method), the results were again sufficiently satisfactory since only two subjects were wrongly classified (control no. 15 and patient no. 14).
Discussion
The results of the study demonstrate that all the patients with unilateral vocal-cord paralysis, unencumbered by another associated in disorder, showed a frequency-dependent increase in sRaw measured by body plethysmography whereas, in agreement with other authors 14, 15, no significant variation in sRaw values were found in healthy control subjects at quiet breathing (0.5 Hz) versus slow and mild panting (1 and 1.5 Hz).
During hyperventilation, the posterior cricoarytenold muscles (abductors of the vocal cords) are permanently contracted and, as a consequence, laryngeal resistance is abolished during expiration 16. This reduction in airway resistance may vary from case to case due to the different anatomical characteristics of each single larynx; as can be expected, some of the healthy subjects showed a decrease at the higher respiratory rate, but their changes in sRaw were very small. As has been previously shown in the literature, it was also found that the LH patients had a reduced FIF50% and a mean FEF50%/FIF50% ratio>l, whereas all of the other studied parameters were within normal limits.
The larynx is the critical organ in which deglutition, respiration and phonation are centred. The respiratory movements of the glottis have been a focus of interest for nearly a century, but the unnatural oropharyngeal posture rendered the studies difficult. During the past two decades, a direct approach using fibreoptic endoscopy allowed clear observations without excessive interference with normal breathing. Brancatisano et al. 17 used this technique to study the respiratory movements of the glottis in 12 healthy subjects, and observed that during quiet breathing, the glottic area oscillated about a mean of 98 mm2. There was no difference in glottic diameter between vital capacity inspiration at low and high flow rates. Panting at FRC widened the glottic aperture during the expiratory phase in nine subjects, but, during the inspiratory phase, there was no difference in glottic diameter between panting and the preceding period of quiet breathing.
LH leads to an imperfect apposition of the vocal cords, but LH patients usually have normal upper-airway resistance during resting ventilation 10, because the paralyzed vocal cord hardly interferes with airflow and, by passively moving laterally, allows the passage of both slow and forced expiratory flows, which are also facilitated by the physical conformation of the overturned funnel-shaped subglottis area.
The free border of the vocal cord and the swallowing saucer-like contour of the floor of the ventricle captures the force of the inspiratory flow and, particularly when flaccid, can be displaced into the air stream and thus cause a greater turbulence that tends to reduce maximal inspiratory flow (V'imax) more than maximal expiratory flow. In some patients, there may be a very large discrepancy between inspiratory and expiratory flows, and expiratory flow can be even normal in the presence of a gross reduction in V'imax 18.
Ingelstedt and Tormernalm 19 used heat coefficient changes in a tracheal model to analyse the relationship between flow rates and pressure differences across the orifice. On the basis of these data, Al-Bazzaz et al. 20 studied five healthy nonsmokers whose upper airway lumen was gradually narrowed artificially, and found that increased airflow rates caused a minimal increase in airway resistance when the airway diameter was normal; however, at smaller airway diameters, any increase in flow rates induced a marked increase in airway resistance up to prohibitive values.
Evidence supporting the hypothesis that increased airflow increases airway resistance has been presented by Shim et al. 21, who measured inspiratory resistance across a unilaterally paralyzed vocal cord and found it to be 5.83 cmH2O·L·s during resting ventilation and 16 cmH2O·L·s during hyperventilation. A reduction in glottic diameter is silent at low flow rates but becomes detectable when respiratory frequency is increased because it creates turbulent flows.
A pressure-gradient greater than that present in laminar motion is therefore needed to produce the same airflow. In the case of turbulence, the pressure gradient is approximately proportional to the square of the flow speed and inversely related to the diameter to the power of 5 (Darey's law); in laminar motion, it is proportional to the flow speed and inversely related to the radius to the power of 4 (Poiseulille's law). On the basis of the definition of these laws, it can be seen that airway resistance depends on the type of flow.
An alternative approach is to fit mathematical expressions to isovolume pressure flow (IVPF) curves. Mead et al. 22 related driving pressure (P) to expiratory flow (V') by fitting a second-order polynomial of the form  where K1 and K2 are arbitrary calculated constants, to the curve at low driving pressures, they argued that the development of dynamic expiratory compression could be detected by a deviation from this curve at higher driving pressures. A similar approach was applied to inspiratory IVPF curves. If the relationship between driving pressure (P) and flow can be expressed as:
  or resistance P/V' is linearly related to flow; the effect of dynamic compression will be to produce a disproportionate increase in resistance and a curvilinear relationship.
It is well known that the flow-volume loop is the best method of functional evaluation in patients with upper-airway obstruction, but they sometimes find it difficult to perform a forced inspiratory test in addition, as Miller 23 has pointed out, the marked flow reduction during large volume-forced inspiration and expiration in patients with upper-airway obstruction is due to the effort dependency of the tests themselves. As the pressure generated at high lung volumes is dissipated across the orifice of the obstruction, FIV1 is likely to be more affected than FEV1 because it is effort dependent at all lung volumes.
To conclude, the results of the study show that sRaw values significantly increase at higher respiratory frequencies, only in patients with LH. Using a linear discriminant function, it was possible to classify the LH patients and control subjects correctly at a sufficiently satisfactory level of accuracy by combining spirometric and plethysmographic data. The multiple, rapid, and noninvasive plethysmographic testing of the frequency-dependent increase in specific airway resistance, together with the spirometric data obtained from the flow-volume loop, can therefore be considered a useful means of obtaining a more complete functional assessment of unilateral vocal-cord paralysis.
Acknowledgments
The authors would like to thank the reviewers for their useful comments, which led to a better version of the paper.
- Received July 7, 2000.
- Accepted July 18, 2001.
- © ERS Journals Ltd