


In vitro assessment of equipment and software to assess tidal breathing parameters in infants
- 1Dept of Neonatology (Charité), Humboldt University Berlin, Germany and 2Portex Anaesthesia, Intensive Therapy and Respiratory Medicine Unit, Institute of Child Health, London, UK
- G. Schmalisch, Dept of Neonatology (Charité), Humboldt University Berlin, Schumannstraβe 20/21, D-10098, Berlin, Germany. Fax: 49 3028025824
Abstract
The aim of this in vitro study was to compare the measurement accuracy of two currently available devices for measuring tidal breathing in infants.
A mechanical model pump was used to generate flow profiles which simulated those observed in infants. A range of flows was applied simultaneously to two different devices, namely the commercially available SensorMedics 2600 (SM 2600) and more recently developed, custom-made equipment based on the flow-through technique (FTT). Automatically derived values from both devices were compared with one another and with manual calculations of printouts of the same breaths.
There were no differences in the raw flow signal obtained from the two devices, nor between values calculated automatically or manually from the FTT. Similarly, the deviations between the FTT and SM 2600 were <3% for tidal volume, respiratory frequency and minute ventilation. However, when comparing either with manually calculated values or those derived automatically from the FTT, there was a systematic and highly significant underestimation of shape-dependent parameters, such as the time to peak tidal expiratory flow as a proportion of tidal expiratory time (tPTEF/tE), derived by the SM 2600. The lower the applied flow, the higher the observed deviations, the underestimation being up to 60% when flows simulating those observed in preterm neonates were applied.
These errors appear to result from differences in signal processing such as the algorithms used for breath detection and can only be detected if appropriate nonsinusoidal flow profiles representing those seen in infants are used to evaluate equipment.
- equipment
- flow-through technique
- infants
- respiratory function tests
- software
- validation
This work, was supported by the German Ministry for Research and Technology, project “Perinatal Lung” (grant 01 ZZ 9511) and Deutsche Forschungsgemeinschaft (Schm 1160/1-2).
In contrast to that used in adults, in vivo validation of equipment designed to measure respiratory function in infants is extremely difficult, due to the highly variable breathing pattern, limited period of sleep when recordings can be obtained and the potential influence of apparatus dead space on the recordings achieved 1. Consequently, greater reliance must be placed on in vitro evaluation in this age group. Unfortunately, in the past, such evaluations have often been performed with relatively large sinusoidal signals that do not necessarily represent the variety of flow signals that are observed during infant respiratory function tests (RFTs). Although several in vitro studies have been performed to assess precision of various infant RFT devices 2–5, a thorough assessment of measurement error has been difficult due to the wide range of signals encountered in this age group according to age, clinical condition and type of test. Thus while peak flow may be less than 30 mL·s−1 during tidal breathing in a sick preterm infant, it may exceed 2 L·s−1 during forced expiratory manoeuvres from raised lung volume in a healthy 18 month old. A European Respiratory Society/American Thoracic Society (ERS/ATS) task force is trying to address some of these problems by defining minimal performance criteria for equipment 6 and software 7.
During the last few years, several new techniques have been developed 8 and measurements are now more commonly performed with commercially available equipment than in the past. There is an urgent need for careful validation of such devices by in vitro measurements prior to any clinical or research applications. While the accuracy of volume measurements can easily be determined using calibration syringes 5, the accuracy of other tidal breathing parameters is more difficult to determine, since this requires a model pump with adjustable flow profiles if it is to provide a meaningful simulation of in vivo measurements 9. With increasing emphasis on the need for quality control and standardization of infant RFTs if these are to be used as reliable outcome measures in clinical or research studies, it is essential to compare the performance of different devices under conditions that closely resemble those likely to be encountered physiologically.
The aim of this study was to use a model pump that could deliver a variety of tidal volumes with variable flow profiles to compare the measurement accuracy of two currently available devices for measuring tidal breathing in infants.
Methods
Model pump
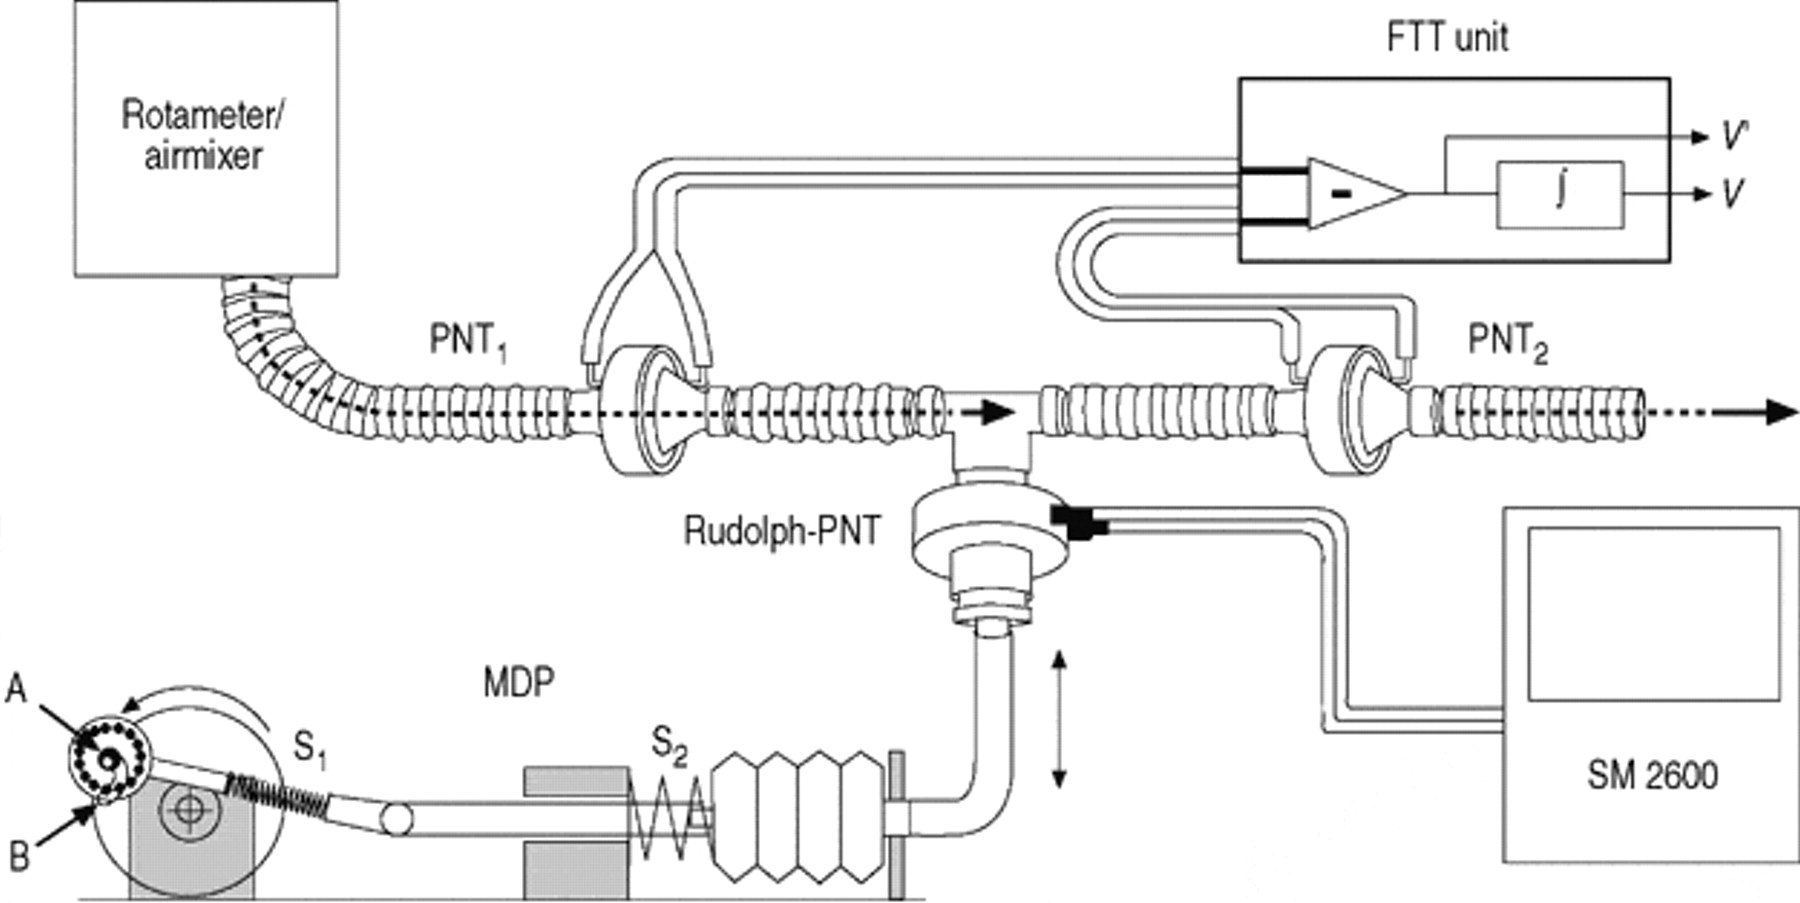
A mechanical model pump (fig. 1⇓) was used to generate flow profiles which would simulate those observed in infants. As shown in figure 1⇓ the pump delivered the flow profiles via a T‐piece to both devices in the same circuit, simultaneously. Airflow was generated by a motor driven pump which consisted of a spring loaded silicon bellow connected to an exchangeable cam disk. During inspiration, the connecting rod was held at point A (fig. 1⇓), resulting in a relatively sinusoidal flow pattern. At the beginning of expiration the holding point of the connecting rod moved from point A to point B, thereby changing the expiratory flow pattern. At the end of expiration the holding point moved back from B to A.

Equipment to validate accuracy of tidal breathing parameters by simultaneous measurements with the SensorMedics 2600 (SM 2600) (Rudolph-PNT) and flow-through technique (utilizing two pneumotachometers (PNTs); PNT1 and PNT2). Airflow to simulate the breathing pattern is generated by a motor driven pump (MDP) and a cam disc. The spring, S1, provided continuous guidance of a ball bearing moving along the cam with two different end-points, A and B. Different flow profiles could be generated by changing the cam disk. V′: minute ventilation; V: volume; FTT unit: flow through technique measuring unit, measuring and integrating (∫) the differences between PNT1 and PNT2.
The resistance of the model pump was sufficiently high (21 kPa·L−1·s at 5 L·min−1) to ensure that the additional small resistance of the PNTs and tubing did not impair the flow profile generated. By exchanging the silicon bellow and cam disk, flow signals with a volume of 15 mL, 29 mL, 46 mL or 61 mL could be generated. For each volume, four different expiratory flow profiles could be used with peak expiratory flow being attained between 21% and 63% of the total expiratory time. Two of these profiles, representing the lowest volume with an early peak tidal expiratory flow and the highest volume with a late peak tidal expiratory flow, are shown in figure 2⇓. Respiratory frequency was kept constant at 30 min−1 for all measurements.

Example of recordings from four consecutive breathing cycles from the two different flow profiles (a, c and e represent flow profile 1 and b, d and f represents flow profile 2) that were used for manual evaluation of the tidal breathing parameters. Collated flow-volume loops (a and b) and corresponding time based traces of flow (c and d) and volume (e and f) are shown for each profile. Insp: inspiration; Exp: expiration.
Equipment for tidal breathing measurements
The two systems selected for the purpose of this study were the well established and widely used SensorMedics 2600 (Sensormedics, Anaheim, CA, USA) 10–12 and a more recently developed, custom-made equipment based on the flow-through technique 1. The SensorMedics 2600 (SM 2600) uses a screen pneumotachograph (PNT) with a measuring range of ±10 L·min−1 and a resistance (RPNT) of 0.5 kPa·L−1·s as defined by the back pressure at 5 L·min−1 (Hans Rudolph Inc., Wyandotte, MI, USA). The flow-through technique (FTT), in which the face mask and both pneumotachographs (PNT1, and PNT2) are continuously rinsed by a constant background flow that virtually eliminates apparatus dead space was developed to allow long-term measurements even in oxygen dependent infants 13. Full details of previous validation of the FTT have been published previously 1, 14. The FTT consists of two screen PNTs with a measuring range of ±24 L·min−1 with RPNT of 0.2 kPa·L−1·s as defined by the back pressure at 5 L·min−1 (Baby PNT Jaeger, Würzburg, Germany). The background flow (room air, 22°C) was adjusted by a laboratory rotameter (Aalborg Instruments and Controls Inc., Orangeburg, NY, USA) to 6 L·min−1 and kept constant for all measurements. This background flow did not have any visible effect on measurements obtained with the SM 2600 when the two devices were connected to the pump via the T‐piece for simultaneous measurements (fig. 1⇑).
Both devices allowed raw flow transducer signals to be recorded as an electrical voltage signal. For the SM 2600, this was achieved via a special service port of the device, whereas it was an integral part of the FTT system. There was comparable resolution of signal processing of the flow signals from both devices, with respect to both sampling rate (256 Hz for the SM 2600 and 200 Hz for the FTT) and A/D conversion (14 and 16 Bit A/D conversion, respectively). A warm up period of 30 min was allowed for both devices and calibration of the PNT, including the linearization procedure of the SM 2600, was performed prior to the measurements.
Protocol
For the evaluation, three tidal breathing parameters which depend only on the depth and frequency of the breathing cycle (tidal volume (VT), respiratory frequency (fR), minute ventilation (V′E)) were selected, together with four parameters which depend on the shape of the time based flow signal or tidal breathing flow-volume loop (TBFVL) (expiratory time (tE), time to peak tidal expiratory flow as a proportion of tidal expiratory time tPTEF/tE, volume to peak tidal expiratory flow as a proportion of tidal volume (VPTEF/VT) and flow when 25% of tidal volume remains in the lung (TEF25)).
Using the signals shown in figure 2⇑, attempts were made to validate the automatically calculated parameters by comparing them with those calculated manually from appropriate print outs. This was relatively simple for the FTT as the calibrated flow and volume signals could be printed out on a large enough scale to permit accurate manual evaluation (fig. 2⇑). Since this was not possible for the SM 2600 due to the relatively poor quality of the graphics, the tidal breathing parameters calculated by the SM 2600 were compared with those derived by manual evaluation of identical breaths that were measured and printed by the FTT. In addition, the uncalibrated raw flow signals of the SM 2600 were used to compare the values of timing parameters such as tE and tPTEF/tE that were calculated both manually and automatically by the SM 2600 (fig. 3⇓).

Comparison between values of expiratory time (tE) and time to peak tidal expiratory flow as a proportion of tE tPTEF/tE; T) that were evaluated manually from the uncalibrated raw flow signal from the SM 2600, measured in volts via a service port, and those displayed by the SM 2600 after automatic calculations on the same breaths (data in brackets). Positive voltage indicates respiration, negative indicates expiration. T: tPTEF/tE. *: tE=42 s (1.40 s), tPTEF/tE=20.6% (11%); #: tE=1.42 s (1.39 s), tPTEF/tE 21.4% (11%); ¶: tE=1.42 s (1.37 s), tPTEF/tE 21.4% (11%); +: tE=1.42 s (1.40 s), tPTEF/tE 20.6% (13%).
Since the SM 2600 only permits storage of four consecutive breathing cycles, precise matching of exactly the same breaths recorded by two different devices is extremely difficult. In an attempt to minimize this potential source of error, 12 breathing cycles were evaluated for each flow profile (12 consecutive cycles in FTT; 3×4 consecutive cycles with the SM 2600). The absolute and relative deviation between both devices was calculated as: and
and respectively.
Statistical methods
Mean±sd were calculated for all ventilatory parameters and the comparability of parameters between the two devices was assessed using the method of Bland and Altman 15. The coefficient of variation (CV(%)=100×(sd/mean)) was used to describe the reproducibility of each parameter and the CVs for each device were compared by a rank test. Statistical evaluations were performed using the software STATGRAPHICS (Vers. 4.0, Manugistics Inc., Rockville, MD, USA). A level of statistical significance of p<0.05 was accepted.
Results
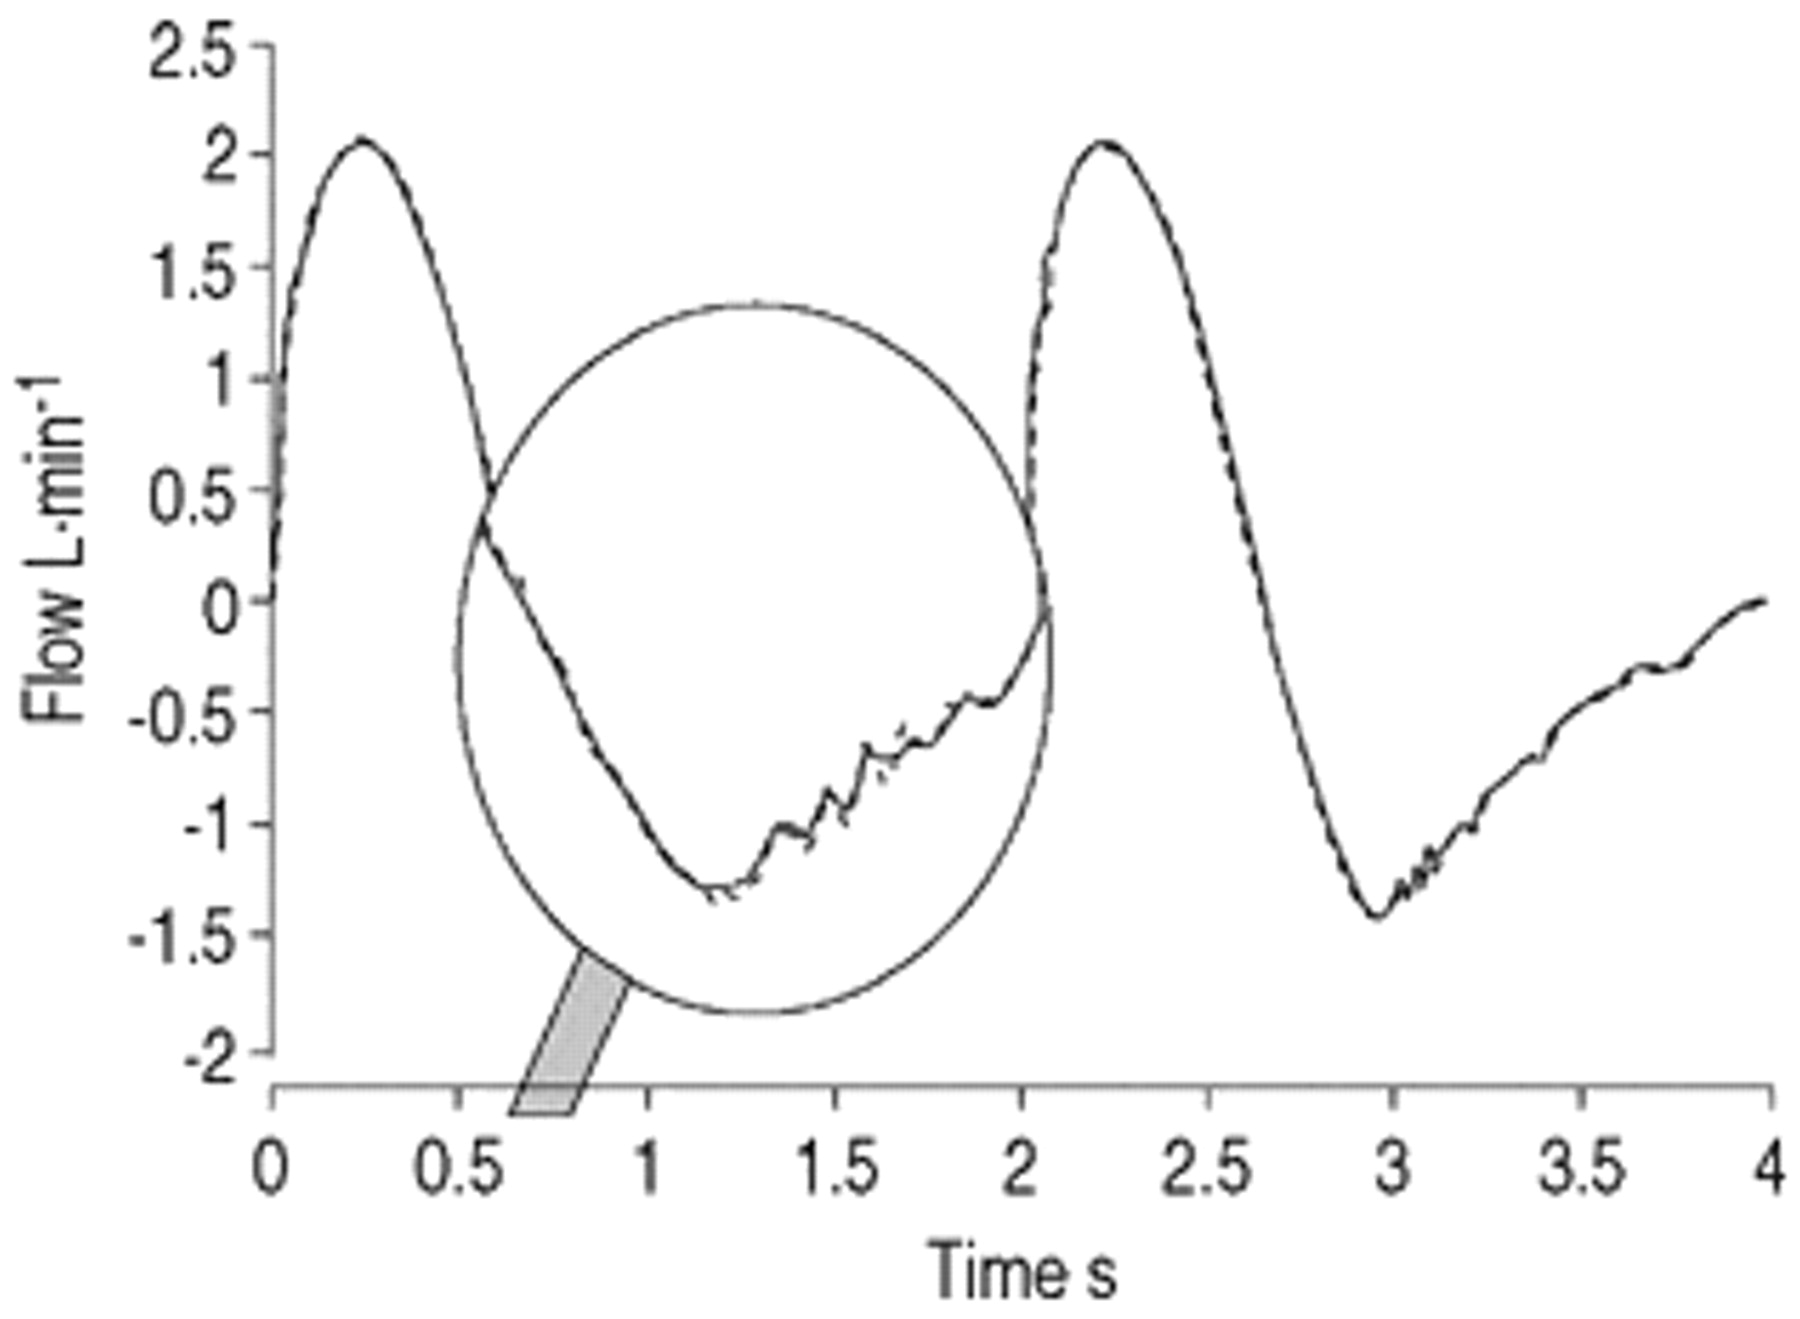
The raw flow signals of the two devices differed in amplitude and zero off-set, but once these had been adjusted, there were no visible differences in the shape of the flow signal between the devices. A representative example of the flow signal simultaneously recorded by the two systems is shown in figure 4⇓. The magnified portion of the trace shows that the background flow caused only a very slight increase in noise on the FTT-signal.

Example of flow signals of the SensorMedics 2600 (SM 2600) and flow-through technique (FTT) after adjustment of zero line and magnitude. ‐ ‐ ‐ : SM 2600; — : FTT.
Comparison of automatically derived parameters with those calculated manually.
Table 1⇓ shows the comparison of the values obtained for various tidal breathing parameters using the signals shown in figure 2⇑, when evaluated manually, and when derived automatically by the two devices. As shown during previous evaluations 16, there was close agreement for all parameters between the results derived from manual evaluation and those automatically calculated by the FTT, with no bias between the two approaches. The deviations were always <1.2% and could simply be attributed to reading errors. Similarly, for both flow profiles, there were only small deviations between values for VT, V′E fR, tE and TEF25 measured automatically by the SM 2600 and those evaluated manually (<5%) (table 1⇓). By contrast, very marked and highly significant differences between these two approaches were observed for both tPTEF/tE, which was up to 61% lower, when calculated by the SM 2600, than suggested from the manual evaluation of the trace, and VPTEF/VT, which was up to 26% lower. These errors were most marked for flow profile 1, which had the smallest tidal volume, but remained significant (on average 17% lower) for tPTEF/tE even when a tidal volume of 60 mL was used (flow profile 2). The discrepancies in tPTEF/tE can be inspected on a breath by breath basis in figure 3⇑. This shows that, even when using the raw flow signal of the SM 2600, large deviations occur between the automatically determined tPTEF/tE and that evaluated manually, and suggests that the large deviations in tPTEF/tE and VPTEF/VT summarized in table 1⇓ were probably caused by an error introduced at the signal processing level.
Comparison of tidal breathing parameters evaluated manually and measured automatically with the SensorMedics 2600 (SM 2600) and flow-through technique (FTT) using two different flow profiles
Comparison between the devices
As shown in table 2⇓, there was very close agreement (median deviation <1.5%) between the FTT and SM 2600 for those parameters which depended simply on the respiratory frequency and the magnitude of the flow and volume signals. For these parameters, there was no statistically significant influence of the flow profile or the magnitude of volume delivered on the differences between the devices,
Relative deviations in the tidal breathing parameters between SensorMedics 2600 (SM 2600) and flow-through technique (FTT) in relation to the volume of the applied signal
By contrast, the values displayed by the SM 2600 for parameters which depend on the shape of the flow profile, especially tPTEF/tE and VPTEF/VT, differed considerably from the FTT results, with mean differences of up to 60% between the techniques for tPTEF/tE. Furthermore, for both of these parameters, the magnitude of the flow signal significantly influenced the extent to which values from the two devices differed; the lower the flow, the higher the discrepancy (table 2⇑). Alterations in the flow profile however, did not have any significant effect on the magnitude of recorded differences.
The variability of the calculated parameters was very low for VT, fR, V′E, tE and TEF25 (median CV<1.5%), although the CVs for the SM 2600 where generally significantly higher than those for the FTT (table 3⇓). Considerably larger CVs were found for tPTEF/tE, and VPTEF/VT for both devices.
Coefficients of variation for various tidal breathing parameters
Discussion
Whether using infant RFTs for clinical or research purposes, the accuracy of the devices used must be taken into account 1, 17. This is particularly pertinent for RFTs in sick newborns, in whom many difficulties in assessing respiratory function remain unresolved 18. In the past, it has been extremely difficult to undertake such evaluations due to the lack of suitable lung models that can simulate an appropriate range of flow profiles 9, and the difficulties in obtaining details of algorithms, or in exporting either raw or calibrated signals from commercially available devices to facilitate such investigations 7. The current study was able to address at least some of these difficulties, and provided clear evidence of the existence of discrepancies between equipment currently available to assess tidal breathing in infants.
Comparison of both devices
The SM 2600 is currently the most frequently used and extensively investigated commercial device for RFT in newborns 10–12, and hence was selected for this comparative study. In addition, during a recent assessment of the influence of apparatus deadspace on tidal breathing parameters in infants 1, marked discrepancies were identified in certain parameters over and above those that would be anticipated for physiological reasons, which warranted further investigation. Previous investigations have demonstrated that both the SM 2600 and the FTT can measure volume accurately (<3% error) over the range of 10–60 mL 14, 18, and this was confirmed in the present study. However, there is no published information about the accuracy of shape dependent tidal breathing parameters such as tPTEF/tE which are widely used but much more difficult to evaluate.
The accuracy of the software in the FTT was relatively easy to validate, in that not only was there full access to the algorithms used, and the ability to export and inspect raw and calibrated signals such as ASCII files, but there was sufficient resolution in the graphics and printouts to enable accurate manual checks to be performed for the parameters that were automatically displayed by the device (figs. 2 and 3⇑⇑). However, since this was not possible with the SM 2600 due to the poor quality graphical printouts, detection of any flow-dependent measuring errors in tPTEF/tE and VPTEF/VT would have been much more difficult. The equipment and software of the SM 2600 (which is currently undergoing major review) is at least 10 yrs older than those of the FTT and significant technological progress in data processing and graphical display has occurred during this period. Nevertheless, the ability to access the raw flow signal from the SM 2600 via a special service port did allow some manual checks to be performed. Both devices have nearly the same flow resolution with regard to magnitude and time and, after numerical adjustments of the zero line and amplitude, it is evident that both raw flow signals are virtually the same (fig. 4⇑), Since there is no visible difference in the flow signals between the two devices, the observed differences in the displayed results must be the result of: 1) differences in the calibration factors; 2) numerical corrections (e.g. correction to body temperature, pressure, saturated (BTPS) conditions); 3) compensation and control of zero-line offset; or 4) the evaluation software.
Deviations in the measured parameters
The comparative in vitro measurements showed that, for parameters such as VT, fR and V′E, the observed differences between both devices were low over the whole volume range, and would not have any influence on the comparability of these parameters. By contrast, much larger deviations were found for tidal breathing parameters which depend on the shape of the flow and volume signal. Such parameters are much more influenced by signal processing (sample rate, analogue/digital conversion, filtering), noise, software and to a large extent, by the shape of the flow profile. The curvature of peak values on the flow signal is often relatively flat such that small disturbances in the flow signal can cause large deviations in tPTEF or VPTEF. This is reflected in the current study by the much higher CVs for tPTET and VPTEF than for VT, fR and V′E (table 3⇑).
Many of the observed deviations between the FTT and SM 2600 (tables 1 and 2⇑⇑) may have resulted from the use of different algorithms to detect the beginning of inspiration and expiration. As discussed in detail recently, this is an extremely complex area which can easily lead to errors, especially in the presence of low flows or noisy signals 19, 20. For the more recently developed FTT, the equipment and software had been designed to ensure optimal stabilization of the end-expiratory level 16 and breath detection, even in the presence of noisy signals 19. Since the SM 2600 is based on unpublished algorithms, it is difficult to identify the source of the discrepancies in tPTEF/tE and VPTEF/VT, between the two devices. The fact that there was close agreement in the values of tE calculated automatically, whether compared with those derived manually from the SM 2600 flow signal, or reported by the FTT, suggests that the error must lie in the way in which tPTEF is automatically calculated by the SM 2600.
In the current study, the deviations of tPTEF/tE and VPTEF/VT between the two devices were found to decrease with increasing magnitude of the flow and volume signal (table 2⇑). This dependence on flow for accuracy of displayed parameters often occurs in devices which use a dead band around the “zero flow” to stabilize the numerical integration of the signal (fig. 5⇓). In such a system, all flow values within the selected dead band are set to zero so that there is no volume drift when flow is in this range, as may occur for example during a long expiratory pause. As shown in figure 5⇓, such a dead band will have only a minimal influence on fR or tE but, as a result of the delay in recognizing start of expiration, may lead to significant underestimation of tPTEF, the magnitude of which will be inversely proportional to that of the flow signal. Similar effects will be obtained if thresholds of the volume signal are used to reduce the drift of the displayed volume. Further potential sources of measurement error when calculating tPTEF/tE and VPTEF/VT include failure to interpolate when identifying the exact moment of zero crossing between inspiration and expiration, and the presence of a zero-offset on the flow signal. The latter may arise from an undetected or poorly corrected off-set on the flow transducers or as the result of inappropriate correction of a volume drift.

Illustration of how the time to peak tidal flow (tPTEF) may be underestimated if a dead band is used around zero flow to reduce the volume drift. With increasing magnitude of the flow signal the measuring errors caused by such a dead band will decrease. DB: dead band; Insp: inspiration; Exp: expiration; ×: time delay due to dead band.
The deviations of tPTEF/tE found in this in vitro study were remarkably similar to those reported recently during consecutive measurements of tidal breathing in 86 infants using the same two devices 1. In that study, paired measurements of tPTEF/tE were on average 54% lower when measured with the SM 2600 than with the FTT. When using similar volumes and flow profiles in this in vitro study, the relative underestimation was 59%. This suggests that, in contrast to the differences between the two devices for VT and fR during in vivo studies, which can simply be attributed to changes in breathing pattern in response to the apparatus deadspace, the observed discrepancies in timing parameters such as tPTEF/tE during such studies may be almost entirely due to differences in signal processing.
Clinical implications
The SM 2600 represents the first generation of commercial equipment for infant respiratory function testing, and has made an important contribution to the clinical use of RFT in infancy. An unexpected finding from this study was that the measuring errors of the older device were not due to limitations of the sensors/transducers, but more to limitations in the software that was available at this time. Inability to perform simple checks on the accuracy of displayed parameters due to poor graphical resolution of the displayed and printed signals, together with the lack of suitable means of assessing performance formally, meant that any errors could easily go undetected for long periods of time. Since evaluations of this nature have rarely been performed, similar problems may well exist in other currently available systems, whether commercially available or custom built.
The results from this study suggest that equipment for infant RFTs needs to be carefully checked using a suitable model 9 before clinical application 4, 6, 18. When measuring tidal breathing, information about the accuracy of volume measurements alone is not sufficient, since the accuracy of tidal breathing parameters depends on measuring both the range and the shape of the flow signals. Extensive model measurements for infant RFT using different flow signal patterns have not been performed, and any previous evaluations have been based on relatively large sinusoidal signals that are rarely observed during clinical measurements.
The discrepancies in tPTEF/tE during both in vitro and in vivo studies were so large that values reported in the literature collected using different devices will clearly not be comparable. Furthermore, the relationship between the magnitude of error and absolute flows may seriously impair interpretation of the effects of disease, therapeutic interventions or growth and development on such parameters. There is therefore an urgent need for the user to have access to the algorithms and thresholds that are used in any specific device, and to understand how differences between devices may influence the results.
During recent years, there have been dramatic technological advances in both computer hardware and software. This has been accompanied by an increased commitment from both users and manufacturers to establish internationally approved standards in order to improve the confidence with which such equipment can be used 6, 7. Indeed, following recent discussions with the European Respiratory Society/American Thoracic Society task force on standardization of infant respiratory function tests, manufacturers have agreed that in future, details of relevant algorithms will be more readily available to the users. This would greatly facilitate meaningful evaluations and comparisons of different systems, and hopefully minimize the occurrence of the type of discrepancies identified in this study.
- Received June 30, 1999.
- Accepted July 26, 2000.
- © ERS Journals Ltd