


Figures


Tables
- TABLE 1a
Baseline characteristics of the study population
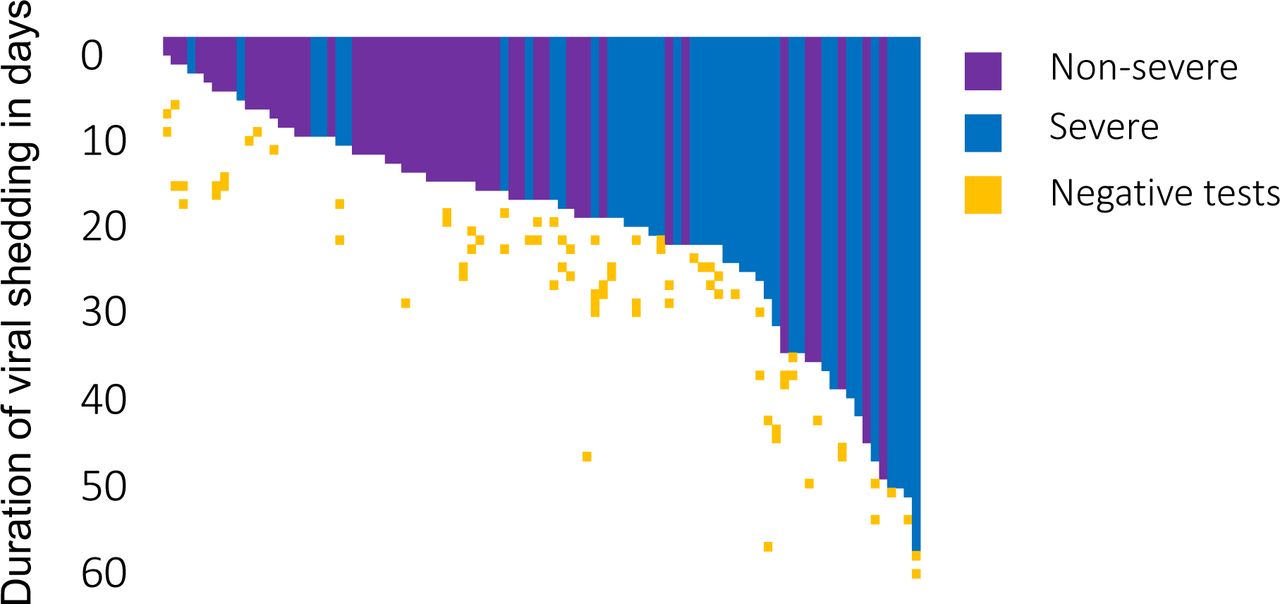
Non-Severe disease No mechanical ventilation Severe disease Mechanical Ventilation necessary p-Value n=92 n=51 (55.4%) n=41 (44.6%) Age, mean±sd 60.2±15.8 57.9±18.1 63.1±12.7 0.258 Male, n (%) 71 (77.3%) 36 (70.6%) 34 (82.9%) 0.22 Continuous oxygen insufflation, n (%) 61 (66.3%) 21 (41.2%) 41 (100%) <0.001 Admission to ICU, n (%) 47 (51.1%) 9 (17.6%) 41 (100%) <0.001 Days of mechanical ventilation±sd n.a. 22.6±14.1 n.a. Days of hospitalisation±sd 18.5±13.4 13.1±7.8 25.3±15.6 <0.001 Use of ECMO, n (%) 5 (5.4%) n.a. 5 (12.2%) n.a. Days of ECMO use n.a. 13.6±3.8 n.a. ECMO mortality, n (%) n.a. 3 (60%) n.a. Discharge, n (%) 66 (72.5%) 45 (88.2%) 21 (47.2%) <0.001 Fatal, n (%) 7 (7.6%) 0 (0.0%) 7 (17.9%) 0.003 Presence of COVID-19 typical radiological changes, n (%) 85 (92.4%) 44 (86.3%) 41 (100%) 0.013 Initial viral load in nose swabs (copies·mL−1)±sd 12.8×10⁶±41.1×10⁶ 12.6×10⁶±43.1×10⁶ 13.0×10⁶±39.9×10⁶ 0.127 Initial viral load in endotracheal aspirate (copies·mL−1)±sd n.a. 67.2×10⁶±273×106 n.a. Duration of viral shedding in days (with twice confirmed negativity)±sd 18.7±12.0 13.9±9.5 (n=16) 25.8±11.8 (n=18) 0.025 Persistent viral shedding (≥17 days), n (%) 44 (47.8%) 14 (27.5%) 30 (73.2%) <0.001 Time to first testing in days±sd 7.4±4.7 6.5±4.0 8.4±5.3 0.12 Comorbidities n (%) Arterial hypertension 48 (52.2%) 24 (47.1%) 24 (58.5%) 0.30 Diabetes mellitus Type 2 18 (19.6%) 8 (15.7%) 10 (24.4%) 0.43 Coronary artery disease 15 (16.3%) 9 (17.6%) 6 (14.6%) 0.78 COPD 11 (12.0%) 4 (7.8%) 7 (17.1%) 0.21 Immunosuppression 22 (23.9%) 13 (25.5%) 9 (22.0%) 0.81 Charlson comorbidity index±sd 2.5±1.8 2.5±1.9 2.6±1.7 0.62 Data are mean (sd) or n (%). p values were calculated by Mann-Whitney U test or χ² test, as appropriate. Severe disease was defined by the need of mechanical ventilation. COVID-19 typical changes included either ground glass opacities or diffuse bilateral infiltrates. Duration of nasopharyngeal viral shedding was defined by the time between symptom begin and last positivity for viral shedding in standardized nose swabs or endotracheal aspirates.
- TABLE 1b
Baseline characteristics of the study population
Non-Severe disease No mechanical ventilation Severe disease Mechanical Ventilation necessary p-Value n=92 n=51 (55.4%) n=41 (44.6%) Inflammation parameters Initial CRP (mg·dL−1) 7.9±9.0 4.7±5.2 12.6±11.3 <0.001 Peak CRP (mg·dL−1) 15.4±12.1 8.5±7.9 25.6±9.8 <0.001 Initial PCT (ng·mL−1) 0.41±0.73 0.22±0.33 0.68±1.04 <0.001 Peak PCT (ng·mL−1) 4.14±13.7 2.95±14.2 5.91±12.9 <0.001 Initial IL-6 (pg·mL−1) 189.3±737.8 75.3±292.4 359.9±1095.5 <0.001 Peak IL-6 (pg·mL−1) 841.8±2300.5 118.9±321.7 1916.3±3352.2 <0.001 Initial WBCs (G·L−1) 10.8±31.6 6.2±3.0 9.5±5.0 <0.001 Peak WBCs (G·L−1) 18.1±43.2 8.5±4.0 21.5±9.7 <0.001 Specific medication Use of broad spectrum antibiotics# n=58 (63.0%) 19 (37.3%) 39 (95.1%) 0.01 Use of Azithromycin n=49 (53.3%) 20 (39.2%) 29 (70.7%) 0.14 Use of antiviral agents¶ n=9 (9.8%) 4 (7.8%) 5 (12.2%) 0.78 Use of hydroxchloroquin n=24 (26.1%) 8 (15.7%) 16 (39.0%) 0.09 Use of prednisolone n=3 (3.3%) 3 (7.3%) Use of tocilicumab n=4 (4.4%) 1 (1.1%) 3 (3.3%) 0.23 Inflammation parameters and specific medication of subgroups.
CRP: C-reactive protein; PCT: procalcitonin; IL-6: Interleukin 6; WBC: White blood cell count.
#Meropenem or piperacillin and tazobactam.
¶Lopinavir/ritonavir (n=8) or Tamiflu (n=1).
- TABLE 2
Cox-Regression analysis of factors associated with prolonged SARS-Cov-2 positivity
Univariate analysis Multivariate analysis Significance Hazard Ratio 95% confidence interval Significance Hazard ratio 95% confidence interval Lower Higher Lower Higher age 0.335 1.013 0.987 1.041 0.831 0.995 0.954 1.03 sex (m=1, f=2) 0.415 1.395 0.627 3.102 0.077 2.531 0.905 7.073 Disease severity (severe=1, non-severe=0) 0.075 1.894 0.939 3.824 0.025 3.260 1.162 9.147 Oxygen insufflation necessary (yes=1, no=0) 0.573 1.321 0.502 3.473 0.057 3.960 0.961 16.319 Hydroxychloroquin therapy (yes=1, no=0) 0.082 0.490 0.219 1.095 0.263 0.597 0.242 1.474 Lopinavir/Ritonavir treatment (yes=1, no=0) 0.796 1.149 0.401 3.296 0.384 1.713 0.509 5.765 Immunsuppressive treatment (Tocilizumab/Prednisolon/others; yes=1, no=0) 0.233 1.723 0.704 4.215 0.110 2.748 0.794 9.511 Diabetes Mellitus (yes=1, no=0) 0.953 0.975 0.422 2.254 0.704 1.243 0.404 3.825 Arterial hypertension (yes=1, no=0) 0.621 1.193 0.593 2.401 0.572 0.765 0.302 1.939 Coronary artery disease (yes=1, no=0) 0.787 1.141 0.440 2.959 0.968 0.978 0.326 2.930 Charlson Score (0–7) 0.425 1.082 0.891 1.314 0.850 1.036 0.719 1.493


