


Abstract
Background The outbreak of the coronavirus disease 2019 (COVID-19) has globally strained medical resources and caused significant mortality.
Objective To develop and validate machine-learning model based on clinical features for severity risk assessment and triage for COVID-19 patients at hospital admission.
Method 725 patients were used to train and validate the model including a retrospective cohort of 299 hospitalised COVID-19 patients at Wuhan, China, from December 23, 2019, to February 13, 2020, and five cohorts with 426 patients from eight centers in China, Italy, and Belgium, from February 20, 2020, to March 21, 2020. The main outcome was the onset of severe or critical illness during hospitalisation. Model performances were quantified using the area under the receiver operating characteristic curve (AUC) and metrics derived from the confusion-matrix.
Results The median age was 50.0 years and 137 (45.8%) were men in the retrospective cohort. The median age was 62.0 years and 236 (55.4%) were men in five cohorts. The model was prospectively validated on five cohorts yielding AUCs ranging from 0.84 to 0.89, with accuracies ranging from 74.4% to 87.5%, sensitivities ranging from 75.0% to 96.9%, and specificities ranging from 57.5% to 88.0%, all of which performed better than the pneumonia severity index. The cut-off values of the low, medium, and high-risk probabilities were 0.21 and 0.80. The online-calculators can be found at www.covid19risk.ai.
Conclusion The machine-learning model, nomogram, and online-calculator might be useful to access the onset of severe and critical illness among COVID-19 patients and triage at hospital admission.
Abstract
An internationally validated model, nomogram, and online- calculator for severity risk assessment and triage of COVID-19 patients at hospital admission.
Introduction
In December 2019, a novel coronavirus, severe acute respiratory syndrome coronavirus 2 (SARS-CoV-2; earlier named as 2019-nCoV), emerged in Wuhan, China [1]. The disease caused by SARS-CoV-2 was named coronavirus disease 2019 (COVID-19). As of May 15, 2020, more than 4 490 000 COVID-19 patients have been reported globally, and over 300 000 patients have died [2]. The outbreak of COVID-19 has developed into a pandemic [3].
Among COVID-19 patients, around 80% present with mild illness whose symptoms usually disappear within 2 weeks [4]. However, around 20% of the patients may proceed and necessitate hospitalisation and increased medical support. The mortality rate for the severe patients is around 13.4% [4]. Therefore, risk assessment of patients preferably in a quantitative, non-subjective way, is extremely important for patient management and medical resource allocation. General quarantine and symptomatic treatment at home or mobile hospital can be used for most non-severe patients, while a higher level of care and fast track to the intensive care unit (ICU) is needed for severe patients. Previous studies have summaried the clinical and radiological characteristics of severe COVID-19 patients, while the prognostic value of different variables is still unclear [5, 6].
Several scoring systems that are in common clinical use (e.g. Sequential Organ Failure Assessment score, Confusion-Urea-Respiratory rate-Blood pressure-Age 65, Acute Physiology and Chronic Health Evaluation, etc.) could be applied to the triage problem, albeit each with their own problems and limitations, such as the need for laboratory variables that are hard to obtain at hospital admission [7]. The pneumonia severity index (PSI) stands out as it is used to assess the probability of severity and mortality among adult patients with community-acquired pneumonia and to help hospitaliation management [8].
A better solution could possibly be found using machine-learning, a branch of artificial intelligence that learns from past data in order to build a prognostic model [9]. In recent years, machine learning has been developed as a useful tool to analyse large amounts of data from medical records or images [10]. Previous modelling studies focused on forecasting the potential international spread of COVID-19 [11].
Therefore, our objective is to develop and validate a prognostic machine-learning model based on clinical, laboratory, and radiological variables of COVID-19 patients at hospital admission for severity risk assessment during hospitalisation, and compare the performance with that of PSI as a representative clinical assessment method. Our ambition is to develop a multifactorial decision support system with different datasets to facilitate risk prediction and triage (home or mobile hospital quarantine, hospitalisation, or ICU) of the patient at hospital admission.
Methods
Patients
The institutional review board approved this study (2020-71), which followed the Standards for Reporting of Diagnostic Accuracy Studies statement [12], and the requirement for written informed consent was waived. 299 adult confirmed COVID-19 patients from the central hospital of Wuhan were included consecutively and retrospectively between December 23, 2019 and February 13, 2020. The inclusion criteria were: 1) patients with a confirmed COVID-19 disease, 2) patients present at hospital for admission. The exclusion criteria were: 1) patients already with a severe illness at hospital admission; 2) time interval>2 days between admission and examinations; and 3) no data available or delayed results as described below. The patients included from this center were divided into two datasets according to the entrance time of hospitalisation, 80% for training (239 patients from December 23, 2019, to January 28, 2020) and 20% for internal validation (60 patients from January 29 to February 13, 2020). The five test datasets were collected between February 20, 2020 and March 31, 2020 from other eight centers (Supplementary) in China, Italy, and Belgium under the same inclusion and exclusion criteria (fig. 1).
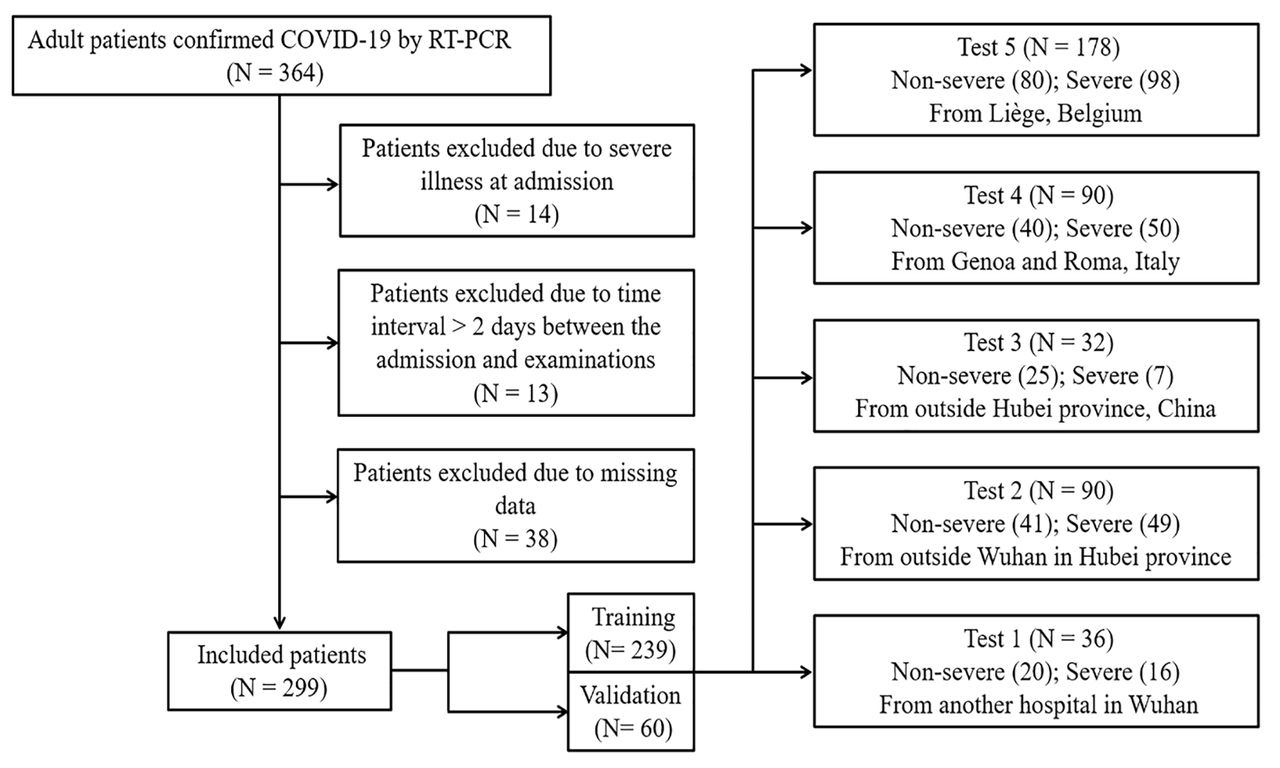
Flowchart of the patient selection process.
Patients were labelled as having a “severe disease” if at least one of the following criteria were met during hospitalisation [6, 13]: (a) respiratory failure requiring mechanical ventilation; (b) shock; (c) ICU admission; (d)organ failure; or (e) death. Patients were labelled as having a “non-severe disease” if none of the above-mentioned criteria were met during the whole hospitalisation process until deemed recovered and discharged from the hospital.
Data collection
Clinical, laboratory, radiological characteristics and outcome data were obtained in the case record form shared by the International Severe Acute Respiratory and Emerging Infection Consortium from the electronic medical records [14]. A confirmed case with COVID-19 was defined as a positive result of high-throughput sequencing or real-time reverse-transcriptase polymerase-chain-reaction assay for nasal and pharyngeal swab specimens. After consultation with respiratory specialists and review of the recent COVID-19 literature, a set of clinical, laboratory, and radiological characteristics was identified and the data collected from the electronic medical system. The clinical characteristics included basic information (5 variables), comorbidities (11 variables), and symptoms (13 variables). All clinical characteristics were obtained when the patients were admitted to hospital for the first time. 42 laboratory results were recorded, including complete blood count, white blood cell differential count, D-dimer, C-reactive protein (CRP), cardiac enzymes, procalcitonin, liver function test, kidney function test, B-type natriuretic peptide and electrolyte test. The arterial blood gas was not taken into account due to missing data for most early-stage patients. The metric conversion of laboratory results was performed using an online conversion table [15]. A detailed list of variables can be found in tables 1 and 2.
Clinical characteristics and radiological findings of patients confirmed with COVID-19
Laboratory results of patients with COVID-19 at hospital admission
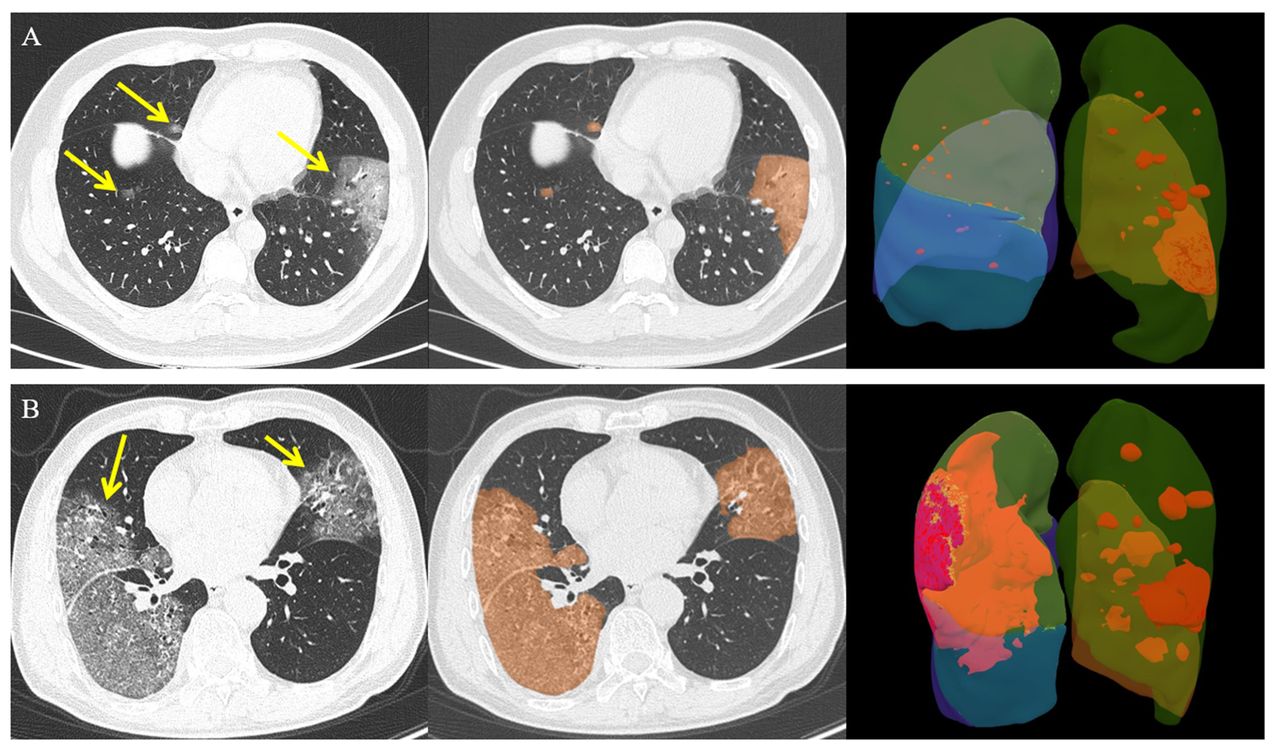
The semantic CT characteristics (including ground-glass opacity, consolidation, vascular enlargement, air bronchogram, and lesion range score) were independently evaluated on all datasets by two radiologists (PY [a radiologist with 5 years’ experience in chest CT images] and YX [a radiologist with 20 years’ experience in chest CT images]), who were blinded to clinical and laboratory results. Any disagreement was resolved by a consensus read. Lesion range was identified as areas of ground-glass opacity or consolidation and was graded with a 6-point scale according to the lesion volume proportion in each single lobe: 0=no lung parenchyma involved, 1=up to 5% of lung parenchyma involved, 2=5–25%, 3=26–50%, 4=51–75%, and 5=76–100% of lung parenchyma involved. The lesion volume proportion was automatically calculated by Shukun Technology Pneumonia Assisted Diagnosis System (Version 1.17.0), and the final score is a total score from five lobes (fig. 2). Detailed CT acquisition and reconstruction parameters are presented in the Supplementary.

Chest CT images of two patients with COVID-19 pneumonia. a) 48 year-old man, the focal ground-glass opacities in the bilateral lung lobes (yellow arrow) were automatically segmented (orange areas) and calculated the lesion volume in each lobe (right superior lobe: 0.2%, right middle lobe: 0.3%, right inferior lobe: 0.1%, left superior lobe: 0.9%, and left inferior lobe: 9.4%). The lesion range score was 6 (1+1+1+1+2). b) 70 year-old man, the peripheral ground-glass opacities in the bilateral lung lobes (yellow arrow)were automatically segmented (orange areas) and calculated the lesion volume in each lobe (right superior lobe: 32.1%, right middle lobe: 16.4%, right inferior lobe: 62.7%, left superior lobe: 12.8%, and left inferior lobe: 7.3%). The lesion range score was 13 (3+2+4+2+2).
Feature selection and modelling
All feature selection and model training were performed in the training dataset alone to prevent information leakage. An overview of the functions used is given in Supplementary Table S1. In order to reduce feature dimensionality, features showing high pairwise Spearman correlation (r>0.8) and the highest mean correlation with all remaining features were removed, followed by application of the Boruta algorithm to select important features [16]. The Boruta algorithm combines feature rank based on the random forest classification algorithm and selection frequency based on multiple iterations of the feature selection procedure. Recursive feature elimination based on bagged tree models with a cross-validation technique (10 folds, 10 times) was performed to select the best performing combination of features. In order to balance the positive and negative sample size, an adaptive synthetic sampling approach for imbalanced learning (ADASYN) was used during feature selection and modelling [17]. The feature selection process was used for clinical, laboratory, and CT semantic models alone, and in combination.
Logistic regression models based on selected features were trained and the validation dataset was used to internally validate the prognostic performance of the models. Four models were trained: Model 1 contained only baseline clinical features without symptoms; Model 2 used all selected clinical features; Model 3 used selected semantic CT features, age, and sex; Model 4 employed all selected clinical, laboratory, and CT features.
The prognostic performances of the best model were compared with other models on the training dataset, due to a bigger sample size. The performance of the best model and PSI scoring were gauged on the datasets via the receiver operator characteristic (ROC) and confusion matrix. In order to gauge the level of overfitting, the outcomes were randomised on the best model and the entire process repeated, from feature selection to model building and evaluation.
The patients from the training datasets were divided into low, medium and high risk according to the first quartile (25th percentile) and the third quartile (75th percentile) of probabilities from the best performing model. Nomograms and on-line calculators were used to provide the interpretability of the best trained models. The test datasets were used to gauge the prognostic performance and the validity for the best model.
Statistical analysis
Baseline data were summarised as median, and categorical variables as frequency (%). Differences between the severe group and the non-severe group were tested using the Mann-Whitney test for continuous data and Fisher's exact test for categorical data. Feature correlations were measured using the Spearman correlation coefficient. We determined the area under the ROC curve (AUC) with its 95% confidence interval (CI) and tested AUC difference between Models 1–3 and Model 4 by the DeLong method [18], measures of prognostic performance included the AUC, and metrics derived from the confusion matrix - accuracy, sensitivity, specificity, positive prediction value (PPV), and negative prediction value (NPV). A calibration-plot based on the Hosmer-Lemeshow test was used to estimate the goodness-of-fit and consistency of the model on the test datasets. All p values were two-sided, and p<0.05 was regarded as significant. All statistical analyses, modelling, and plotting were performed in R (version 3.5.3), and the detailed package characteristics are listed in Supplementary Table S1.
Results
Demographic and Clinical characteristics
Of 299 hospitalised COVID-19 patients in retrospective cohort, the median age was 50.0 years (interquartile range, 35.5–63.0; range, 20–94 years) and 137 (45.8%) were men. All the clinical characteristics and CT findings are summarised in table 1, and more details of laboratory findings can be seen in table 2. Of 426 hospitalised COVID-19 patients in 5 cohorts as test datasets, the median age was 62.0 years (interquartile range, 50.0–72.0; range, 19–94 years) and 236 (55.4%) were men.
Feature selection
Among the clinical features, age, hospital employment, body temperature, and the time of onset to admission were selected. Lymphocyte (proportion), neutrophil, (proportion), CRP, lactate dehydrogenas (LDH), creatine kinase (CK), urea, and calcium were selected from the laboratory feature set. Only the lesion range score was selected from CT semantic features. When putting these three category features together to select features, age, Lymphocyte (proportion), CRP, LDH, CK, urea and calcium were finally included in the combination model.
Models performance in the training and validation dataset
Model performance was as follows. The Model 1 based on age and hospital employment showed an AUC of 0.74 (95% CI, 0.69–0.79) on the training dataset and an AUC of 0.83 (95% CI, 0.72–0.94) on the validation dataset. The Model 2 with the clinical features of age hospital employment, body temperature, and the time of onset yield an AUC of 0.78 (95% CI, 0.73–0.83) on the training dataset and an AUC of 0.74 (95% CI, 0.59–0.89) on the validation dataset. The Model 3 based on age and lesion range score on CT, had an AUC of 0.75 (95% CI, 0.70–0.80) on the training dataset and an AUC of 0.83 (95% CI, 0.72–0.94) on the validation dataset.
When pooling these three categories of features, the combination model (Model 4) selected 7 features (age, lymphocyte [proportion], CRP, LDH, CK, urea, and calcium), which achieved the highest AUC of 0.86 (95% CI, 0.82–0.90) on the training dataset and an AUC of 0.90 (95% CI, 0.82–0.98) on the validation dataset. The AUC value of Model 4 was significantly higher than Model 1 (p=0.001), Model 2 (p=0.033), and Model 3 (p=0.003) on the training dataset. The cut-off values from reclassification of low, medium, and high-risk probabilities were 0.21 and 0.80.
External validation
Model 4 was validated on the five test datasets, which showed AUCs ranging from 0.84 to 0.93 with accuracies ranging from 74.4% to 87.5%, sensitivities ranging from 75.0% to 96.9%, specificities ranging from 57.5% to 88.0%, PPVs ranging from 71.4% to 84.1%, and NPVs ranging from 73.9% to 93.9% (table 3). The ROC, confusion-matrix, and calibration plots are shown in fig. 3. The results of randomising the outcomes and re-running the analysis yielded AUC of 0.50 (95% CI, 0.44–0.55) for the Model 4.
The prognostic performance of the combination model (Model 4) on five test datasets

The receiver operator characteristic curve, confusion matrix, and calibration curve for the test datasets.
Clinical use
Based on the selected features from the best models, a nomogram was established to quantitatively assess the severity risk of illness (fig. 4). The developed online-calculators can be found at www.covid19risk.ai. Compared to PSI scoring, Model 4 showed higher AUCs, accuracies, sensitivities, and NPVs on the five test datasets (table 3). There were significant difference for the proportion of severe patients among low, medium, and high-risk groups in the five test datasets (fig. 5).

Severe-illness risk nomogram and triage tool for clinicians.

A histogram plot of the proportion of severe patients in low, medium, and high-risk groups of the test datasets.
Discussion
This international multicenter study analysed individually and in combination, clinical, laboratory and radiological characteristics for COVID-19 patients at hospital admission, to retrospectively develop and prospectively validate a prognostic model and tool to assess the severity of the illness, and its progression, and to compare these with PSI scoring. We found that COVID-19 patients that developed a severe illness were often of an advanced age, accompanied by multiple comorbidities, presenting with chest tightness, and had abnormal laboratory results and broader lesion range on lung CT on admission. Using simpler linear regression models yielded better prognostic performance than PSI scoring in the test datasets. We believe these models could be useful for risk assessment and triage.
Previous studies have reported that age and underlying comorbidities (such as hypertension, diabetes, and cardiovascular diseases) may be risk factors for the COVID-19 patients requiring intensive care unit (ICU) [19, 20]. In this study, we found that the elderly COVID-19 patients who were male, non-hospital staff, suffering from hypertension, diabetes, cardiopathy disease, chronic obstructive pulmonary disease, cerebrovascular disease, renal disease, hepatitis B virus infection, lower body temperature, and chest tightness were more vulnerable to develop a severe illness in the early stages of the disease. Among these features, age, hospital staff, body temperature, and the time of onset to admission had certain prognostic abilities. Age was the most important feature, which may interact with other features, which was why only age was selected into our combination model (Model 4) from these features. Zhou and colleagues have confirmed that SARS-CoV-2 uses the same cell entry receptor (angiotensin-converting enzyme II [ACE2]) with SARS-CoV [21]. However, whether COVID-19 patients with hypertension and diabetes have higher severe illness risk, which is due to treatment with ACE2- increasing drugs is still unknown [22]. Hospital staff had a lower risk of progression, possibly due lower age, higher levels of education, and more medical knowledge once infected although the unbalanced nature of this type of data has to be taken into account.
Furthermore, early studies have shown that COVID-19 patients with severe illness had more laboratory abnormalities such as CRP, D-dimer, lymphocyte, neutrophil, and LDH, than those patients with non-severe illness, which were associated with the prognosis [19, 20, 23]. In our study, we also found that the severe group had numerous laboratory abnormalities in complete blood cell count, white cell differential count, D-dimer, CRP, liver function, renal function, procalcitonin, B-type natriuretic peptides, and electrolytes. Among these abnormalities, lymphocyte proportion, neutrophil proportion, CRP, LDH, CK, urea, and calcium were significant prognostic factors, which suggest that COVID-19 may cause damage to multiple organ systems when developing into a severe illness. However, current pathological findings of COVID-19 suggest that there is no evidence that SARS-CoV-2 can directly impair the other organs such as liver, kidney and heart [24].
Current reports have shown that thin-slice chest CT is a powerful tool in clinical diagnosis due to the high sensitivity and the ability to monitor the development of the disease [25, 26]. In addition, a previous study reported that ground-glass opacity and consolidation were the most common CT findings for COVID-19 patients with pneumonia, while being nonspecific [27]. Clinical observations showed that there were significantly more consolidation lesions in ICU patients on admission, while more ground-glass opacity lesions were observed in non-ICU patients [28]. In our study, we found that vascular enlargement, air-bronchogram, and lesion range score differ significantly between non-severe and severe groups. Among these features, only the lesion range score had prognostic power, but not enough to be selected for the combination model. This indicates that while these early stage CT semantic features could have diagnostic value, they have limited ability to prognose the onset of severe illness in COVID-19 patients.
The Chinese National Health Committee added some warning indicators for severe or critical cases in the updated diagnosis and treatment plan for COVID-19 patients (version 7) [29], which includes progressive reduction of peripheral blood lymphocytes, a progressive increase of IL-6, CRP and lactate, and rapid progression of lung CT findings in a short period. In this study, we used age, lymphocyte fraction, CRP, LDH, CK, urea, and calcium scores from clinical, laboratory, and radiological exams recorded at hospital admission to train a model for the prediction of the onset of severe illness. Our model combining these features from multiple sources showed a favorable performance when validated in the five external datasets from China, Italy, and Belgium. In addition, the model is able to stratify COVID-19 patients into low, medium, and high-risk groups for developing severe illness. We propose that this model with its higher prediction performance and simplicity than PSI score could be used for a preliminary screening and triage tool at hospital admission for the potential to develop severe illness. Furthermore, the model could be used for the selection and/or stratification of patients in clinical trials in order to homogenise the patient population. Follow-up laboratory tests are needed to assess the severity risk with a higher accuracy.
As one of the coronaviruses family infecting humans, SARS-CoV-2 has similar etiologic, clinical, radiological and pathological features to those of severe acute respiratory syndrome coronavirus and Middle East respiratory syndrome coronavirus [23, 30, 31]. Therefore, we believe that developing a reliable early warning model based on presently clinical, radiological, and pathological data is necessary for current outbreaks and possible future outbreaks of coronaviruses.
Our study has several limitations. First, selection bias is unavoidable and the limited and unbalanced sample size. Second, patients from different races and ethnicities may have diverse clinical and laboratory results, and the self-medication of patients before admission may affect the clinical and laboratory results. Third, the threshold to go to the hospital and hospitalisation management can vary from country to country, we are also aware that RNA viruses can mutate rapidly and that could have an impact of the performance of the models. We therefore propose that those models should be continuously updated to achieve a better performance for example using privacy-preserving distributed learning approaches [32, 33]. Fourth, the CT features used for this study are semantic features from the first CT scan, and radiomics or deep learning approaches may improve its prognostic performance, and follow-up CT scan may yield more information. Fifth, due to the large number of predictors included in the analysis, and the complexity of feature selection and modelling, overfitting is always possible. We have mitigated this with the use of external validation cohorts, and by rerunning the analysis on randomised outcomes to arrive at a “chance” (AUC=0.5) result.
Conclusions
Elderly COVID-19 patients and non-hospital staff seem more vulnerable to develop a severe illness after hospitalisation as per defining criteria, which can cause a wide range of laboratory and CT anomalies. Furthermore, our model based on lactate dehydrogenase, C-reactive protein, calcium, age, lymphocyte proportion, urea, and creatine kinase might be a more useful preliminary screening and triage tool than pneumonia severity index for risk assessment of COVID-19 patients at hospital admission.
Footnotes
Author Contributors: G. Wu, P. Yang, Y. Xie, X. Wang, and P. Lambin conceived and designed the study. G. Wu and P. Yang contributed to the literature search. P. Yang, X. Rao, J. Li, J. Li, D. Du, S. Zhao, Y. Ding, B. Liu, W. Sun, F. Albarello, A. D'Abramo, V. Schininà, E. Nicastri, J. Wu, M. Occhipinti, G. Barisione, E. Barisione, J. Guiot, A. Frix, M. Moutschen, R. Louis, P. Lovinfosse, and C. Yan contributed to data collection. G. Wu, H. Woodruff, and P. Lambin contributed to data analysis. G. Wu, H. Woodruff, and P. Lambin contributed to data interpretation. G. Wu and C. Yan contributed to the tables and figures. G. Wu, I Halilaj, and P. Lambin contributed to build a website. G. Wu, P. Yang, H. Woodruff, and P. Lambin contributed to writing of the report.
Support statement: This work was supported from ERC advanced grant (ERC-ADG-2015, n° 694812 - Hypoximmuno), European Program H2020 (ImmunoSABR - n° 733008, PREDICT - ITN - n° 766276, CHAIMELEON - n° 952172, EuCanImage – n° 952103), TRANSCAN Joint Transnational Call 2016 (JTC2016 “CLEARLY”- n° UM 2017–8295), China Scholarships Council (n° 201808210318), and Interreg V-A Euregio Meuse-Rhine (“Euradiomics” - n° EMR4). This work was supported by the Dutch Cancer Society (KWF Kankerbestrijding), Project number 12085/2018–2. H2020 European Research Council; DOI: http://dx.doi.org/10.13039/100010663; Grant: ImmunoSABR - n° 733008, PREDICT - ITN - n° 76627; Euradiomics; Grant: EMR4; China Scholarship Council; DOI: http://dx.doi.org/10.13039/501100004543; Grant: 201808210318; ERC advanced grant; Grant: 694812 - Hypoximmuno.
This article has supplementary material available from erj.ersjournals.com
Role of the Funder/Sponsor: The funders had no role in the design and conduct of the study; collection, management, analysis, and interpretation of the data; preparation, review, or approval of the manuscript; and decision to submit the manuscript for publication.
Conflict of interest: Dr. Wu has nothing to disclose.
Conflict of interest: Dr. Yang has nothing to disclose.
Conflict of interest: Dr. Xie has nothing to disclose.
Conflict of interest: Dr. Woodruff reports other from Oncoradiomics, outside the submitted work;.
Conflict of interest: Dr. Rao has nothing to disclose.
Conflict of interest: Dr. Guiot has nothing to disclose.
Conflict of interest: Dr. Frix has nothing to disclose.
Conflict of interest: Dr. Louis has nothing to disclose.
Conflict of interest: Dr. Moutschen has nothing to disclose.
Conflict of interest: Dr. Li has nothing to disclose.
Conflict of interest: Dr. Li has nothing to disclose.
Conflict of interest: Dr. Yan has nothing to disclose.
Conflict of interest: Dr. Du has nothing to disclose.
Conflict of interest: Dr. Zhao has nothing to disclose.
Conflict of interest: Dr. Ding has nothing to disclose.
Conflict of interest: Dr. Liu has nothing to disclose.
Conflict of interest: Dr. Sun has nothing to disclose.
Conflict of interest: Dr. Albarello has nothing to disclose.
Conflict of interest: Dr. D'Abramo has nothing to disclose.
Conflict of interest: Dr. Schininà has nothing to disclose.
Conflict of interest: Dr. Nicastri has nothing to disclose.
Conflict of interest: Dr. Occhipinti reports grants from Menarini Foundation and Novartis, outside the submitted work;.
Conflict of interest: Dr. Barisione has nothing to disclose.
Conflict of interest: Dr. Barisione has nothing to disclose.
Conflict of interest: Dr. Halilaj has nothing to disclose.
Conflict of interest: Dr. Lovinfosse has nothing to disclose.
Conflict of interest: Dr. Wang has nothing to disclose.
Conflict of interest: Dr. Wu has nothing to disclose.
Conflict of interest: Dr. Lambin reports other from The Medical Cloud Company, during the conduct of the study; grants from Varian medical, grants from Oncoradiomics, grants from ptTheragnostic/DNAmito, grants from Health Innovation Ventures, personal fees from Oncoradiomics, personal fees from BHV, personal fees from Varian, personal fees from Elekta, personal fees from ptTheragnostic, personal fees from Convert pharmaceuticals, outside the submitted work; In addition, Dr. Lambin has a patent PCT/NL2014/050248 licensed, a patent PCT/NL2014/050728 licensed, a patent PCT/EP2014/059089 licensed, a patent N2024482 pending, a patent N2024889 pending, and a patent N2024889 pending.
- Received April 9, 2020.
- Accepted June 11, 2020.
- Copyright ©ERS 2020
This article is open access and distributed under the terms of the Creative Commons Attribution Non-Commercial Licence 4.0.
References


