


Additional Files
Supplementary material
Please note: supplementary material is not edited by the Editorial Office, and is uploaded as it has been supplied by the author.
Files in this Data Supplement:
- Table S1 - Intravenous antibiotic usage, standard microbiological cultures and sensitivity testing results
- Table S2 - Demographics, lung function and antibiotic treatment of individual patients
- Table S3 - Taxonomic classification of 16s rDNA reads
- Figure S1 - Scatterplot matrix visualizing pairwise correlations between bacterial community diversity and composition, as well as subject demographics. The diagonal of the matrix lists the variables (grey boxes) compared in the scatterplots. Variables considered were FEV1, age, Shannon diversity and relative abundance of the most abundant bacterial genera. Each panel in the matrix contains a scatterplot for a pair of variables. Each dot in the scatterplots corresponds to the measurements of the variable for an individual subject and is coloured according to the hierarchical cluster (H, M, L) assigned to the subject at TP-1 . The scatterplots in the upper triangle (above the diagonal) or lower triangle (below the diagonal) illustrate the relationships of the variables at TP-1 and TP-3, respectively. The relationship between the relative abundance of Pseudomonas and microbial diversity was negatively correlated (Pearson, r=-0.87, p<0.01). A positive correlation was seen between microbial diversity and Streptococcocus (r=0.63, p<0.01) and Prevotella (r=0.6, p=0.01).
- Figure S2 - Scatterplot matrix visualizing pairwise correlations of variables participant demographics and change in microbial composition between TP-1 and TP3. The diagonal of the matrix lists the variables (grey box) that were compared in the scatterplots. Variables included were; improvement in FEV1, age, change in Shannon diversity and change in relative abundance of selected bacterial genera. The change was determined by calculating the difference of the Shannon diversity or relative abundance of the genus between TP-1 and TP-3. Each dot in the scatterplots corresponds to the measurements of the variable for an individual subject and is coloured according to the hierarchical clustered (H, M, L) assigned to the subject at TP-1. The change in microbial diversity demonstrated a negative correlation with the relative abundance of Pseudomonas (Pearson, r=-0.76, p<0.001) and a positive correlation with the relative abundance of Streptococcus (r=0.6, p=0.01).
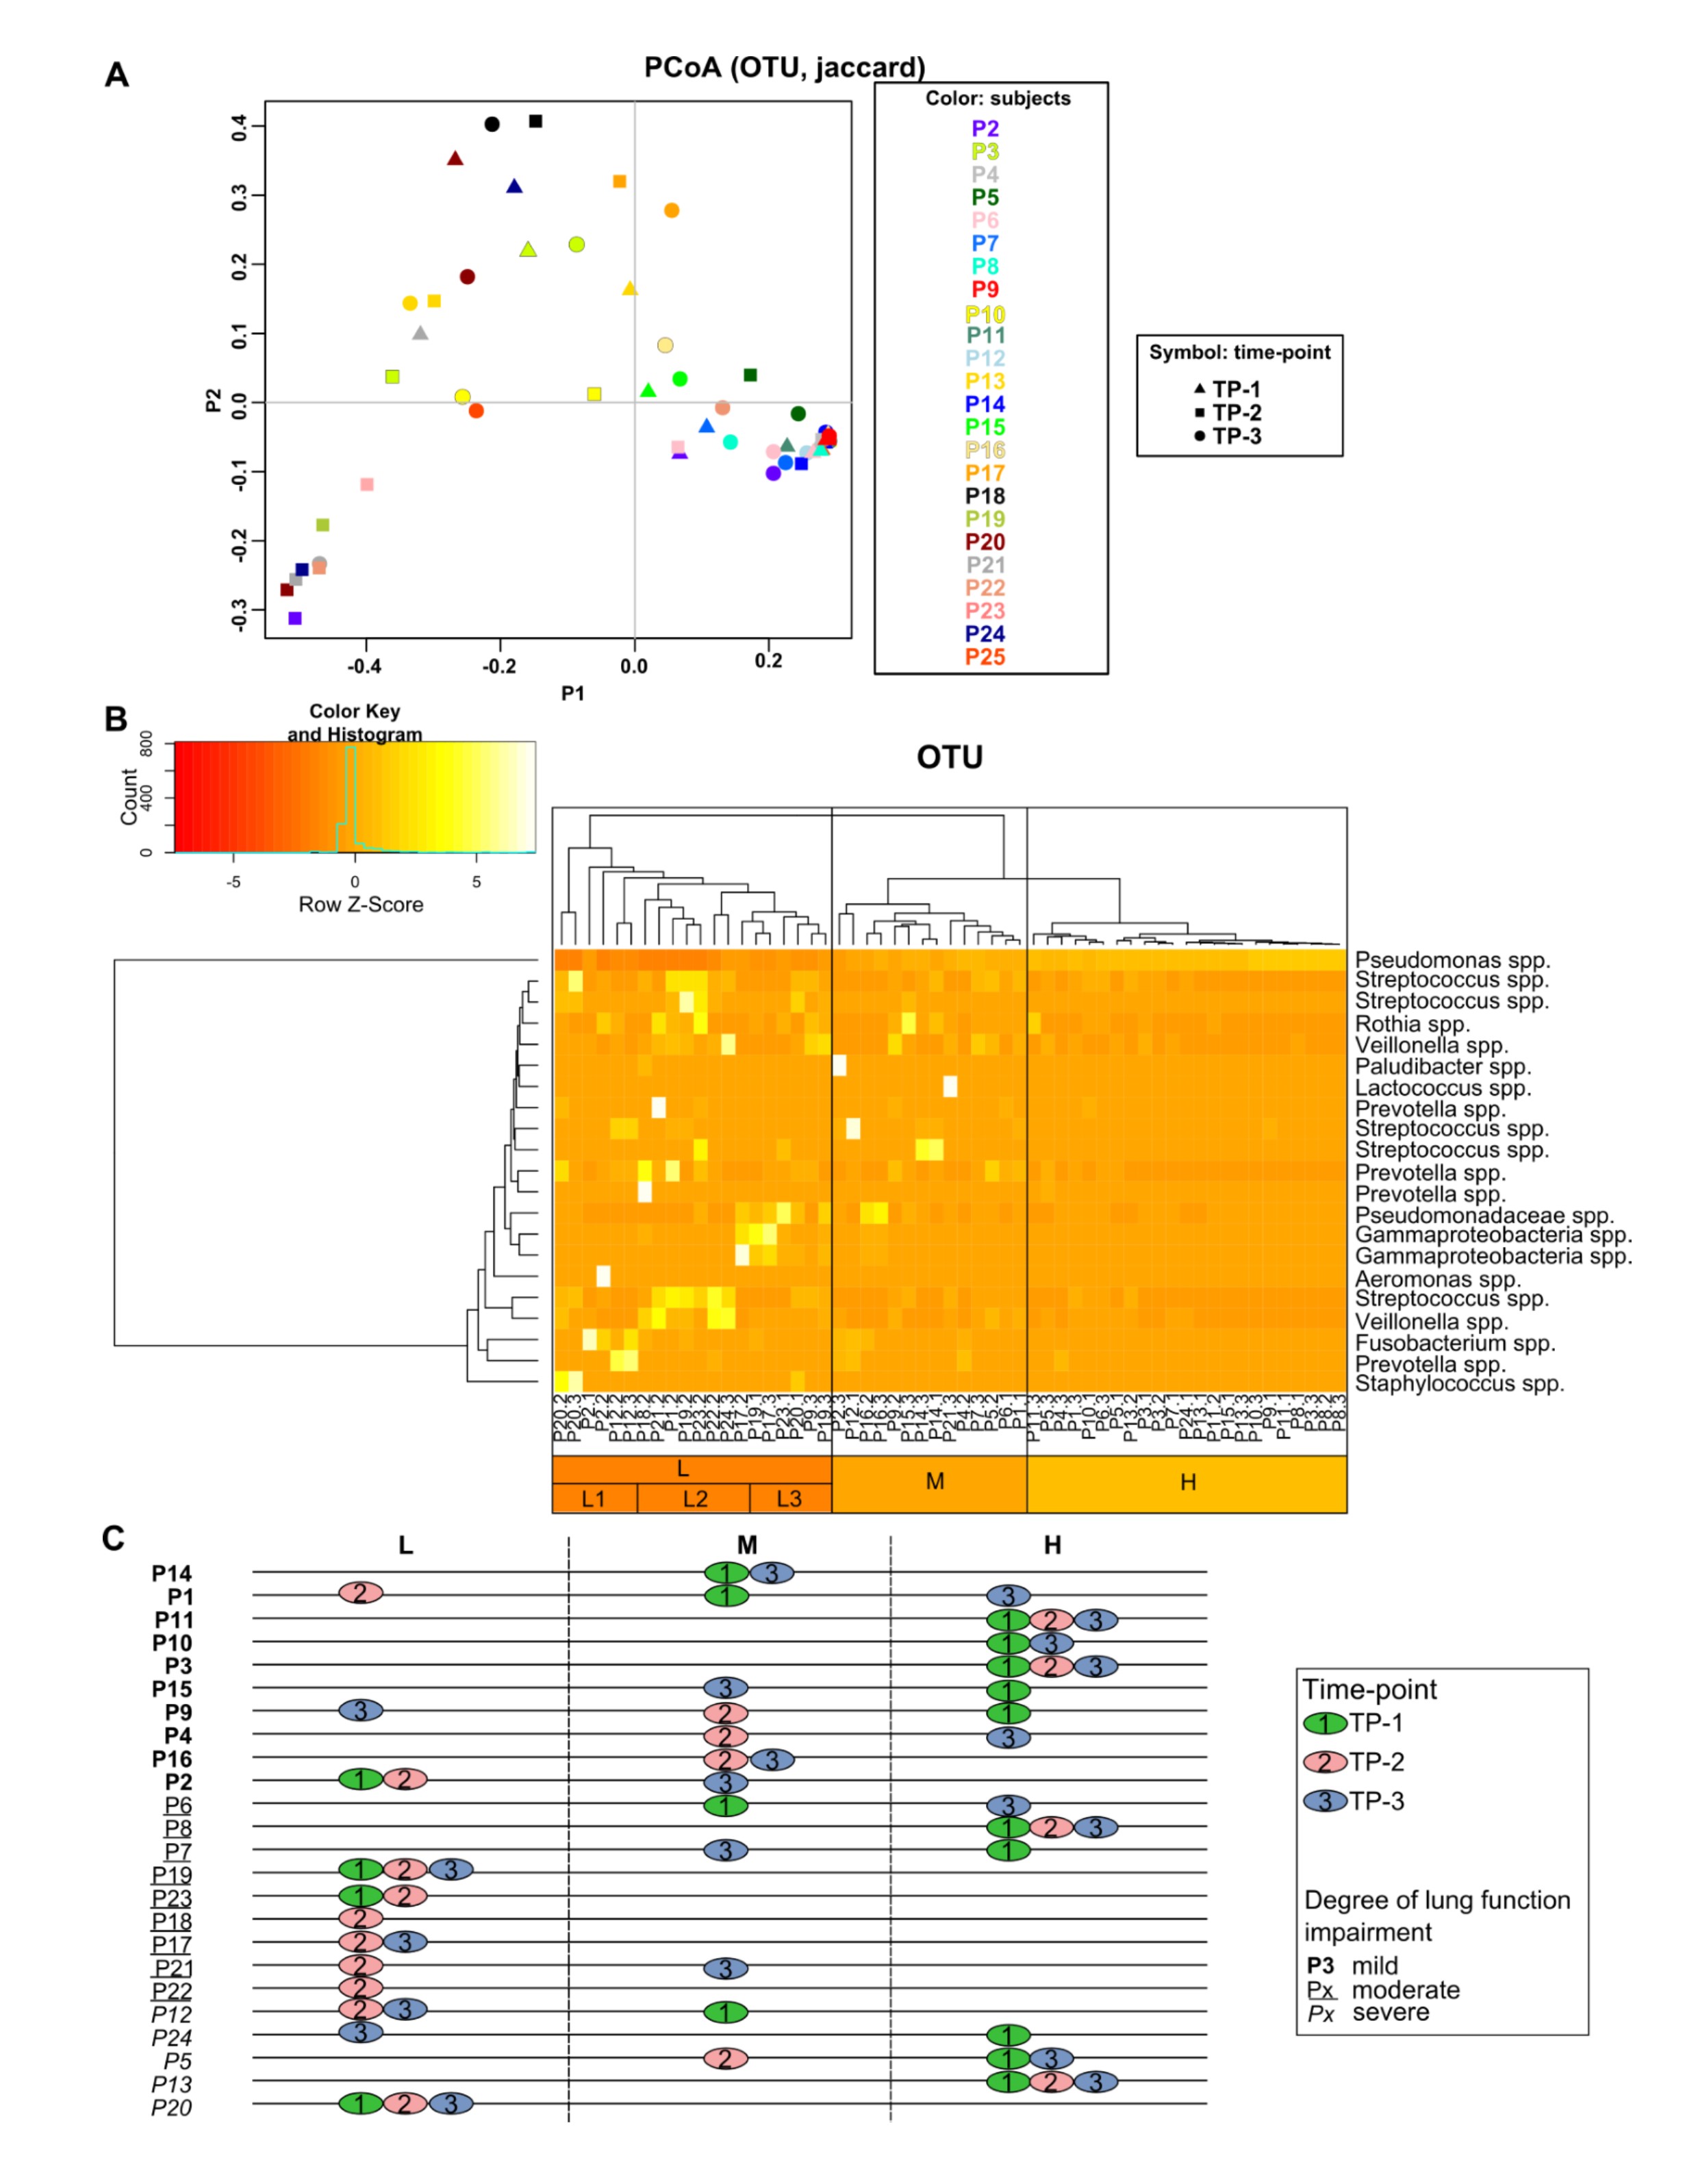
- Figure S3 - PCoA (A) and hierarchical clustering of CF sputum samples based on OTU profiles (B) and categorization of subjects according to identified sputum microbiota groups (C). A. PCoA of the sputum microbiome showing a shift in the microbiota at TP-2 (rectangle). TP-1 (triangle) and TP-3 (circle) for some subjects clustered together indicating a return to the initial community composition. B. Only OTUs that had a relative abundance >10% in at least one sample are shown. Hierarchical clustering demonstrated grouping of samples based on the abundance of OTUs related to Pseudomonas spp: (L) Mixed community consisting of low levels of Pseudomonas and presence of several other bacterial groups, (M) Intermediate abundance of Pseudomonas and only minor other bacterial groups, (H) Pseudomonas-dominated samples. Group L can further be subdivided according to the prevalence of Staphylococcus and Fusobacterium (L1), Streptococcus (L2) and other unknown Gammaproteobacteria species (L3). C. The time-point (TP-1: green, TP-2: red, TP-3: blue) of the samples for each subject is categorized according to the groupings retrieved from hierarchical clustering. Subjects are stratified by order of the degree of lung function impairment (FEV1 percentage predicted), with most severe impairment at the bottom and least severe at the top (Px: mild, Px: moderate, Px: severe lung function impairment). Samples from subjects with a severe CF lung function impairment tended to cluster in group H or M, whereas samples from subjects with mild-moderate impairment clustered in the L group. The microbial diversity (Shannon index) of samples by hierarchical cluster is presented in Supplementary Figure 5.
- Figure S4 - Pearson's correlation demonstrating the relationship between the relative abundance of Pseudomonas (genus) and P. aeruginosa colony forming units (CFU) per gram of sputum, determined by RT-qPCR.
- Figure S5 - Community diversity (Shannon index) of samples by hierarchical clustering group. The greatest diversity is seen in the L group, with low diversity seen in the H group.
- Figure S6 - Relative abundance of, A. aerobic and, B. anaerobic bacteria for each CF subject. The colour indicates the hierarchical clustering group of the subjects at time-point 1 (red: group H, orange: group M, green: group H, grey: unknown [no sample at time-point 1])
Disclosures
Files in this Data Supplement:
Vol 63 Issue 4
Table of Contents

Pyrosequencing reveals transient cystic fibrosis lung microbiome changes with intravenous antibiotics


