


Figures
- FIGURE 1
Flow diagram illustrating the number of pupils included and excluded from the cohort at each stage of data cleaning. CHI: Community Health Index; SMR: Scottish Morbidity Record; P1–P7: first year through to seventh year of primary (elementary) school; S1–S6: first year through to sixth year of secondary (high) school. The CHI database contains CHI numbers (unique identifiers used on health records) and identifiers for patients registered with a general practitioner.
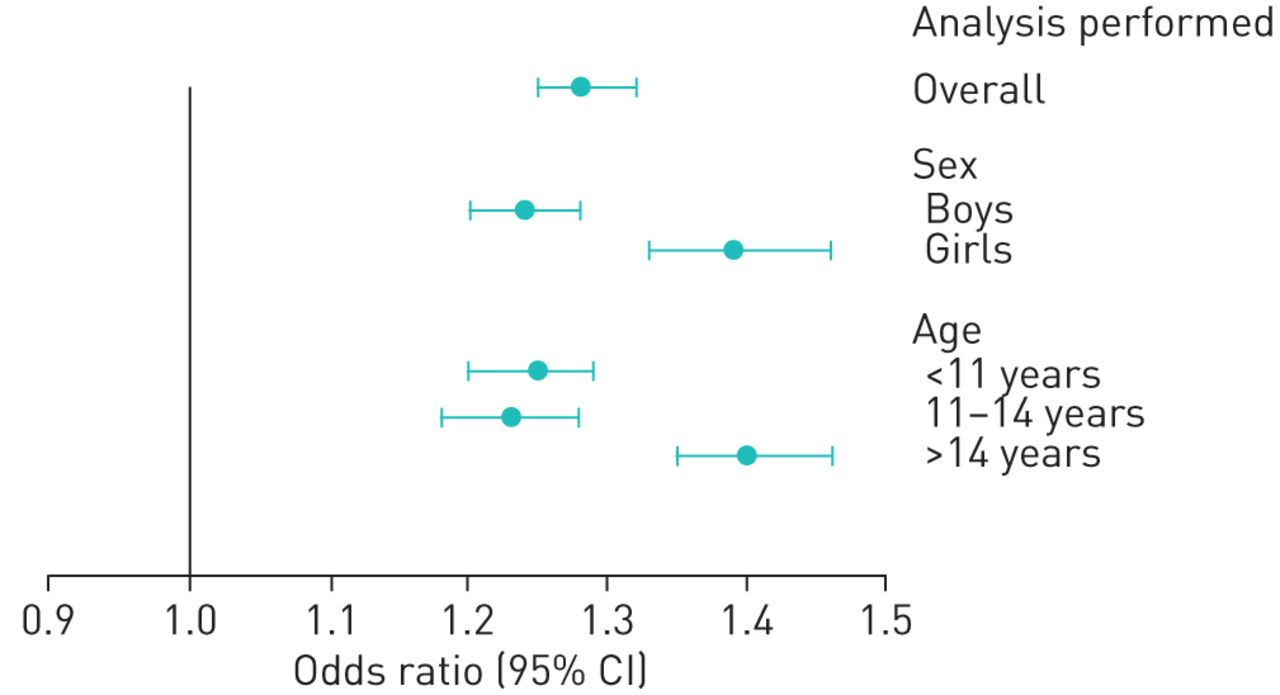
- FIGURE 2
Forest plot of the association between treatment for asthma and special educational need by sex and age. Adjusted for age, sex, deprivation quintile, ethnic group, maternal age, maternal smoking, parity, mode of delivery, gestation at delivery, sex- gestation-specific birthweight centile and 5-min Apgar score.
- FIGURE 3
Poisson piecewise regression model of the risk of hospitalisation over 5 years follow-up from first record of treatment: a) any-cause hospitalisation and b) respiratory hospitalisation by sex. IRR: incidence rate ratio. Adjusted for age, sex, deprivation quintile, ethnic group, maternal age, maternal smoking, parity, mode of delivery, gestation at delivery, sex-gestation-specific birthweight centile and 5-min Apgar score.


Tables
- TABLE 1
Characteristics of schoolchildren by presence or not of treated asthma
No asthma Asthma p-value Subjects 637 816 45 900 Sociodemographic factors Sex Male 318 360 (49.9) 26 806 (58.4) <0.001 Female 319 456 (50.1) 19 094 (41.6) Missing 0 0 Deprivation quintile 1 (most deprived) 141 585 (22.2) 12 357 (26.9) <0.001 2 126 279 (19.8) 9941 (21.7) 3 122 827 (19.3) 8917 (19.4) 4 126 335 (19.8) 7985 (17.4) 5 (least deprived) 120 288 (18.9) 6667 (14.5) Missing 502 33 Ethnic group White 606 601 (96.3) 43 388 (95.5) <0.001 Asian 14 222 (2.3) 1364 (3.0) Black 1634 (0.3) 126 (0.3) Mixed 5471 (0.9) 439 (1.0) Other 1732 (0.3) 125 (0.3) Missing 8156 458 Maternity factors Maternal age years ≤24 171 602 (26.9) 13 868 (30.2) <0.001 25–29 187 171 (29.4) 13 516 (29.5) 30–34 182 432 (28.6) 12 209 (26.6) ≥35 96 600 (15.2) 6307 (13.7) Missing 11 0 Maternal smoking No 411 276 (72.8) 28 269 (69.2) <0.001 Yes 153 337 (27.2) 12 595 (30.8) Missing 73 203 5036 Parity 0 284 289 (44.8) 21 760 (47.7) <0.001 1 221 459 (34.9) 15 205 (33.3) >1 128 980 (20.3) 8673 (19.0) Missing 3088 262 Mode of delivery Spontaneous vaginal delivery 552 730 (67.8) 29 750 (62.4) <0.001 Assisted vaginal 75 713 (11.9) 5587 (2.4) Breech vaginal 1825 (0.3) 154 (12.2) Elective Caesarean section 48 267 (7.7) 3700 (0.3) Emergency Caesarean section 79 325 (12.4) 6700 (8.1) Other 141 (0.0) 9 (0.0) Missing 2 0 Gestation weeks <24 17 (0.0) 3 (0.0) <0.001 24–27 753 (0.1) 178 (0.4) 28–32 5338 (0.8) 719 (1.6) 33–36 28 351 (4.5) 2836 (6.2) 37 30 587 (4.8) 2613 (5.7) 38 79 248 (12.4) 6058 (13.2) 39 132 322 (20.8) 9448 (20.6) 40 193 364 (30.3) 13 103 (28.6) 41 143 715 (22.6) 9451 (20.6) 42 22 979 (3.6) 1416 (3.1) 43 542 (0.1) 32 (0.1) >43 120 (0.0) 9 (0.0) Missing 480 34 Sex-gestation-specific birthweight centile 1–3 25 763 (4.0) 2153 (4.7) <0.001 4–10 56 669 (8.9) 4308 (9.4) 11–20 75 633 (11.9) 5582 (12.2) 21–80 375 540 (59.0) 26 539 (57.9) 81–90 54 540 (8.6) 3758 (8.2) 91–97 34 407 (5.4) 2490 (5.4) 98–100 14 266 (2.2) 1000 (2.2) Missing 810 70 5-min Apgar score 1–3 3044 (0.5) 264 (0.6) <0.001 4–6 5864 (0.9) 565 (1.2) 7–10 622 502 (98.6) 44 568 (98.2) Missing 6406 503 Data are presented as n or n (%); percentages may not add up to 100 due to rounding.
- TABLE 2
Association between treatment for asthma and annual absenteeism by sex, age and area deprivation
Univariate IRR (95% CI) Multivariate# IRR (95% CI) Multivariate¶ IRR (95% CI) Overall 1.30 (1.28–1.31) 1.25 (1.24–1.26) 1.25 (1.24–1.26) Sex Boys 1.28 (1.27–1.30) 1.24 (1.23–1.26) 1.25 (1.23–1.26) Girls 1.32 (1.30–1.35) 1.26 (1.24–1.28) 1.26 (1.24–1.28) Age <11 years 1.38 (1.36–1.40) 1.32 (1.31–1.34) 1.32 (1.30–1.33) 11–14 years 1.29 (1.26–1.31) 1.24 (1.22–1.26) 1.26 (1.24–1.28) >14 years 1.17 (1.15–1.19) 1.14 (1.12–1.16) 1.15 (1.13–1.17) Area deprivation 1 (most deprived) 1.19 (1.17–1.21) 1.19 (1.17–1.21) 1.21 (1.19–1.23) 2 1.25 (1.23–1.28) 1.26 (1.23–1.28) 1.26 (1.23–1.28) 3 1.26 (1.24–1.29) 1.26 (1.23–1.29) 1.25 (1.23–1.28) 4 1.30 (1.27–1.33) 1.29 (1.26–1.32) 1.28 (1.25–1.31) 5 (least deprived) 1.32 (1.28–1.36) 1.31 (1.27–1.35) 1.29 (1.26–1.33) IRR: incidence rate ratio (the annual incidence in children treated for asthma divided by the annual incidence among children not treated for asthma). #: adjusted for age, sex, deprivation quintile and ethnic group (as appropriate); ¶: also adjusted for maternal age, maternal smoking, parity, mode of delivery, gestation at delivery, sex-gestation-specific birthweight centile and 5-min Apgar score.
Supplementary Material
This one-page PDF can be shared freely online.
Shareable PDF ERJ-02309-2018.Shareable


