


Figures
- FIGURE 1
Flow diagram for inclusion, randomisation and assessment of patients. Other reasons for non-inclusion were: noninvasive ventilation (NIV) refusal, NIV for pre-oxygenation, NIV interruption after a single session, legal impairment for inclusion, patient under the age of 18 and patient already included in the study. The primary outcome could not be assessed for some of the subjects as they were asleep under NIV after the first 30 min of therapy. ICU: intensive care unit; GCS: Glasgow Coma Scale; ARF: acute respiratory failure.
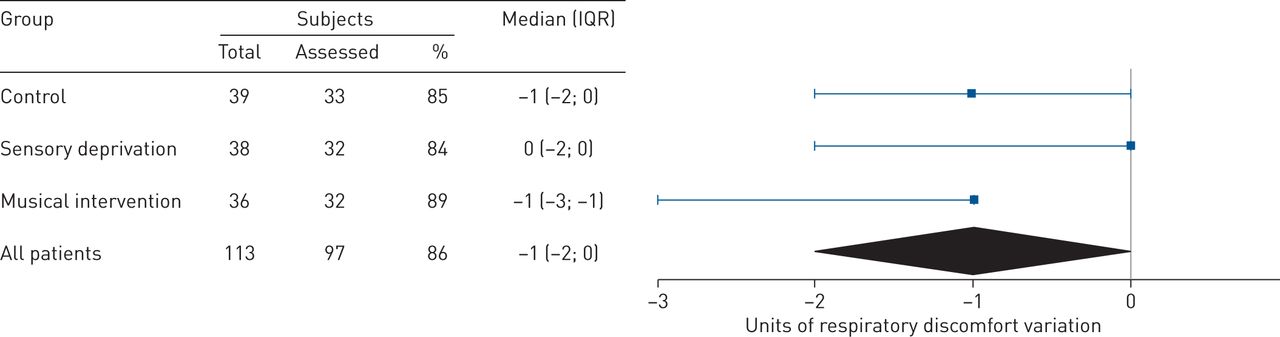
- FIGURE 2
Median change in respiratory discomfort during the first noninvasive ventilation (NIV) session in the three groups. The median difference (IQR) was −1 (−2; 0) for the control group, 0 (−2; 0) for the sensory deprivation group and −1 (−3; 1.1) for the musical intervention group (p=0.7 by Wilcoxon rank–sum test). IQR: interquartile range.


Tables
- TABLE 1
Baseline data for the study
Characteristic Group Control (n=39) Sensory deprivation (n=38) Musical intervention (n=36) Age years 68 (61–76) 64 (57–72) 66 (58.5–71) Male gender 18 (46.2) 21 (55.3) 23 (63.9) BMI kg·m−2 24.9 (22.3–31.9) 25.1 (21.3–31.5) 26.6 (23.3–32.2) SAPS II# score 35.5 (27–47) 32 (24–40) 35 (27–41) Comorbid conditions Chronic cardiopathy 5 (12.8) 8 (21.1) 2 (5.6) Chronic respiratory disease 30 (76.9) 25 (65.8) 22 (61.1) Obstructive sleep apnoea 6 (15.4) 10 (26.3) 6 (16.7) Psychiatric disorder 2 (5.1) 5 (13.2) 5 (13.9) Alcohol consumption 4 (10.3) 9 (23.7) 10 (27.8) Smoker or ex-smoker 28 (71.8) 24 (63.2) 27 (75) HRQoL HADS score 16 (12–23) 17 (15–19.5) 15 (13–19) Anxiety sub-score 8.5 (6–12) 8.5 (5.5–10.5) 8 (6–10) Depression sub-score 8 (5–10) 8 (7–11) 7 (5–9) SF-36 score Physical sub-score 27.7 (12.5–46.3) 27.8 (15.9–47.1) 32.5 (18.3–50.8) Mental sub-score 41.4 (28.1–56.9) 41.9 (19.2–54.2) 45.3 (24.9–59.7) Reason for NIV¶ Acute-on-chronic respiratory failure 24 (61.4) 19 (50) 18 (50) Pulmonary oedema 10 (25.6) 11 (28.9) 10 (27.8) De novo respiratory failure 6 (15.4) 8 (21.1) 7 (19.4) Post-extubation respiratory failure 2 (5.1) 3 (7.9) 3 (8.3) Post-operative respiratory failure 3 (7.7) 3 (7.9) 5 (13.9) Chest trauma 0 (0) 2 (5.3) 0 (0) Post-extubation respiratory failure prophylaxis 0 (0) 2 (5.3) 1 (2.8) ICU therapies prior to enrolment Invasive mechanical ventilation 3 (7.7) 5 (13.2) 6 (16.7) Noninvasive mechanical ventilation 18 (46.2) 22 (57.9) 14 (38.9) GCS score at enrolment 15 (15–15) 15 (15–15) 15 (15–15) Respiratory rate breaths·min−1 25 (20–29) 24 (21.5–28) 24 (20–27) Heart rate beats·min−1 99 (89–110) 95 (83–110) 96 (84–115) PaO2/FIO2 ratio at enrolment 227 (181–287) 224 (157.5–259.5) 189 (144–281) PaO2/FIO2 ratio <200 mmHg 13 (35.2) 15 (41.7) 17 (51.5) PaCO2 at enrolment mmHg 63 (45.7–72) 53 (44–70.8) 50.7 (41.5–71.5) Data is presented as n (%) or median (IQR). Demographic characteristics and comorbid conditions were recorded at study inclusion. BMI: body mass index; SAPS II: simplified acute physiology score II; HRQoL: health-related quality of life; HADS: Hospital Anxiety and Depression Scale; SF-36: 36-item Short-Form Health Survey; NIV: noninvasive ventilation; ICU: intensive care unit; GCS: Glasgow Coma Scale; PaO2: arterial oxygen tension; FIO2: inspiratory oxygen fraction; PaCO2: arterial carbon dioxide tension; IQR: interquartile range. #: SAPS II scores can range from zero (lowest level of critical illness) to 163 (most severe level of critical illness with 100% predicted mortality). A score of 50 predicts a 46.1% risk of death. SAPS II scores were calculated 24 h after ICU admission; ¶: multiple reasons might have led to the initiation of NIV.
- TABLE 2
Clinical outcomes in the study
Outcome Group p-value Control (n=39) Sensory deprivation (n=38) Musical intervention (n=36) Respiratory discomfort# At T0 of the first NIV session 4 1–6 5 2–6 5 1.5–7 – At T30 of the first NIV session 3 (0–5) 4 (2–5) 4 (2–5.5) – Primary outcome T0 to T30 change in respiratory discomfort during the first NIV session −1 (−2; 0) 0 (−2; 0) −1 (−3; 1.1) 0.86++ and 0.79§§ Secondary outcomes Adequacy¶ of the prescribed and actual duration of the NIV session 1.07 (1.00–1.33) 1.00 (0.87–1.26) 1.08 (0.93–1.26) 0.29 Patients requiring physical restraint during NIV 2 (5.1) 0 (0) 0 (0) 0.33 Patients requiring sedative or anxiolytic treatments+ during NIV 2 (5.1) 4 (10.5) 1 (2.8) 0.32 Patients requiring endotracheal intubations 3 (7.7) 1 (2.6) 0 0.32 PDI§ at ICU discharge 16 (12–25) 16 (5–23) 8 (5–13) 0.03 Overall assessmentf of NIV at ICU discharge Discomfort 5 (2–6) 5 (2–8.5) 4 (1–5) 0.21 Satisfaction 7.5 (5–9) 6.3 (5–9.5) 8 (5.2–9) 0.78 Trauma 3.5 (0–7) 4 (0–7.5) 2 (0–5) 0.72 HADS## score at day-90 12 (8.5–20.5) 16.5 (11–21) 10 (8–16) 0.14 Anxiety sub-score 6 (3–9) 6 (5–11) 5 (3–9) 0.17 Depression sub-score 7 (4–10) 9 (4–13) 5 (4–10) 0.33 SF-36## score at day-90 Physical sub-score 46 (27.1–61) 42.7 (22.9–64.4) 45.2 (32.1–63.3) 0.75 Mental sub-score 53.8 (31.1–70.5) 55.4 (22.8–72.3) 65.5 (30.1–87) 0.22 PDI§ at day-90 12 (4–20) 14 (8–20) 9 (5–12) 0.18 Overall assessmentf of NIV at day-90 Discomfort 4 (1–6) 6 (3–9) 4 (2–7) 0.29 Satisfaction 10 (8–10) 5 (3–8) 8 (7–10) 0.02 Trauma 1 (0–8) 2 (0–8) 0 (0–5) 0.78 Other outcomes Length of first NIV session min 70 (60–140) 60 (50–75) 82.5 (60–145) 0.21 Number of NIV sessions per patient 7 (3–17) 6.5 (4–10) 5.5 (2–8.5) 0.06 Length of NIV support days 3 (2–5) 3 (2–4) 3 (2–4) 0.16 Length of ICU stay days 7 (4–9) 6 (3–10) 6 (3–10.5) 0.63 ICU survival 36 (92.3) 38 (100) 33 (91.7) 0.21 Patients with a do-not-intubate decision 10 (25.6) 4 (10.5) 7 (19.4) 0.23 Day-90 survival¶¶ 21 (53.9) 22 (57.9) 20 (55.6) 0.84 Data is presented as n (%) or median (IQR). p-Values measure the comparison between the three groups unless otherwise stated. NIV: noninvasive ventilation; T0: time of assessment of respiratory discomfort prior to each NIV session; T30: time of the assessment of respiratory discomfort after 30 min of each NIV session; PDI: Peri-traumatic Distress Inventory; ICU: intensive care unit; HADS: Hospital Anxiety and Depression Scale; SF-36: 36-item Short-Form Health Survey; IQR: interquartile range. #: the assessment of respiratory discomfort used a visual scale, which combined numeric and analogic evaluation. The patients were asked to rate the intensity of their dyspnoea on a 10-cm long ruler shaped like an arrow. It was bounded by “0: no respiratory discomfort” (the smallest base of the arrow) and to the right “10: maximal respiratory discomfort” (the head of the arrow). ¶: the adequacy of the prescribed durations of the NIV session and their actual durations was calculated as the sum of the actual duration of all NIV sessions per patient divided by the sum of their prescribed time; +: the Richmond Agitation–Sedation Scale (RASS) is a 10-point scale, ranging from −5 to +4, where the lowest score (−5: unarousable) equals deeper sedation and the highest score (+4: combative) indicates major agitation; §: post-traumatic stress disorder (PTSD) related symptoms were assessed using the PDI scale. The PDI is a 13-item questionnaire, each item being scored from 0–4, with a higher score indicating a higher burden of PTSD-related symptoms; f: NIV-associated discomfort, satisfaction and trauma were assessed with a 0–10 numeric–visual scale at ICU discharge and a 0–10 numeric–verbal scale at day-90 (0: the absence of symptoms and –10: the maximum level of symptoms); ##: health-related quality of life (HRQoL) was measured using the physical and mental sub-scales of the SF-36 and HADS questionnaires. The SF-36 is a 36-item questionnaire scored from 0–100. The lower the score the more disability and the higher the score the less disability (a score of 0 is equivalent to maximum disability and a score of 100 is equivalent to no disability). The HADS is a 14-item questionnaire, each item being scored from 0–3, with a higher score indicating a higher level of anxiety or depression (a cut-off point of eight out of 21 identifies either anxiety or depression); ¶¶: vital status was assessed for 63 subjects at day-90; ++: p-value for the comparison of the musical intervention group versus the control group; §§: p-value for the comparison of the sensory deprivation group versus the control group.
- TABLE 3
Secondary outcomes: respiratory discomfort and physiological variables over time
Variable First NIV session All NIV sessions Slope value# units·h−1 Change versus control group p-value Slope value# units·h−1 Change versus control group p-value Respiratory discomfort Control group (n=39) −0.26 (−0.64; 0.12) – – −0.03 (−0.14; 0.08) – – Musical intervention group (n=36) −0.45 (−0.83; −0.08) −0.19 0.27 −0.14 (−0.27; −0.01) −0.11 0.21 Sensory deprivation group (n=38) −0.23 (−0.68; 0.22) 0.031 0.30 −0.17 (−0.31; −0.05) −0.14 0.09 Respiratory rate Control group (n=39) 0.19 (−0.14; 0.52) – – 0.02 (−0.20; 0.24) – – Musical intervention group (n=36) −0.12 (−0.62; 0.38) −0.31 0.31 −0.19 (−0.43; 0.05) −0.21 0.21 Sensory deprivation group (n=38) −0.21 (−0.75; 0.32) −0.40 0.21 −0.32 (−0.59; −0.05) −0.34 0.049 Transcutaneous oxygen saturation Control group (n=39) −0.18 (−0.78; 0.41) – – 0.26 (−0.08; 0.60) – – Musical intervention group (n=36) −0.27 (−0.83; 1.23) −0.08 0.89 −0.09 (−0.48; 0.30) −0.35 0.18 Sensory deprivation group (n=38) 0.20 (−0.83; 1.23) 0.39 0.52 0.2 (−0.25; 0.65) −0.06 0.83 Exhaled tidal volume Control group (n=39) 4.61 (−9.01; 18.24) – – −1.76 (−7.09; 3.57) – – Musical intervention group (n=36) −6.99 (9.08; 12.47) −11.6 0.14 −9.42 (−15.70; −3.13) −7.66 0.07 Sensory deprivation group (n=38) 16.7 (−5.29; 38.62) 12.1 0.58 4.23 (−4.01; 12.47) 5.99 0.23 Heart rate Control group (n=39) 0.66 (−1.07; 2.38) – – −0.41 (−0.96; 0.15) – – Musical Intervention group (n=36) −1.38 (−3.16; 0.40) −2.03 0.10 −0.19 (−0.78; 0.41) 0.22 0.59 Sensory deprivation group(n=38) −0.01 (−2.01; 1.99) −0.67 0.62 −0.47 (−1.11; 0.17) −0.07 0.87 Systolic arterial pressure Control group (n=39) 1.25 (−1.32; 3.82) – – −0.17 (−1.13; 0.78) – – Musical intervention group (n=36) −2.40 (−5.09; 0.29) −3.65 0.05 −0.69 (−1.73; 0.33) −0.53 0.45 Sensory deprivation group (n=38) 1.63 (−1.57; 4.83) 0.39 0.85 −0.91 (−1.98; 0.33) −0.75 0.30 Mean arterial pressure Control group (n=39) 0.80 (−0.55; 2.15) – – 0.02 (−0.57; 0.60) – – Musical intervention group (n=36) −1.50 (−3.00; 0.003) −2.30 0.02 −0.42 (−1.06; 0.21) −0.45 0.30 Sensory deprivation group (n=38) 0.50 (−1.35; 2.36) −0.30 0.80 −0.47 (−1.14; 0.20) −0.50 0.27 Data is presented as mean (95% CI). #: slope values were obtained using a linear mixed-effects model fitted for each outcome. A positive slope means that the corresponding outcome increases over time, while a negative slope means that it decreases over time. The slope value of each intervention group (musical and sensory deprivation) was compared with the slope value of the control group using a Wald test.
Supplementary Material
Please note: supplementary material is not edited by the Editorial Office, and is uploaded as it has been supplied by the author.
Supplementary material ERJ-01873-2018_Supplement
Figure S1. Evolution of respiratory discomfort during the first noninvasive ventilation session in the 3 groups. Respiratory discomfort ranges from 0 to 10, with 0 representing the absence of respiratory discomfort, and 10 the maximal respiratory discomfort. Solid lines represent the slope of respiratory comfort evolution over time. ERJ-01873-2018_Figure_S1
Musical excerpt 1: example of a downswing phase; "à la manière de Mozart”, first movement. ERJ-01873-2018_Musical_excerpt_1
Musical excerpt 2: continuation of the downswing phase; “à la manière de Mozart”, second movement. ERJ-01873-2018_Musical_excerpt_2
Musical excerpt 3: maximal relaxation phase; "à la manière de Mozart”, third movement. ERJ-01873-2018_Musical_excerpt_3


