


Figures
- FIGURE 1
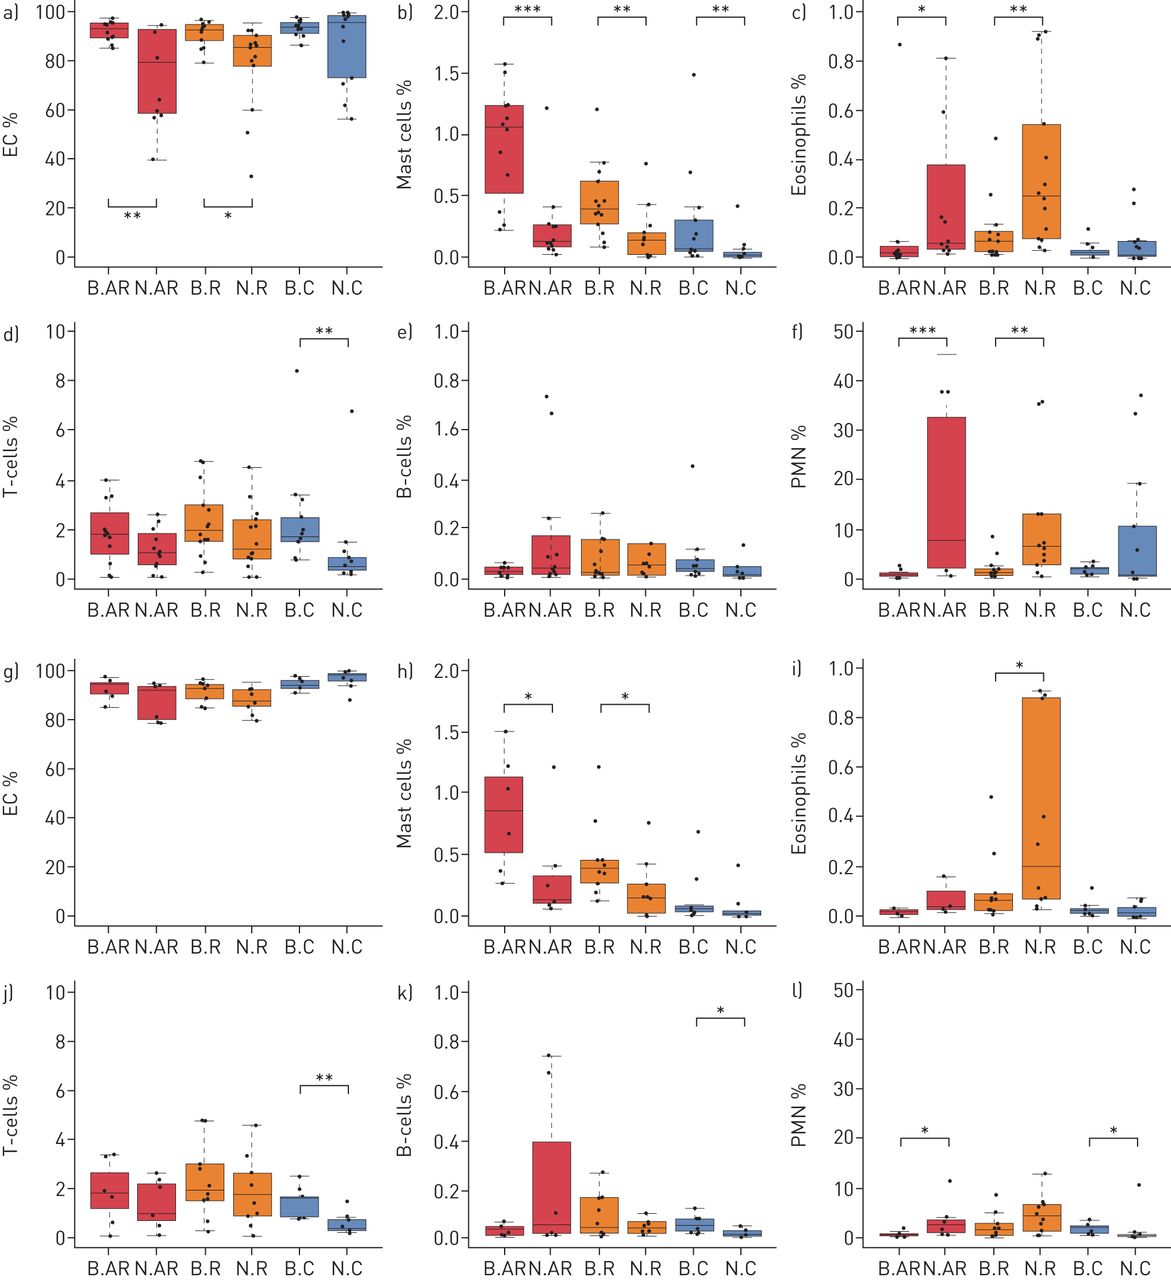
Nasal and bronchial cell composition as illustrated by boxplots of the percentages of epithelial cells (EC), mast cells, eosinophils, T-cells, B-cells and polymorphonuclear neutrophils (PMN) for each group of subjects in the initial set of patients (a–f) and the final set of patients (g–l). AR: allergic rhinitis and asthma; R: isolated allergic rhinitis; C: healthy controls; N: nasal; B: bronchial. *: p<0.05; **: p<0.01; ***: p<0.001.
- FIGURE 2
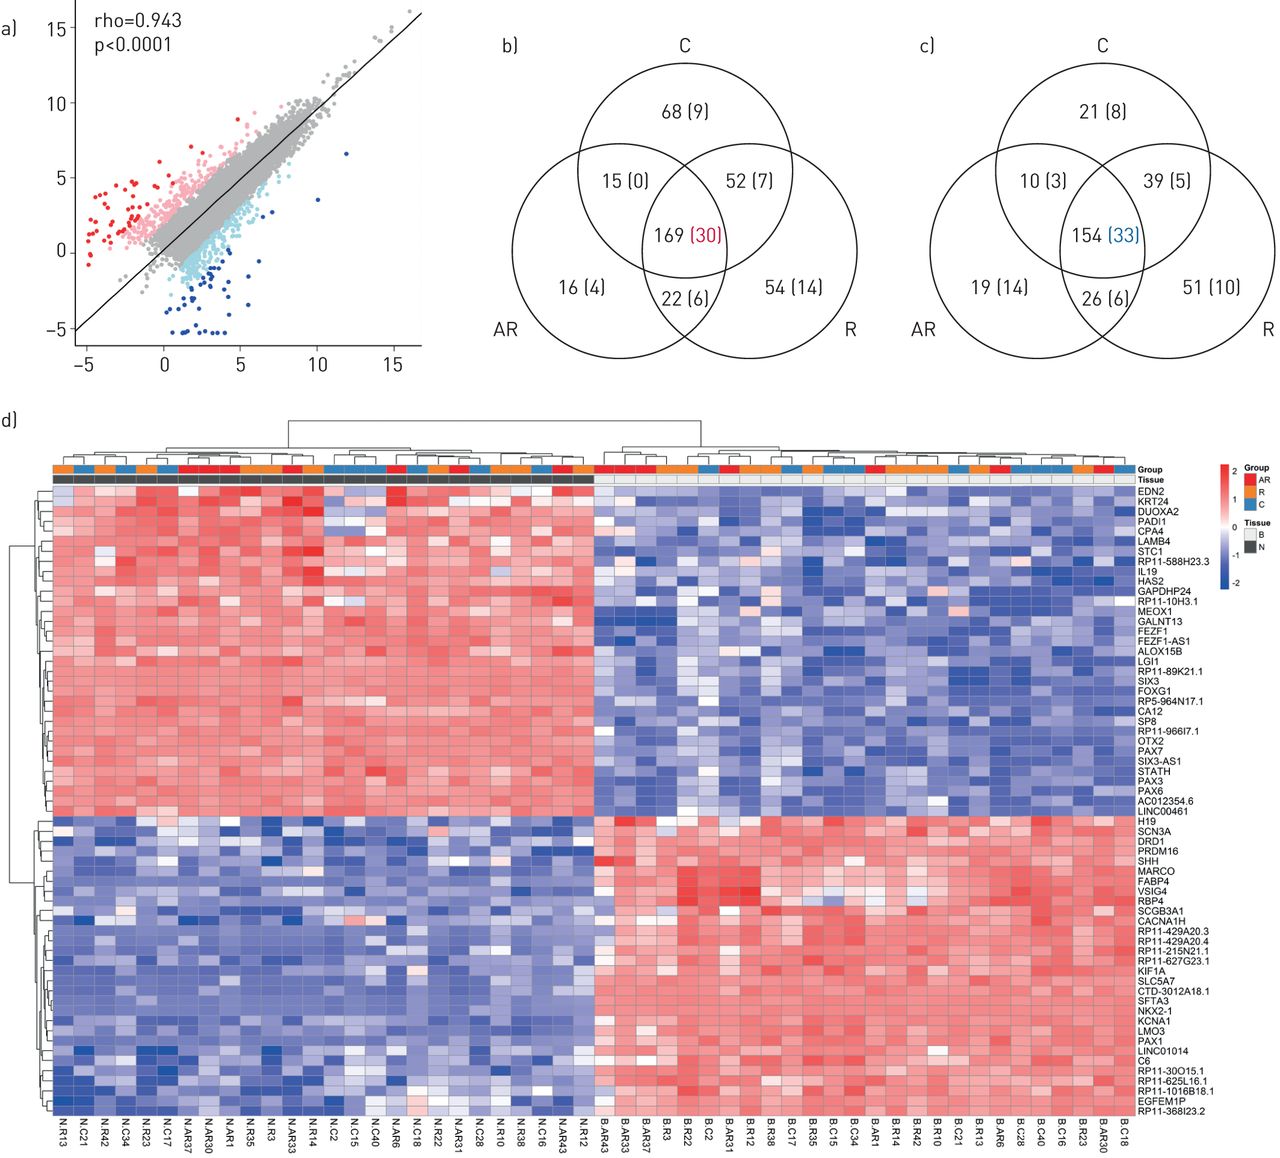
Differential gene expression between nasal and bronchial tissues (63 transcripts), as illustrated by: a) A scatter plot of average log2 expression levels for genes commonly expressed between nasal and bronchial tissues (both n=26); b) A Venn diagram showing the number of genes differentially upregulated between nose and bronchi, common to the three clinical groups; c) A Venn diagram showing the number of genes differentially downregulated between nose and bronchi, common to the three clinical groups (differentially expressed genes were defined by an adjusted p-value <0.05 and an abs(log2 FC) value >2. The values highlighted within parentheses correspond to an adjusted p-value <0.05 and an abs(log2 FC) value >4); d) An unsupervised hierarchical clustering of the RNAseq data based on a set of the 63 most differentially expressed genes (adjusted p-value <0.05 and an abs(log2 FC) value >4). Each square represents the expression level of a given gene in a given sample relative to the average expression level in all samples. A red-to-blue colour scale indicates gene expression levels above (red) or below (blue) the average level of expression for this same gene. AR: allergic rhinitis and asthma; R: isolated allergic rhinitis; C: healthy controls; N: nasal; B: bronchial; FC: fold change; rho: Spearman's rho.
- FIGURE 3
Hierarchical clustering of nasal and bronchial samples (both n=26), according to their respective Type 2 T-helper cell (Th2), Type 17 T-helper cell (Th17) and interferon (IFN) status, as illustrated by: a) An unsupervised hierarchical clustering of the RNAseq data based on our 4-gene Th2 signature. Each square represents the expression level of a given gene in a given sample relative to the gene average expression level in all samples (a red-to-blue colour scale indicates gene expression levels above (red) or below (blue) the average level of expression for the same transcript). Genes belonging to the Th17 and IFN signatures were added, but did not participate in this clustering; b) A heatmap of correlation between the 18 genes of the Th2, Th17 and IFN signatures; c) A representation of the nasal and bronchial Th2, Th17 and IFN status of each patient (a red colour indicating a high status). B: bronchial; N: nasal; AR: allergic rhinitis and asthma; R: isolated allergic rhinitis; C: healthy controls.
- FIGURE 4
Comparison of Type 2 T-helper cell (Th2), Type 17 T-helper cell (Th17) and interferon (IFN) scores with clinical and biological parameters, as illustrated by: 1) Scatter plots of Th2 scores in nasal samples versus percentage of mast cells in nasal brushings (a) and number of sensitisations (b). Scatter plots of Th2 scores in bronchial samples versus percentage of mast cells in bronchial brushings (c) and number of sensitisations (d); 2) Scatter plots of Th17 scores in nasal samples versus percentage of epithelial cells (EC) (e) and percentage of polymorphonuclear neutrophils (PMN) (f) in nasal brushings. Scatter plots of Th17 score in bronchial samples versus percentage of EC (g) and PMN (h) in bronchial brushings; 3) Scatter plots of IFN score in nasal samples versus forced expiratory volume in 1 s (FEV1) (i) and forced vital capacity (FVC) (j). Scatter plots of IFN score in bronchial samples versus FEV1 (k) and FVC (l).


Tables
- TABLE 1
Subject characteristics (n=26)
AR R C p-value Sample size 7 10 9 Age years 22 (21; 24) 26 (22.5; 28.75) 29 (25; 36) 0.045 Sex (males/females) 5/2 7/3 2/7 0.069 PAREO score 8 (6.5; 8.5) 7 (6.25; 8) na 0.586 SNOT-22 score 32 (22; 47) 26 (22; 35.75) na 0.561 Sensitisations n 5 (4.5; 6.5) 3 (2; 5.25) 0 0.001 Dust mite senstitisation 5 8 0 0.001 Intermittent/persistent rhinitis 1/6 2/8 na 0 Mild/moderate–severe rhinitis 1/6 3/7 na 0 Rhinitis duration years 6.4 (3.98; 18.64) 14.47 (6.43; 15.46) na 0.66 Partly controlled/controlled asthma 2/5 na na na FEV1 % predicted 91.4 (86.8; 97.1) 100.1 (96.6; 103.2) 96.8 (93.4; 98.7) 0.134 FEF25–75 % predicted 74 (69.4; 89.4) 105.3 (89; 116.6) 92.1 (81.4; 96.2) 0.11 Asthma duration years 2.98 (1.98; 11.84) na na na Nasal cell count ×105 cells 7.5 (6.85; 9.5) 8.6 (6.8; 12) 7.2 (5; 8) 0.771 Nasal EC % 91.5 (80.1; 93.5) 86.9 (85.5; 91.7) 98 (95.6; 98.8) 0.002 Nasal mast cells % 0.14 (0.11; 0.33) 0.15 (0.05; 0.24) 0.01 (0.01; 0.04) 0.02 Nasal eosinophils % 0.04 (0.03; 0.10) 0.21 (0.07; 0.77) 0.01 (0; 0.04) 0.003 Nasal T-cells % 0.93 (0.67; 2.18) 1.73 (0.88; 2.5) 0.35 (0.29; 0.68) 0.03 Nasal B-cells % 0.05 (0.01; 0.38) 0.03 (0.01; 0.06) 0.01 (0; 0.03) 0.13 Nasal PMN % 2.66 (1.09; 3.56) 4.14 (1.48; 6.53) 0.22 (0.09; 0.58) 0.03 Bronchial cell count ×105 cells 9.5 (8.25; 10.15) 15 (9; 21) 13 (8; 17) 0.441 Bronchial EC % 94.3 (90.3; 94.9) 92.5 (88.3; 94.3) 94.2 (92.7; 95.9) 0.25 Bronchial mast cells % 0.86 (0.52; 1.13) 0.39 (0.29; 0.46) 0.07 (0.04; 0.08) 0.002 Bronchial eosinophils % 0.02 (0.01; 0.03) 0.07 (0.03; 0.09) 0.02 (0.01; 0.03) 0.09 Bronchial T-cells % 1.8 (1.12; 2.59) 1.93 (1.53; 2.91) 1.59 (0.82; 1.65) 0.48 Bronchial B-cells % 0.03 (0.01; 0.04) 0.04 (0.01; 0.15) 0.05 (0.02; 0.07) 0.53 Bronchial PMN % 0.43 (0.19; 0.64) 1.25 (0.3; 2.39) 1.98 (0.68; 2.03) 0.06 Data are presented as n, n/n, or median (first quartile; third quartile). Statistically significant p-values appear in bold. AR: allergic rhinitis and asthma; R: isolated allergic rhinitis; C: healthy controls; na: not applicable; PAREO: itchy nose (P), anosmia (A), rhinorrhea (R), sneezing (E) and nasal obstruction (O) test; SNOT-22: 22-item sino-nasal outcome test; FEV1: forced expiratory volume in 1 s; FEF25–75: forced expiratory flow at 25–75% of forced vital capacity; EC: epithelial cells; PMN: polymorphonuclear neutrophils.
- TABLE 2
Comparison between nasal and bronchial cells within groups (n=26)
AR R C Nasal Bronchial p-value Nasal Bronchial p-value Nasal Bronchial p-value Cell count ×105 cells 7.5 (6.85; 9.5) 9.5 (8.25; 10.15) 0.47 8.6 (6.8; 12) 15 (9; 21) 0.077 7.2 (5; 8) 13 (8; 17) 0.121 EC % 91.5 (80.1; 93.5) 94.3 (90.3; 94.9) 0.209 86.9 (85.5; 91.7) 92.5 (88.3; 94.3) 0.123 98 (95.6; 98.8) 94.2 (92.7; 95.9) 0.063 Mast cells % 0.14 (0.11; 0.33) 0.86 (0.52; 1.13) 0.026 0.15 (0.05; 0.24) 0.39 (0.29; 0.46) 0.023 0.01 (0.01; 0.04) 0.07 (0.04; 0.08) 0.077 Eosinophils % 0.04 (0.03; 0.10) 0.02 (0.01; 0.03) 0.097 0.21 (0.07; 0.77) 0.07 (0.03; 0.09) 0.043 0.01 (0; 0.04) 0.02 (0.01; 0.03) 0.185 T-cells % 0.93 (0.67; 2.18) 1.8 (1.12; 2.59) 0.71 1.73 (0.88; 2.5) 1.93 (1.53; 2.91) 0.481 0.35 (0.29; 0.68) 1.59 (0.82; 1.65) 0.001 B-cells % 0.05 (0.01; 0.38) 0.03 (0.01; 0.04) 0.456 0.03 (0.01; 0.06) 0.04 (0.01; 0.15) 0.796 0.01 (0; 0.03) 0.05 (0.02; 0.07) 0.031 PMN % 2.66 (1.09; 3.56) 0.43 (0.19; 0.64) 0.026 8.6 (6.8; 12) 1.25 (0.3; 2.39) 0.075 0.22 (0.09; 0.58) 1.98 (0.68; 2.03) 0.031 Data are presented as median (first quartile; third quartile). Statistically significant p-values appear in bold. AR: allergic rhinitis and asthma; R: isolated allergic rhinitis; C: healthy controls; EC: epithelial cells; PMN: polymorphonuclear neutrophils.
Supplementary Material
Please note: supplementary material is not edited by the Editorial Office, and is uploaded as it has been supplied by the author.
Supplementary materials and methods. ERJ-00437-2018_Supplement
Table E1. Subject characteristics (n=39). ERJ-00437-2018_Table_E1
Table E2. Comparison of nasal and bronchial cells within groups (n=39). ERJ-00437-2018_Table_E2
Table E3. Comparison between included (n=26) and excluded (n=13) subject characteristics. ERJ-00437-2018_Table_E3
Table E4. 63 most-regulated genes between nasal and bronchial cells in healthy subjects (C). ERJ-00437-2018_Table_E4
Figure E1. Flow chart of the study. ERJ-00437-2018_Figure_E1
Figure E2. Differential gene expression between nasal and bronchial tissues (323 transcripts). Unsupervised hierarchical clustering of the RNAseq data based on a set of the 323 most differentially expressed genes (adjusted p-value <0.05 and an abs(log2 FC)>2). Each square represents the expression level of a given gene in a given sample relative to the average expression level in all samples. A red-to-blue color scale indicates gene expression levels above (red) or below (blue) the average level of expression for this same gene. ERJ-00437-2018_Figure_E2
Figure E3. Biological theme analysis of nose/bronchus signature. Physiological system development and functional categories found to be significantly affected in an Ingenuity Pathway Analysis® downstream effect analysis of a selection of 323 genes differentially expressed between nasal and bronchial samples (adjusted p-value <0.05 and an abs(log2 FC)>2). Bars represent the strength of the statistical significance. ERJ-00437-2018_Figure_E3
Figure E4. Boxplots showing the expression in AR, R and C samples from the nose and bronchi for the 28 transcripts defining the initial Th2 gene signature, defined from GSE19190, GSE110799, GSE37693 and GSE4804. Distribution of expression levels (log2) in each experimental group for the 28-gene set of our Th2 signature. Footnotes: B: bronchus; N: nose; AR: allergic rhinitis and asthma group; R: isolated allergic rhinitis group; C: healthy controls. ERJ-00437-2018_Figure_E4
Figure E5. Hierarchical clustering based on initial Th2 gene signature. Unsupervised hierarchical clustering of the RNAseq data based the initial 28 genes Th2 signature. Each square represents the expression level of a given gene in a given sample relative to the gene average expression level in all samples. A red-to-blue color scale indicates gene expression levels above (red) or below (blue) the average level of expression for the same transcript. Footnotes: B: bronchus; N: nose; AR: allergic rhinitis and asthma group; R: isolated allergic rhinitis group; C: healthy controls. ERJ-00437-2018_Figure_E5
Figure E6. Heatmap of Pearson correlation between Th2 markers. Unsupervised hierarchical clustering of the pairwise correlations between Th2 markers. Each square represents the Pearson correlation coefficient between 2 genes. A red-to-blue color scale indicates positive (red) or negative (blue) correlation. ERJ-00437-2018_Figure_E6
Figure E7. Hierarchical clustering based Th2, Th17 and IFN gene signature. Unsupervised hierarchical clustering of the RNAseq data based on the (A) initial 4-genes Th2 signature (B) Th17 signature, (C) IFN signature. Each square represents the expression level of a given gene in a given sample relative to the gene average expression level in all samples. A red-to-blue color scale indicates gene expression levels above (red) or below (blue) the average level of expression for the same transcript. Footnotes: B: bronchus; N: nose; AR: allergic rhinitis and asthma group; R: isolated allergic rhinitis group; C: healthy controls. ERJ-00437-2018_Figure_E7
Figure E8. Th2 score of bronchial samples in the R group as a function of asthma history. Boxplots of Th2 score in the bronchial samples from the patients belonging to the R group according to clinical history. *: p-value <0.05. Footnotes: A: asthma history; EW: isolated wheeze on exertion history; N: no asthma or wheeze on exertion history. ERJ-00437-2018_Figure_E8
Figure E9. Hierarchical clustering based on an enlarged IFN gene signature. Unsupervised hierarchical clustering of the RNAseq data based on an extended 33-gene IFN signature. Each square represents the expression level of a given gene in a given sample relative to the gene average expression level in all samples. A red-to-blue color scale indicates gene expression levels above (red) or below (blue) the average level of expression for the same transcript. Footnotes: B: bronchus; N: nose; AR: allergic rhinitis and asthma group; R: isolated allergic rhinitis group; C: healthy controls. ERJ-00437-2018_Figure_E9
Figure E10. IFN score in nasal and bronchial samples. Boxplots of IFN score in the nasal and bronchial samples (score based on the 33 genes signature), in the (A) whole dataset and (B) removing the four samples with the highest scores. ERJ-00437-2018_Figure_E10


