


Abstract
In line with the pathophysiological continuum described between nose and bronchus in allergic respiratory diseases, we assessed whether nasal epithelium could mirror the Type 2 T-helper cell (Th2) status of bronchial epithelium.
Nasal and bronchial cells were collected by brushing from healthy controls (C, n=13), patients with allergic rhinitis and asthma (AR, n=12), and patients with isolated allergic rhinitis (R, n=14). Cellular composition was assessed by flow cytometry, gene expression was analysed by RNA sequencing and Th2, Type 17 T-helper cell (Th17) and interferon (IFN) signatures were derived from the literature.
Infiltration by polymorphonuclear neutrophils (PMN) in the nose excluded 30% of the initial cohort. All bronchial samples from the AR group were Th2-high. The gene expression profile of nasal samples from the AR group correctly predicted the paired bronchial sample Th2 status in 71% of cases. Nevertheless, nasal cells did not appear to be a reliable surrogate for the Th2 response, in particular due to a more robust influence of the IFN response in 14 out of 26 nasal samples. The Th2 scores in the nose and bronchi correlated with mast cell count (both p<0.001) and number of sensitisations (p=0.006 and 0.002), while the Th17 scores correlated with PMN count (p=0.006 and 0.003).
The large variability in nasal cell composition and type of inflammation restricts its use as a surrogate for assessing bronchial Th2 inflammation in AR patients.
Abstract
Nasal epithelial cells are not good surrogates for bronchial epithelial cells in the evaluation of Th2 inflammation http://ow.ly/if5u30ltyx5
Introduction
A pathophysiological continuum has been described between the nose and bronchus in allergic respiratory diseases [1, 2]. Most patients with allergic asthma also have allergic rhinitis, while 20–50% of patients with allergic rhinitis have asthma [3]. Rhinitis has been demonstrated to be an independent risk factor for the development of asthma in atopic and non-atopic patients (odds ratio (OR) 8.1 and 11.6, respectively) [4, 5]. Consequently, nasal cells have been suggested as potential surrogates for bronchial cells in the study of allergic respiratory diseases [6]. Indeed, nasal cells can be collected easily and repeatedly, including in children, through noninvasive sampling [7].
Type 2 T-helper cell (Th2) inflammation is a major component of the epithelial response in allergic respiratory disease in adults [8] and children [9] and has been used to predict response to anti-Th2 biotherapies in asthmatic patients [10, 11]. These biotherapies are emerging as relevant opportunities for severe asthma, with promising results from phase IIb [12] and phase III [13, 14] trials. Type 17 T-helper cell (Th17) [15] and interferon (IFN) driven [16] epithelial responses represent more recently elucidated asthma pathways, which seem distinct and mutually exclusive of Th2 response in cross-sectional studies. Studies on biotherapies targeting these pathways are, on the other hand, still not convincing.
The definition of Th2-high and Th2-low status in asthma, as derived from initial bronchial transcriptomics studies [17], remains a challenge in clinical studies. Being able to predict Th2 bronchial status in asthma by gentle and innocuous nasal brushings could represent an interesting opportunity in the era of Th2-biotherapy development.
No study has yet compared the extent of Th2 inflammation in the same individual at the levels of nasal and bronchial epithelia. This led us to analyse whether Th2 inflammation was of similar amplitude in the nose and the bronchi in the context of allergic diseases and whether nasal Th2 inflammation was a good surrogate for bronchial Th2 inflammation in asthma. As Th17 and IFN signatures have also been described in asthma, we investigated whether these pathways were activated in our patients' samples and also their interplay with Th2 responses.
Material and methods
Subjects and samples
We collected nasal and bronchial brushings from 39 subjects. Of these subjects, 12 had both allergic rhinitis and asthma (group AR), 14 had allergic rhinitis only (group R) and 13 were healthy controls (group C). Allergic rhinitis was defined according to the 2010 Allergic Rhinitis and its Impact on Asthma (ARIA) recommendations [18]. Asthma was defined according to the 2012 Global INitiative for Asthma (GINA) [19] and 2007 Expert Panel Report 3 (EPR3) [20] recommendations. The project received the approval of the CPP Sud Méditerranée V Ethics Committee (ref: 13.032) on July 23, 2013 and all volunteers gave their written, informed consent.
Flow cytometry analysis
Flow cytometry was used to analyse 78 samples. Brushed cells were first incubated in a blocking solution containing 10% normal mouse serum and 50 µg·mL−1 human IgG (Sigma, St. Louis, United States) and then stained. The following monoclonal antibodies were purchased from BD Biosciences (Le Pont de Claix, France): anti-EPCAM (FITC), anti-CD45 (V510), anti-CD20 (PERCPCY55), anti-CD3 (APCH7), anti-CD16 (A700), anti-CD117 (PECY7); and from Biolegend (San Diego, CA, USA): anti-SIGLEC-8 (APC). Cells were fixed with Cytofix/Cytoperm reagents (BD Biosciences) then analysed on a BD LSR II Fortessa flow cytometer (BD Biosciences). Data were acquired with BD FACSDiva 6.1 software (BD Biosciences) and processed using Kaluza software (Beckman Coulter Life Sciences, Indianapolis, IN, USA). Doublet cells were excluded from the analysis.
Gene expression analysis
Gene expression analyses were conducted on 52 paired samples obtained from the 26 patients whose nasal and bronchial samples fulfilled our criteria in terms of epithelial cellularity (supplementary figure E1). Libraries were generated from 500 ng total RNA using the Truseq stranded total RNA ribo-zero gold kit (Illumina, San Diego, United States). Libraries were quantified with the KAPA library quantification kit (Kapa Biosystems) and sequenced on a NextSeq 500 platform (Illumina) with 2 × 75 base pair (bp) paired-end chemistry. RNA sequencing data were initially archived in Mediante, a database developed by our laboratory [21] and then uploaded to the Gene Expression Omnibus (GEO) database under reference GSE101720.
Th2 signature construction
A specific Th2 signature was compiled from four independent datasets analysing the response to interleukin (IL)-13 in human airway epithelia, as follows: 1) human nasal epithelial cells (EC) incubated with 10 ng·mL−1 IL-13 for 1 day (Giovannini-Chami et al. [9], GEO reference GSE19190); 2) human nasal EC incubated with 100 ng·mL−1 IL-13 for 3 days (GEO reference GSE110799); 3) human tracheal EC incubated with 50 ng·mL−1 IL-13 for 2 days under submerged conditions and then for 21 days under air–liquid interface (ALI) conditions (Alevy et al. [22], GEO reference GSE37693); 4) human bronchial EC incubated with 25 ng·mL−1 IL-13 for 2 days (Zhen et al. [23], GEO reference GSE4804). Differentially expressed genes were defined by a positive B statistic in all analyses, combined with a log2 fold change (FC) between IL-13 and control of at least two for GSE19190 and GSE4804, and at least four for the other two datasets [24]. Datasets were analysed with the GEO GEO2R tool (www.ncbi.nlm.nih.gov/geo/geo2r/) using custom R scripts.
Th17 and IFN signatures
Signatures for Th17+tumour necrosis factor-α (TNF-α) and IFN-α were defined by Choy et al. [15] and Bhakta et al. [16] in ALI cultures of normal human bronchial epithelium (NHBE). The bronchial IFN-α signature entirely overlapped with our previous IFN-α, IFN-β and IFN-γ signatures defined in primary cultures of nasal cells (normal human nasal epithelium (NHNE)) at ALI and suitable for analysis in nasal epithelium [9].
Metagenomics analysis of viral transcriptome
De novo transcriptome assembly was independently performed, using Trinity software (https://github.com/trinityrnaseq/trinityrnaseq/wiki) with default parameters, for each sample with 100 000 R1/R2 paired-end reads not mapping the human genome. We used the Trinity script “align_and_estimate_abundance.pl” to estimate the abundance of each reconstructed contig and to extract the first 20 most expressed for annotation using the Blast alignment tool (https://blast.ncbi.nlm.nih.gov/Blast.cgi) against a blast database gathering 9532 sequences belonging to one of the 7474 complete viral genomes available at the National Center for Biotechnology Information (NCBI; www.ncbi.nlm.nih.gov/genomes/GenomesGroup.cgi?taxid=10239).
Biostatistics
All statistical analyses outside of bioinformatics programs were performed using the R statistical package (R Project for Statistical Computing; www.r-project.org/). Statistical significance was assessed using nonparametric tests (Wilcoxon rank sum tests or Kruskal–Wallis rank sum tests). Associations between continuous variables were measured using Spearman's rho. These tests were two-sided and a nominal p-value of 0.05 was considered as statistically significant.
Results
Subjects characteristics
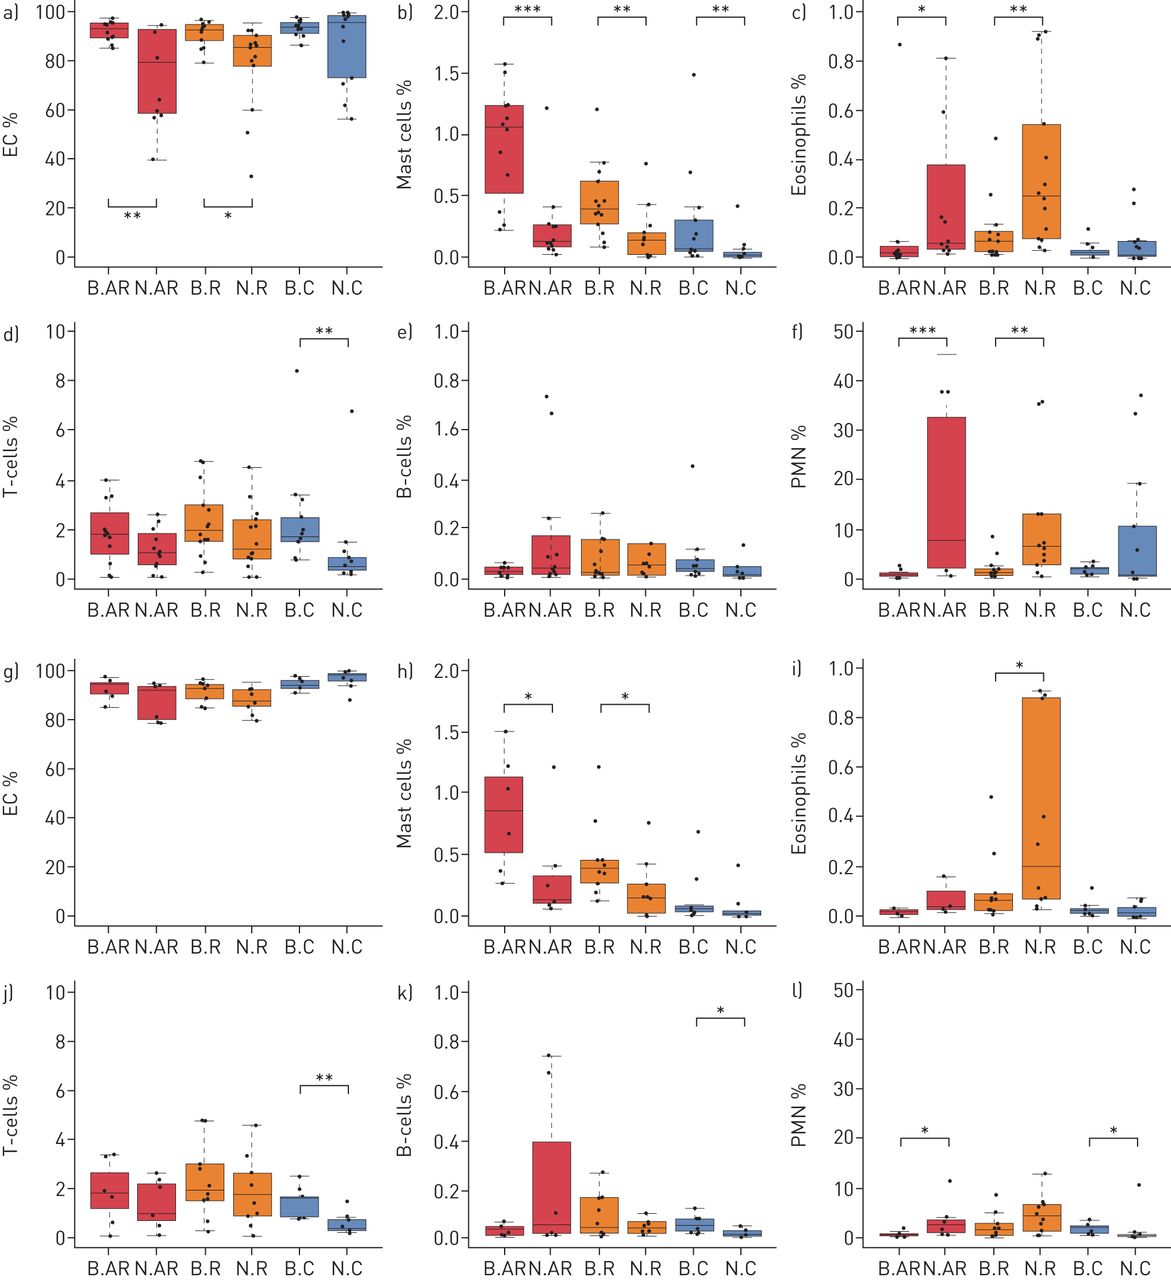
Characteristics of the 39 subjects are detailed in supplementary table E1. Flow cytometry analyses showed that 13 nasal samples (5 AR, 4 R, and 4 C) were composed of less than 80% EC, preventing comparison with bronchial samples (supplementary table E2, figures 1a–1f). These 13 samples and their paired bronchial samples were removed from further analysis, such that roughly equivalent levels of EC were observed in the remaining nasal and bronchial samples in each group (figures 1g–1l). Notably, with the exception of nasal sample cellularity, these 13 patients had similar clinical and functional characteristics to the 26 remaining subjects (supplementary table E3). The detailed characteristics of the 26 remaining subjects are shown in table 1. Three patients were taking medication, with one taking L-thyroxine for hypothyroidism, one taking antihistamines and inhaled salbutamol as a reliever treatment, and another taking only inhaled salbutamol for the same. There were more inflammatory cells (mast cells, eosinophils and polymorphonuclear neutrophils (PMN)), as well as more T-lymphocytes (T-cells), in nasal samples from patients belonging to groups AR and R than from controls and more mast cells in bronchial samples from patients belonging to groups AR and R than from controls. The composition of nasal and bronchial cells in the three clinical groups (AR, R and C) is shown in table 2. In the AR and R groups there was a higher percentage of mast cells in the bronchi than in the nose, as well as a higher percentage of eosinophils and PMN in the nose than in the bronchi.

Nasal and bronchial cell composition as illustrated by boxplots of the percentages of epithelial cells (EC), mast cells, eosinophils, T-cells, B-cells and polymorphonuclear neutrophils (PMN) for each group of subjects in the initial set of patients (a–f) and the final set of patients (g–l). AR: allergic rhinitis and asthma; R: isolated allergic rhinitis; C: healthy controls; N: nasal; B: bronchial. *: p<0.05; **: p<0.01; ***: p<0.001.
Subject characteristics (n=26)
Comparison between nasal and bronchial cells within groups (n=26)
Comparison of nasal and bronchial samples within groups
A high correlation was noticed between the gene expression levels in the nose and bronchi (figure 2a). However, some robust variations in gene expression between the two tissues were also noticed. Nasal and bronchial cells were easily distinguished, as evidenced by a list of the 63 most differentially expressed genes, which showed an absolute log2 FC above four and an adjusted p-value below 0.05 in all three independent clinical groups (figures 2b, 2c). This nasal/bronchial signature is presented in figure 2d and in supplementary table E4. The loosest cut-off, with an absolute log2 FC above two and an adjusted p-value below 0.05 in the three clinical groups, selected a list of 323 genes (supplementary figure E2).
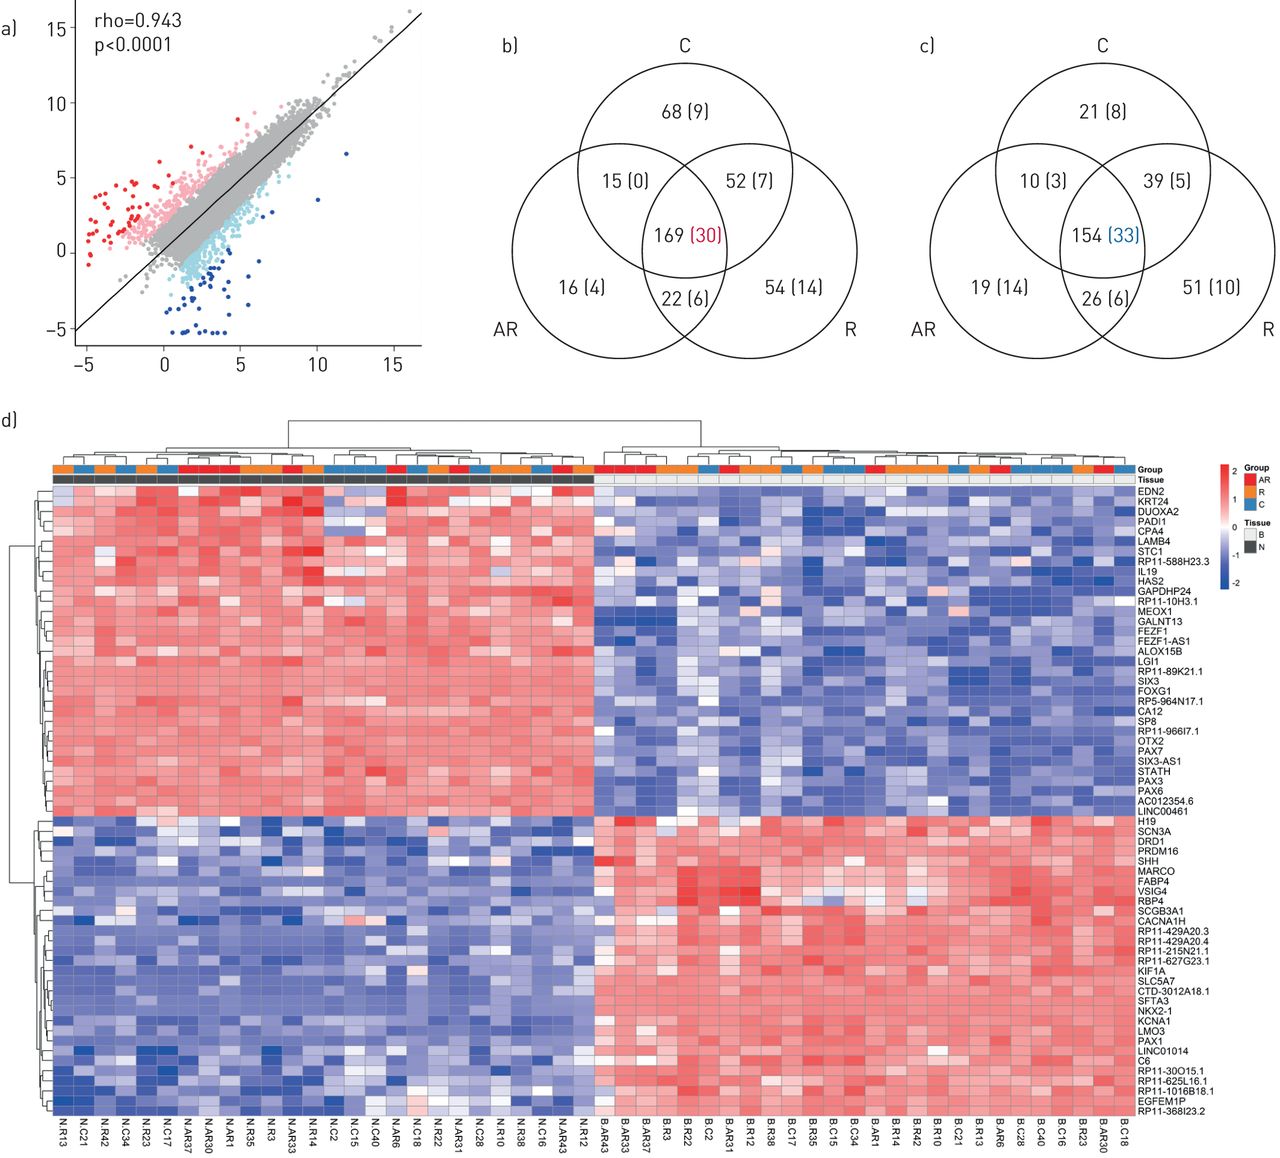
Differential gene expression between nasal and bronchial tissues (63 transcripts), as illustrated by: a) A scatter plot of average log2 expression levels for genes commonly expressed between nasal and bronchial tissues (both n=26); b) A Venn diagram showing the number of genes differentially upregulated between nose and bronchi, common to the three clinical groups; c) A Venn diagram showing the number of genes differentially downregulated between nose and bronchi, common to the three clinical groups (differentially expressed genes were defined by an adjusted p-value <0.05 and an abs(log2 FC) value >2. The values highlighted within parentheses correspond to an adjusted p-value <0.05 and an abs(log2 FC) value >4); d) An unsupervised hierarchical clustering of the RNAseq data based on a set of the 63 most differentially expressed genes (adjusted p-value <0.05 and an abs(log2 FC) value >4). Each square represents the expression level of a given gene in a given sample relative to the average expression level in all samples. A red-to-blue colour scale indicates gene expression levels above (red) or below (blue) the average level of expression for this same gene. AR: allergic rhinitis and asthma; R: isolated allergic rhinitis; C: healthy controls; N: nasal; B: bronchial; FC: fold change; rho: Spearman's rho.
A functional annotation of the genes overexpressed in the nasal epithelium revealed many transcription factors for which expression has to date been considered to be restricted to neurons, such as PAX6 or OTX2 (supplementary figure E3). The increased expression of markers such as MARCO, FABP4, VSIG4 and RBP4 in bronchi probably illustrates the presence of resident macrophages.
Definition of the Th2 signature
In order to assess Th2 inflammation, we defined a Th2 signature that could be applied to nasal as well as bronchial epithelia. This was done after analysing the four independent microarray datasets defined in the methods section. Twenty-eight genes were found to be differentially expressed in at least three datasets. Strong differences in gene expression levels between nose and bronchi characterised some markers (supplementary figure E4) and this effect was stronger than the impact of the pathological status itself (supplementary figure E5). We decided to restrict our signature to transcripts that displayed equivalent levels of expression between nose and bronchi. The resulting signature contained POSTN, previously included in Woodruff's signature [17], CST1, FETUB and ALOX15 all previously included in Choy's signature [25]. Moreover, these genes were the most correlated (rho >0.55) in our data set among the initial 28 IL-13 inducible genes (supplementary figure E6). Of note, CST1 and FETUB were specifically expressed in allergic patients (supplementary figure E4).
Hierarchical clustering according to Th2 signature
A hierarchical clustering of the 52 samples from our three groups was performed using the four-gene Th2 signature (figure 3a and supplementary figure E7a) and subjects were stratified according to their Th2 response. A Th2-high response was defined by at least three out of four transcripts from the signature (i.e. 75%) displaying an expression above the average. For the AR group, all nasal samples except two (N.AR30 and N.AR33) and all bronchial samples were characterised by a Th2-high status. For the C group, all nasal and bronchial samples were characterised by a Th2-low status, except for one patient (N.C28 and B.C28). The R group was more heterogeneous, with four patients who had a nasal and bronchial Th2-low status, and two who had a nasal and bronchial Th2-high status. The nasal and bronchial Th2 status of the remaining four R patients was discordant (two with nasal Th2-low and bronchial Th2-high, and two with nasal Th2-high and bronchial Th2-low). The degree of concordance of Th2 status (high or low) within groups was 71% in the AR group, 60% in the R group and 100% in the C group (figure 3c).

Hierarchical clustering of nasal and bronchial samples (both n=26), according to their respective Type 2 T-helper cell (Th2), Type 17 T-helper cell (Th17) and interferon (IFN) status, as illustrated by: a) An unsupervised hierarchical clustering of the RNAseq data based on our 4-gene Th2 signature. Each square represents the expression level of a given gene in a given sample relative to the gene average expression level in all samples (a red-to-blue colour scale indicates gene expression levels above (red) or below (blue) the average level of expression for the same transcript). Genes belonging to the Th17 and IFN signatures were added, but did not participate in this clustering; b) A heatmap of correlation between the 18 genes of the Th2, Th17 and IFN signatures; c) A representation of the nasal and bronchial Th2, Th17 and IFN status of each patient (a red colour indicating a high status). B: bronchial; N: nasal; AR: allergic rhinitis and asthma; R: isolated allergic rhinitis; C: healthy controls.
Hierarchical clustering according to Th17 and IFN signatures
Hierarchical clustering was also performed using Th17 and IFN signatures (supplementary figures E7b, E7c). A Th17-high or IFN-high response was defined as more than 75% of transcripts being above the average. Nineteen samples displayed a Th17-high signature (10 bronchial and 9 nasal) and 14 samples displayed an IFN-high signature (all nasal). Of note, a strong tissue effect was observed concerning the IFN signature, with nasal samples showing a global higher level of IFN response transcripts than bronchial ones. This tissue effect was not observed with the Th17 response.
Relationships between Th2, Th17 and IFN signatures
Compiling Th2 hierarchical clustering with the gene expression levels of Th17 and IFN showed that outliers, such as N.AR33, had a low Th2 status but a high Th17 and IFN status and that some samples, like N.R14, had a triple (Th2, Th17 and IFN) high status (figures 3a, 3c). Th2 response was distinct from the IFN and Th17 responses in the whole dataset (figure 3b). Moreover, Th17 response was correlated globally to the IFN response, as illustrated by the fact that one of the transcripts belonging to the IFN-response signature (IFI6) clearly clustered with genes from the Th17 signature. Th2, Th17 and IFN status in a same individual is summarised for the two tissues in figure 3c.
Correlations with clinical and biological parameters
A Th2 score was calculated in order to assess the relationships between clinical and biological quantitative traits. First, normalised gene expression data for the genes included in the final Th2 signature were transformed into z-scores by gene, and then a Th2 score was calculated for each sample as the median of these z-scores. Th2 score was not related to any of the clinical severity parameters or spirometry scores (not shown). It was only correlated with the number of sensitisations and the number of mast cells in nasal and bronchial epithelium (figures 4a–4d). However, in the R group, Th2 score in bronchial epithelium was correlated with asthma history. Indeed, four out of the five subjects with a history of childhood asthma, with complete remission for more than 2 years, displayed the highest scores (supplementary figure E8).

Comparison of Type 2 T-helper cell (Th2), Type 17 T-helper cell (Th17) and interferon (IFN) scores with clinical and biological parameters, as illustrated by: 1) Scatter plots of Th2 scores in nasal samples versus percentage of mast cells in nasal brushings (a) and number of sensitisations (b). Scatter plots of Th2 scores in bronchial samples versus percentage of mast cells in bronchial brushings (c) and number of sensitisations (d); 2) Scatter plots of Th17 scores in nasal samples versus percentage of epithelial cells (EC) (e) and percentage of polymorphonuclear neutrophils (PMN) (f) in nasal brushings. Scatter plots of Th17 score in bronchial samples versus percentage of EC (g) and PMN (h) in bronchial brushings; 3) Scatter plots of IFN score in nasal samples versus forced expiratory volume in 1 s (FEV1) (i) and forced vital capacity (FVC) (j). Scatter plots of IFN score in bronchial samples versus FEV1 (k) and FVC (l).
Th17 and IFN scores were calculated as described previously for Th2 scores. Th17 score correlated positively with the number of PMN in nasal and bronchial epithelium and negatively with the percentage of EC in nasal epithelium (figures 4e–4h). IFN score in bronchial epithelium was inversely correlated to forced expiratory volume in 1 s (FEV1) and forced vital capacity (FVC) (figures 4i–4l).
As expected, Th2 scores were significantly higher in both nasal and bronchial samples in the AR+R group versus the C group and not different between the nose and bronchi. Th17 scores were not related to either the group of patients or the tissue and IFN scores were significantly higher in nasal versus bronchial samples. We further extended the nine-gene IFN signature [16] to a 33-gene signature common to Bhakta's 50-top list of transcripts induced in the bronchi [16] and our 79-top list of transcripts induced in the nose [9] (supplementary figure E9). The IFN score was still higher in nasal samples using this broader list, even after removing the four nasal samples with the highest scores (supplementary figure E10).
Metagenomic analysis of viral transcriptome
The presence of viruses among the unmapped reads (i.e. RNA sequences that did not map to the human genome) of the different samples was investigated. This analysis identified the presence of rhinovirus in the N.R3 and N.R14 samples, which both displayed a very strong IFN signature (supplementary figure E7b). We did not identify viruses in the other samples with a high IFN signature, probably because our sampling was performed long after infection.
Discussion
A link between the upper and lower airways in allergic respiratory diseases has been documented for many years, but the concept of a “united airway disease” (UAD), quoted as “one airway, one disease”, is more recent. This relies on epidemiological, clinical, functional, immunological and histological relationships, which have led to a global management approach for allergic respiratory diseases [26]. At the same time, upper and lower epithelia have been shown to display striking differences regarding defences against viral infections [27], remodelling [28], inflammation [29] and epithelial shedding. This has led us to analyse whether Th2 inflammation is of similar amplitude in the nose and bronchi in the context of allergic diseases and whether nasal Th2 inflammation is a good surrogate for bronchial Th2 inflammation in asthma.
Other noninvasive Th2 biomarkers usable in clinical studies have been developed in order to reflect Th2 bronchial status, such as serum periostin, blood eosinophils, exhaled nitric oxide fraction (FeNO) and total IgE. Moreover, they have been used with a machine learning inference scheme in order to predict the subtypes of gene expression within bronchial biopsies and EC [30]. These markers show their own merits, but they also display some limitations in the context of viral infection, cigarette smoking, parasitic infections and bone disease [31]. Moreover, use of serum periostin in large clinical trials has not yet shown clear benefits [32].
Induced sputum has also been analysed and could be a good proxy, however, it has not yet been directly compared to bronchial Th2 status [33, 34]. Though not invasive, this technique needs cooperation, is hardly feasible in young children and is unsafe in severe asthmatics. Based on our data set, it is unlikely that nasal samples can be sufficiently reliable to be used as a surrogate for bronchial epithelium to assess Th2 status in asthmatic patients with rhinitis. Even if some discrepancies could be explained by expositions to some specific pathogens, we demonstrate in this cross-sectional study that the same individual can display different inflammation profiles in the two sites. Moreover, we show that Th2, Th17 and IFN inflammation are not mutually exclusive in the same sample.
As previously reported by Poole et al. [35], a large overlap exists between gene expression profiles in nasal and bronchial brushings (rho=0.943). Some differences can be explained by the presence of specific populations of immune cells. This is the case for MARCO, a marker of macrophages, which is more highly expressed in bronchi. However, differences can also be intrinsic to the two epithelia and a signature specific to the same tissue was easily identified and consistently observed in the three independent experimental groups. A striking observation was the robust expression in nasal epithelium of well-established neuronal markers. The expression of neuronal markers, such as OTX2, PAX6, SIX3 and FOXG1, has been confirmed in primary cultures of nasal epithelia [9, 36], suggesting intrinsic expression in nasal EC rather than contamination by olfactory or sensory neurons, which are absent in bronchi. Additional evidence comes from immuno-labelling experiments, in which some of these proteins have been detected in the nuclei of nasal but not bronchial EC (e.g. www.proteinatlas.org/ENSG00000007372-PAX6/antibody).
We noticed the extreme variability of the cellular composition in nasal brushings. Compared with bronchial samplings, nasal samplings more frequently displayed a lower percentage of EC and an excessive number of inflammatory cells, mostly PMN. As this situation occurred in more than 30% of nasal samples, we suspect that such a sampling can introduce a strong bias due to the abundance of non-EC. In addition, we noticed that the quality of the bronchial samples remained quite stable over the full study, even with the lower quality of the corresponding nasal-brushing samples and in the context of mild-to-moderate asthma. We emphasise the importance of a careful checking of the cellular composition of brushings before undergoing any gene expression study [37].
We initially considered the Th2 signature defined by Woodruff et al. [8], which comprises the three transcripts POSTN, CLCA1 and SERPINB2. The CLCA1 and SERPINB2 transcripts were strongly differentially expressed between the nose and bronchi (adjusted p<0.001 and adjusted p=0.0013, respectively) (supplementary figure E3). These results led us to test a larger list of IL-13 responsive transcripts, differentially expressed in nasal as well as in bronchial cells, in order to define a Th2 signature that could be interoperable between these two tissues. We derived this new 28-transcript signature from four independent studies using nasal, tracheal and bronchial cells. After some optimisation we restricted this new set to a four-gene signature including POSTN, previously used by Woodruff et al., ALOX15 which has been linked to asthma in functional studies and CST1 and FETUB. CST1 and FETUB were the most differentially expressed between the AR and C groups, and between the R and C groups, in nasal cells as well as in bronchial cells. The functions of these two cystatins in the context of asthma are unknown. This four-transcript signature defines a strong Th2 response that is common to nasal and bronchial EC, with a clear clinical relevance to asthma and allergic rhinitis. Th17 and IFN signatures were derived from recently published studies.
All patients in our AR group had a Th2-high level in bronchi, probably explained by the selection of our asthmatic cohort (young, atopic mild asthma). The degree of correlation between the nose and bronchi can first be considered as acceptable in the AR group, with an average level of 71%. At the same time, this value is probably insufficiently high and its use would probably lead to misdiagnosis in an excessive number of Th2 subjects. Indeed, two nasal samples were Th2-low (the bronchi being high) but were at the same time Th17 and/or IFN high. Different signatures can consequently co-exist at different levels of the same airway epithelium. The Th17 and IFN signatures are probably driven by a more important exposure of the nose to viruses, bacteria, irritants and pollutants, and by a more robust nasal antiviral response [27].
The R group appears to be much more heterogeneous, with some patients even displaying a Th2-low score in the nose. This situation may indicate that Th2 signalling has a lower impact on allergic rhinitis than on asthma in adults. We also noticed a very high degree of IFN response in R group nasal EC (seven out of 10 R group patients being IFN-high, including five who were also Th17-high). Of note, patient R14 displayed a triple high status in nasal epithelium (Th2, Th17 and IFN). In the subset of R group patients who displayed a Th2-high score in the bronchi, all appeared to have a history of childhood asthma or asthma with clinical remission. This suggests that a high bronchial Th2 status may persist for a long time after clinical remission of disease.
Quantitative Th2 scores were defined by the median of z-scores for the four genes that defined our Th2 signature. This approach was applied in nasal and bronchial brushings, defining for each patient a Th2 nasal score and a Th2 bronchial score [38], and it was used to investigate possible relationships with clinical parameters. Th2 scores in nasal and bronchial samples correlated well with mast cell infiltration of the two epithelia together with the number of sensitisations (figure 4). These observations are in line with the description of allergic inflammation, including an increased membrane basement thickness and an epithelial desquamation in the bronchi of atopic subjects even before the onset of clinical symptoms [39]. Th17 scores correlated well with PMN infiltration and lower EC percentage. IFN scores were significantly higher in the nose compared to the bronchi. This could correspond to a different level of innate immunity in each tissue, as suggested by the more robust anti-rhinovirus response in the nose [27]. In this study, the association of IFN, Th2 and Th17 inflammation in the same nasal samples and of Th2 and Th17 inflammation in the same bronchial samples indicates moreover that the new inflammatory pathways of asthma are not strictly mutually exclusive as previously evoked [15]. This phenomenon occurs despite a reciprocal regulation that has long been described between IFN and Th2 inflammation in the bronchi [40] leading to distinct phenotypes [16]. IFN scores in bronchial samples were correlated to FEV1 and forced vital capacity (FVC) in asthmatic patients, as described previously by Bhakta et al. [16].
Our study has some restrictions. First, the AR group comprised a majority of Th2-high subjects, even though we anticipated an inclusion of 50% Th2-low subjects in this group, based on the report by Woodruff et al. [17]. Th2-low subjects can represent up to 70% of patients in cohorts like U-BIOPRED containing a high percentage of severe asthma [30]. Our high percentage of Th2-high AR patients may be related to the younger age of our allergic groups (14 years younger on average than those of Woodruff et al. and 27 years younger than U-BIOPRED) combined with our choice to select only allergic subjects. Our complete asthmatic group had a median number of positive skin prick-tests similar to the Woodruff Th2-high group. Another potential difference with U-BIOPRED and Woodruff's studies is the lower severity of our asthmatic cohort. We included patients with mild-to-moderate persistent asthma and only two of these patients had asthma that was not fully controlled. Overall, our patients had a better FEV1 compared with Woodruff's group (91.4% versus 87%). Some of our results may thus not apply well to patients with severe asthma.
A second limitation of our study is the initial exclusion of 30% of patients from our cohort due to an insufficient percentage of EC in the nasal samples. This value is similar to the percentage measured in a previous study [9], where 21% of the nasal samples (eight out of 38 patients) contained less than 80% EC, even after exclusion of patients who tested positive for respiratory viruses. As our bronchial samples had higher cell counts, we decided to exclude patients with an insufficient percentage of nasal EC, so that a meaningful comparison between the paired nasal/bronchial samples could be made. Our work was consequently restricted to samples with a high percentage of EC. This does not preclude a future use of more heterogeneous samples to assess Th2 status, after having defined highly specific markers for the epithelial inflammation.
The last limitation is the cross-sectional nature of our study preventing driving conclusions on the origin and stability of non-Th2 inflammatory profiles over time [41]. However, this was partially compensated by the detection of viral sequences in RNA sequencing data.
Conclusion
The nasal epithelium displays a gene expression profile that slightly, but consistently, differs from the bronchial epithelium. Infiltration by PMN is more frequent in the nose, leading to unsuitable samples in up to 30% of cases. The remaining nasal samples displayed a consistently higher IFN response, probably linked with inter-current environmental exposures. Collectively, our results suggest that nasal samples cannot be reliably used as surrogates for bronchial epithelium to assess Th2 status in asthma. In addition, in isolated allergic rhinitis, asthma remission is not associated with a switch from high to low Th2 status, showing the long-lasting nature of high Th2 status and inflammation, which persist long after clinical remission.
Supplementary material
Supplementary Material
Please note: supplementary material is not edited by the Editorial Office, and is uploaded as it has been supplied by the author.
Supplementary materials and methods. ERJ-00437-2018_Supplement
Table E1. Subject characteristics (n=39). ERJ-00437-2018_Table_E1
Table E2. Comparison of nasal and bronchial cells within groups (n=39). ERJ-00437-2018_Table_E2
Table E3. Comparison between included (n=26) and excluded (n=13) subject characteristics. ERJ-00437-2018_Table_E3
Table E4. 63 most-regulated genes between nasal and bronchial cells in healthy subjects (C). ERJ-00437-2018_Table_E4
Figure E1. Flow chart of the study. ERJ-00437-2018_Figure_E1
Figure E2. Differential gene expression between nasal and bronchial tissues (323 transcripts). Unsupervised hierarchical clustering of the RNAseq data based on a set of the 323 most differentially expressed genes (adjusted p-value <0.05 and an abs(log2 FC)>2). Each square represents the expression level of a given gene in a given sample relative to the average expression level in all samples. A red-to-blue color scale indicates gene expression levels above (red) or below (blue) the average level of expression for this same gene. ERJ-00437-2018_Figure_E2
Figure E3. Biological theme analysis of nose/bronchus signature. Physiological system development and functional categories found to be significantly affected in an Ingenuity Pathway Analysis® downstream effect analysis of a selection of 323 genes differentially expressed between nasal and bronchial samples (adjusted p-value <0.05 and an abs(log2 FC)>2). Bars represent the strength of the statistical significance. ERJ-00437-2018_Figure_E3
Figure E4. Boxplots showing the expression in AR, R and C samples from the nose and bronchi for the 28 transcripts defining the initial Th2 gene signature, defined from GSE19190, GSE110799, GSE37693 and GSE4804. Distribution of expression levels (log2) in each experimental group for the 28-gene set of our Th2 signature. Footnotes: B: bronchus; N: nose; AR: allergic rhinitis and asthma group; R: isolated allergic rhinitis group; C: healthy controls. ERJ-00437-2018_Figure_E4
Figure E5. Hierarchical clustering based on initial Th2 gene signature. Unsupervised hierarchical clustering of the RNAseq data based the initial 28 genes Th2 signature. Each square represents the expression level of a given gene in a given sample relative to the gene average expression level in all samples. A red-to-blue color scale indicates gene expression levels above (red) or below (blue) the average level of expression for the same transcript. Footnotes: B: bronchus; N: nose; AR: allergic rhinitis and asthma group; R: isolated allergic rhinitis group; C: healthy controls. ERJ-00437-2018_Figure_E5
Figure E6. Heatmap of Pearson correlation between Th2 markers. Unsupervised hierarchical clustering of the pairwise correlations between Th2 markers. Each square represents the Pearson correlation coefficient between 2 genes. A red-to-blue color scale indicates positive (red) or negative (blue) correlation. ERJ-00437-2018_Figure_E6
Figure E7. Hierarchical clustering based Th2, Th17 and IFN gene signature. Unsupervised hierarchical clustering of the RNAseq data based on the (A) initial 4-genes Th2 signature (B) Th17 signature, (C) IFN signature. Each square represents the expression level of a given gene in a given sample relative to the gene average expression level in all samples. A red-to-blue color scale indicates gene expression levels above (red) or below (blue) the average level of expression for the same transcript. Footnotes: B: bronchus; N: nose; AR: allergic rhinitis and asthma group; R: isolated allergic rhinitis group; C: healthy controls. ERJ-00437-2018_Figure_E7
Figure E8. Th2 score of bronchial samples in the R group as a function of asthma history. Boxplots of Th2 score in the bronchial samples from the patients belonging to the R group according to clinical history. *: p-value <0.05. Footnotes: A: asthma history; EW: isolated wheeze on exertion history; N: no asthma or wheeze on exertion history. ERJ-00437-2018_Figure_E8
Figure E9. Hierarchical clustering based on an enlarged IFN gene signature. Unsupervised hierarchical clustering of the RNAseq data based on an extended 33-gene IFN signature. Each square represents the expression level of a given gene in a given sample relative to the gene average expression level in all samples. A red-to-blue color scale indicates gene expression levels above (red) or below (blue) the average level of expression for the same transcript. Footnotes: B: bronchus; N: nose; AR: allergic rhinitis and asthma group; R: isolated allergic rhinitis group; C: healthy controls. ERJ-00437-2018_Figure_E9
Figure E10. IFN score in nasal and bronchial samples. Boxplots of IFN score in the nasal and bronchial samples (score based on the 33 genes signature), in the (A) whole dataset and (B) removing the four samples with the highest scores. ERJ-00437-2018_Figure_E10
Footnotes
This article has supplementary material available from erj.ersjournals.com
This study is registered at ClinicalTrials.gov with identifier number NCT01923519. All of the individual participant data collected during the trial, after de-identification will be available to researchers who provide a methodologically sound proposal immediately after publication; no end date. Study protocol and analytic code will also be available. Proposals should be directed to the corresponding author. To gain access, data requestors will need to sign a data access agreement.
Conflict of interest: None declared.
Support statement: This work was supported by the Fond de Recherche en Santé Respiratoire ARARD (2013), the Association RESPIR, the Agence Nationale pour la Recherche (ANR-12-BSV1-0023) and the Fondation pour le Recherche Médicale (FRM; DEQ20180339158). DNA sequencing was achieved with the UCAGenomiX platform of the Institut de Pharmacologie Moléculaire et Cellulaire (IPMC), a member of the “France Génomique” national infrastructure (ANR-10-INBS-09-03, ANR-10-INBS-09-02). Funding information for this article has been deposited with the Crossref Funder Registry.
- Received March 2, 2018.
- Accepted August 13, 2018.
- Copyright ©ERS 2018
References


