


Abstract
Evidence for the effects of air pollution exposure on lung function growth into adolescence is scarce. We investigated associations of air pollution exposure with lung function and lung function growth until age 16.
We conducted both longitudinal (n=915) and cross-sectional (n=721) analyses of associations of air pollution exposure with forced expiratory volume in 1 s (FEV1) and forced vital capacity (FVC) growth from ages eight to 16 and FEV1 and FVC at age 16. We estimated residential concentrations of nitrogen dioxide (NO2), “soot” and particulate matter (PMx, where x is the 50% cut-off aerodynamic diameter in µm) with diameters of <2.5 µm (PM2.5), <10 µm (PM10) and 2.5–10 µm (PMcoarse) during the preschool, primary school and secondary school time windows by land use regression models. Associations with (growth in) FEV1 and FVC were analysed by linear (mixed effects) regression.
Higher air pollution exposure was associated with reduced FEV1 growth (e.g. adjusted difference −0.26% (95% CI −0.49 to −0.03%) per interquartile range increase in secondary school PM2.5) and lower FEV1 (adjusted difference −2.36% (95% CI −3.76 to −0.94%)), but was not adversely associated with FVC. Associations with FEV1 were stronger in boys than girls and were not modified by asthma status.
Higher air pollution exposure may lead to increased airway obstruction, but not reduced lung volume in adolescence.
Abstract
Air pollution exposure may be associated with increased airway obstruction but not reduced lung volume until age 16 http://ow.ly/3Vf330lhLkT
Introduction
Air pollution exposure has been shown to adversely affect the respiratory health of children [1]. The role of air pollution exposure in lung function growth has also been determined [2–5]; however, the effects of air pollution exposure over the whole lifetime have rarely been investigated. Understanding the effects of lifetime air pollution exposure on health can provide essential insights into the relevance of exposure during different time windows and provide guidance on the timing and structure of interventions to successfully improve respiratory health [6].
Until now, mainly air pollution exposure during distinct age ranges has been investigated. Several studies in children and adolescents aged 8–16 years [7–10] have reported adverse associations of exposure with lung function within the first 3 years of life, while a recent multi-cohort study has reported associations with exposures in the range 6–8 years [11].
There are currently few longitudinal studies of the association between air pollution exposure and lung function in adolescence [2, 10, 12]. The Children's Health Study (CHS) [2, 5] in Southern California has presented strong evidence for an association between air pollution exposure and lung function growth from 10–18 years. Higher exposure from study entry (∼10 years) was associated with reduced growth in forced expiratory volume in 1 s (FEV1) by age 18 [2]. Similarly, the Swedish Children, Allergy, Milieu, Stockholm, Epidemiological Survey (BAMSE) study [10] reported an association between early life air pollution exposure and lower lung function at age 16.
Lung function reaches its maximum in early adulthood. Reduced growth, resulting in low maximum attained level of lung function in early adulthood, may be associated with an increased risk of developing chronic obstructive pulmonary disease (COPD) later in life [13, 14]. This makes research on the persistence of air pollution effects since birth an essential health interest. Therefore, we investigated associations of air pollution exposure from birth with lung function growth from ages eight to 16 and lung function at age 16. Since differences in associations of air pollution with lung function have been suggested between boys and girls and between asthmatics and nonasthmatics [2, 7, 12], we also explored possible effect modification by sex and asthma status. Currently, evidence for potential interactions with sex and asthma status is mixed and, therefore, there is no expected direction for these interactions.
Methods
Study design and study population
This study was performed within the Dutch population-based Prevention and Incidence of Asthma and Mite Allergy (PIAMA) birth cohort study [15]. Briefly, pregnant women were recruited in 1996/1997 from Northern, Western and Central regions of The Netherlands. The cohort started with 3963 newborns. Data on lifestyle, household and health characteristics were collected through questionnaires completed by parents during pregnancy, at 3 months, annually till age eight, and at ages 11, 14 and 16. At ages eight, 12 and 16, lung function was measured as part of medical examinations. The current study populations consist of participants with air pollution exposure data and 1) at least two lung function measurements throughout follow-up for longitudinal analysis (n=915) and 2) lung function measurements at age 16 for cross-sectional analysis (n=721; supplementary figure S1). Ethical approval was obtained from the ethical review boards of participating institutes and written informed consent was obtained from participants as well as their parents/legal guardians.
Lung function measurements
FEV1 and forced vital capacity (FVC) were measured by spirometry at ages eight, 12 and 16. At ages eight and 12, 1058 and 1292 participants from all three regions of the country had successful lung function measurements, respectively. At age 16, participants from Northern and Central regions of the Netherlands (n=2159) were invited for medical examination. Successful lung function measurements were obtained in 721 cases. We used Jaeger pneumotachographs (Viasys Healthcare, Conshohocken, PA, USA) at age eight and EasyOne spirometers (ndd Medical Technologies Inc, Zurich, Switzerland) at age 12. Both Jaeger Masterscreen pneumotachographs (CareFusion, Yoba Linda, CA, USA) and EasyOne spirometers were used at age 16. All measurements were performed following the recommendations of the American Thoracic Society (ATS)/European Respiratory Society (ERS) [16]. For each participant, at least three acceptable manoeuvres were required. In addition, test results were included which did not meet these criteria (difference between the largest and next largest values for FEV1 and FVC ≤150 mL), but which were obtained from otherwise technically acceptable flow–volume curves (differences between the largest and next largest values for FEV1 and FVC ≤200 mL; n=190 at age 12 and n=76 at age 16), as in previous analyses [17]. Since different spirometers were used at age 16, we compared the spirometers in 49 volunteers in a separate experiment and calibrated measurements performed with the EasyOne spirometer using regression equations obtained from the comparison, as delineated in equations 1 and 2 below (values in parentheses (0.05/0.01) are the standard errors of the regression coefficients preceeding them).
 1
1 2
2Air pollution exposure assessment
We used land use regression (LUR) models to estimate annual average concentrations of nitrogen dioxide (NO2) and particulate matter (PMx, where x is the 50% cut-off aerodynamic diameter in µm) with diameters of <2.5 µm (PM2.5), <10 µm (PM10) and 2.5–10 µm (PMcoarse), as well as PM2.5 absorbance (“soot”, defined as reflectance of PM2.5 filters) at the participants' home addresses throughout follow-up, as described elsewhere [18, 19]. Concisely, three 2-week measurements of NO2 were performed at 80 sites in the study area between October 2008 and February 2010. Simultaneous measurements of PM2.5, PM10, PMcoarse and PM2.5 absorbance were performed at 40 of these sites. The three measurements were averaged to obtain the annual average concentration for each site [20, 21]. Variables such as nearby traffic, household density and land use derived from Geographic Information Systems (GIS) were used as predictor variables in LUR model development [18, 19]. Substantial variability in annual average concentrations was explained for NO2, PM2.5, PM10 and PM2.5 absorbance (R2 leave one out cross validation (R2LOOCV)=0.61–0.89) but not for PMcoarse (R2LOOCV=0.38) [18, 19].
We used complete residential histories from birth until the 16-year lung function measurements to estimate average air pollution exposures during different time windows as follows: preschool (birth–4 years), primary school (5–12 years) and secondary school (13–16 years). Participant's occupancy at an address was used as weight in calculation of time window specific average concentrations.
Confounding variables
Information on potential confounders was obtained from parental-completed questionnaires. The following set of a priori selected potential confounders was considered: age, sex, weight, height, parental education (maximum of either maternal or paternal education), maternal and paternal atopy, breastfeeding, respiratory infections in the last 3 weeks before lung function measurement, Dutch nationality (both parents born in The Netherlands), maternal smoking during pregnancy, indoor tobacco smoke exposure in the home, furry pets in the home, moulds in the home, gas cooking during the first year of life and average air pollution concentrations during the 7 days preceding lung function measurements retrieved from the Dutch National Air Quality Monitoring Network.
Statistical analyses
Lung function was log-transformed in all analyses because of the strongly nonlinear relationships between lung function, age, height and weight [22, 23]. Associations with different pollutants were assessed in separate models with concentrations as continuous variables assuming a linear dose–response relationship without threshold. Both longitudinal and cross-sectional analyses were initially adjusted for sex, age, log-transformed height and weight at time of lung function measurements, and then additionally adjusted for all other potential confounders. Associations are presented as percentage differences in lung function and 1-year lung function growth for an interquartile range (IQR) increase in exposure to facilitate comparison of estimates between pollutants. The same IQRs were used in all analyses. Percentage differences were calculated from estimated regression coefficients (β) as (eβ×IQR–1)×100. We performed complete case analyses and excluded participants with missing data for one or more potential confounders from additionally adjusted longitudinal (n=44) and cross-sectional analyses (n=50). Results of crude analyses did not differ between all participants and the subset with complete information on all potential confounders (data not shown).
Longitudinal analysis of lung function growth from ages eight to 16
We used linear mixed effects models with random subject intercepts and exposure–age interaction terms to assess associations of air pollution exposure with lung function growth from ages eight to 16. The interaction terms can be directly interpreted as the association of air pollution exposure with annual rate of change in lung function. Only the preschool time window was used in longitudinal analyses to ensure that exposure precedes outcome.
Cross-sectional analysis of lung function at age 16
We used linear regression to assess associations of air pollution exposure with lung function at age 16. Associations with exposure during different windows were assessed in separate models.
Sensitivity analyses
We performed stratified analyses by sex and asthma status. We also explored the independence of associations of exposure during different time windows in movers with lung function at age 16 using multiple time window models. We only included preschool and secondary school time window exposures in one model because models with other combinations of time windows led to multicollinearity problems (variance inflation factors (VIFs) >3). All analyses were performed using SAS version 9.4 (SAS Institute Inc, Cary, NC, USA) with significance levels of 0.05.
Results
Population characteristics
Study population characteristics for longitudinal and cross-sectional analyses and distributions of lung function variables are presented in table 1. More than 60% of the participants had at least one highly educated parent, more than 30% had an atopic father and more than 30% had an atopic mother. Of the participants, 20% were exposed to indoor tobacco smoke in the home during early life. At age 16, the mean±sd value for FEV1 was 3.9±0.7 L and 4.7±0.8 L for FVC (table 2). Characteristics of study populations and the PIAMA baseline cohort were generally similar, except for a higher percentage of participants with an atopic mother in the longitudinal analysis population and a higher percentage of highly educated parents in both study populations (supplementary table S1). Of the participants, 62% changed address (were movers) at any time between the preschool time window and the 16-year lung function measurements. Population characteristics were not different between movers and nonmovers (supplementary table S2).
Population characteristics for the two study populations
Distribution of age, height, weight, body mass index (BMI), forced expiratory volume in 1 s (FEV1) and forced vital capacity (FVC) for the two study populations
Air pollution exposure
The distributions of estimated average air pollution levels for longitudinal and cross-sectional analyses populations were similar (table 3 and supplementary table S3). Air pollution levels were consistent between time windows with means slightly decreasing over time for NO2 and PM2.5 absorbance. Consequently, exposure during the secondary school time window was slightly lower than exposure during the preschool time window in movers (supplementary table S4). Variation in exposure levels was larger for NO2 and PM2.5 absorbance than for particulate matter mass, and NO2, PM2.5 absorbance, PM2.5 and PM10 concentrations were moderately to highly correlated within time windows (r=0.53–0.96, supplementary tables S5 and S6). Moderate to high correlations were also observed for concentrations of the same pollutant between time windows (r=0.65–0.96) and these correlations were similar for movers (r=0.48–0.95, supplementary table S7).
Distribution of annual average exposure concentrations for time windows of exposure and short-term exposures, for the cross-sectional analyses population (n=721)
Longitudinal analyses of lung function growth from ages eight to 16
Exposure during the preschool time window was associated with reduced growth in FEV1 for all pollutants (e.g. the difference in 1-year growth in FEV1 was −0.31% (95% CI −0.47 to −0.14%) per 7.8 µg·m−3 increase in NO2 and −0.26% (95% CI −0.49 to −0.03%) per 1.2 µg·m−3 increase in PM2.5). Growth in FVC was not associated with air pollution exposure except for a positive association with PM2.5 (0.24% (95% CI 0.03 to 0.45%) per 1.2 µg·m−3) (table 4).
Additionally adjusted associations of average air pollution exposure in the preschool time window with lung function growth from age eight to age 16 (n=871)#
Cross-sectional analyses of lung function at age 16
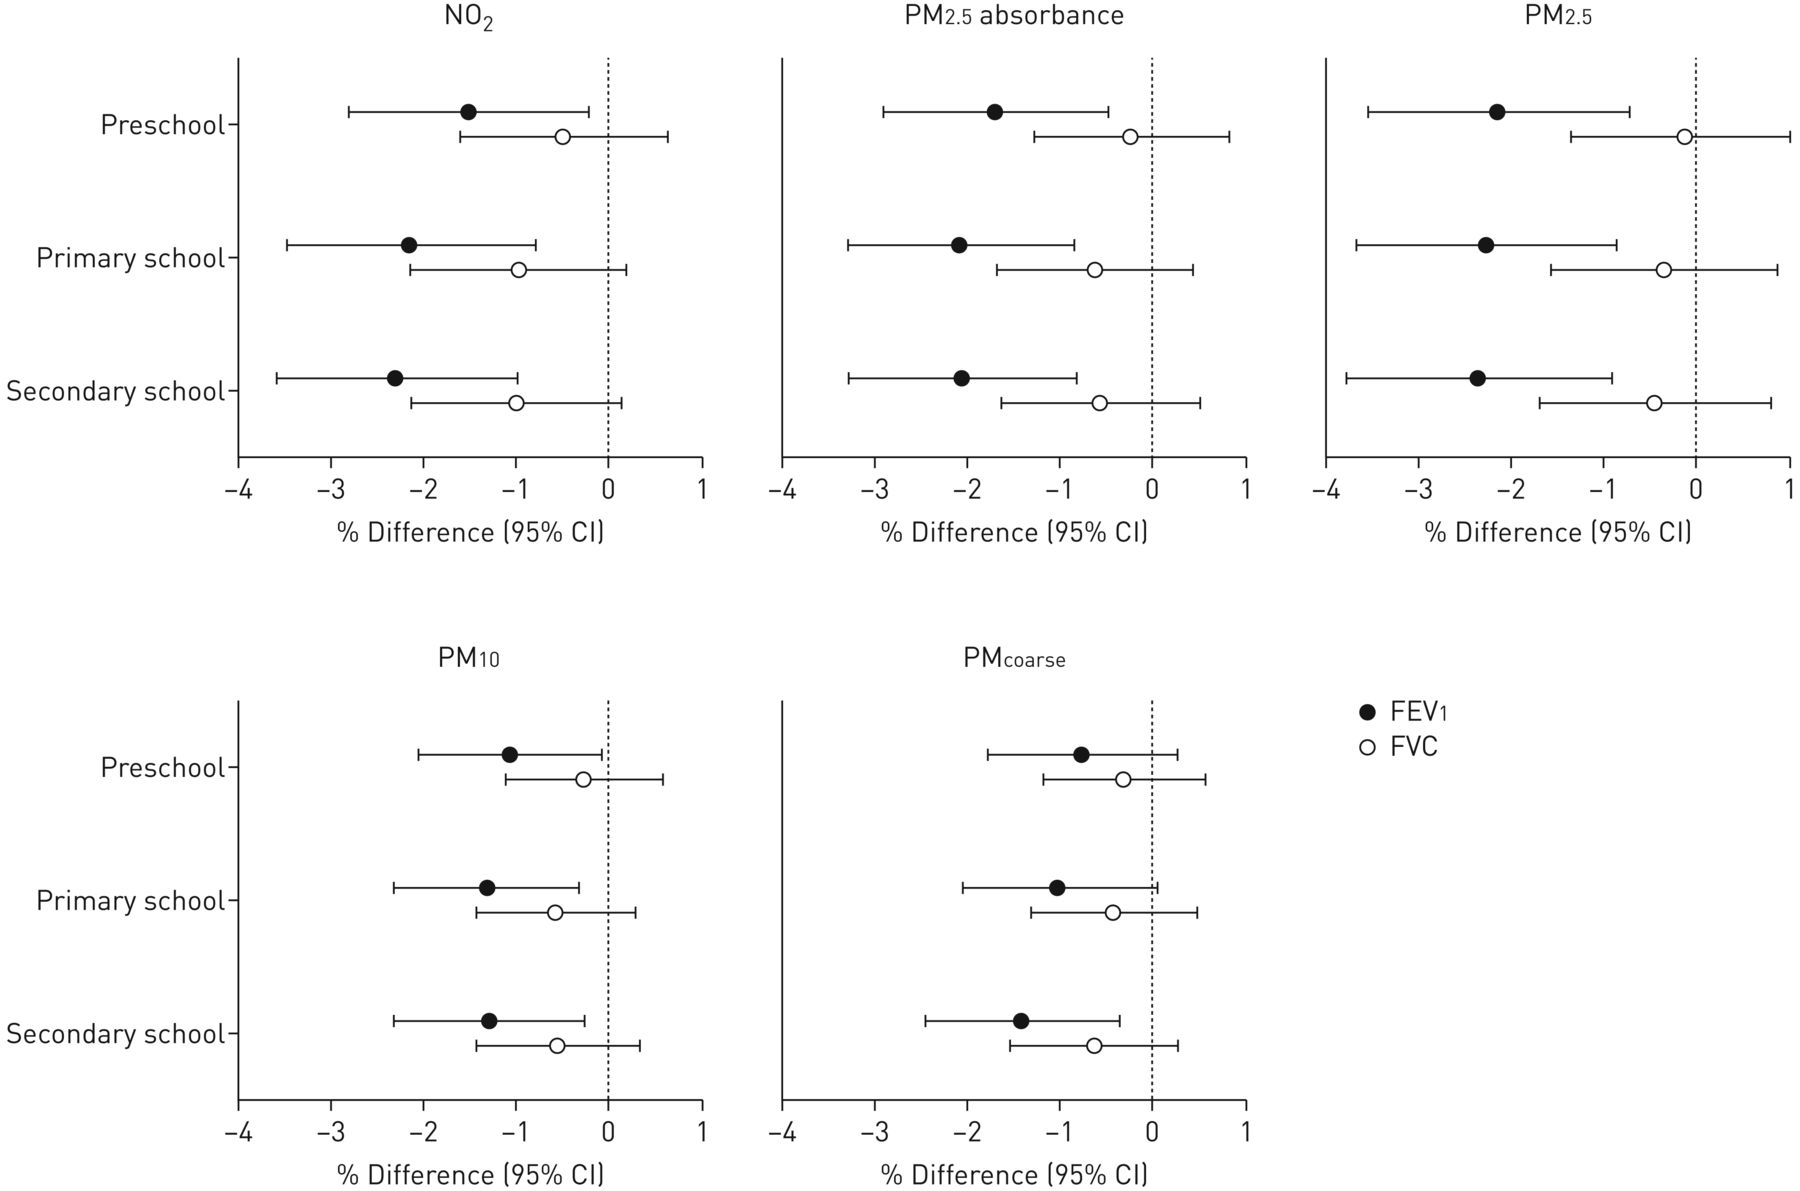
Associations of FEV1 and FVC at age 16 with air pollution exposure are shown in figure 1 and supplementary table S8. We observed lower FEV1 at age 16 with higher air pollution exposure (e.g. the percentage difference was −2.14% (95% CI −3.53 to −0.73%) per 1.2 µg·m−3increase in preschool PM2.5 and −1.29% (95% CI −2.31 to −0.26%) per 0.9 µg·m−3 increase in secondary school PM10). Association estimates were consistently negative for FVC at age 16, but none of the associations were statistically significant (e.g. −0.63% (95% CI −1.68 to 0.44%) per 0.3 10−5·m−1 increase in primary school PM2.5 absorbance and −0.64% (95% CI −1.54 to 0.26%) per 0.5 µg·m−3 increase in secondary school PMcoarse).

Additionally adjusted associations of time window average air pollution exposure with lung function at age 16 years (n=674). Adjusted for sex, age, log transformations of weight and height, parental education, maternal atopy, paternal atopy, breastfeeding, respiratory infections in the previous 3 weeks, Dutch nationality, indoor tobacco smoke exposure in the home at 3 months, maternal smoking in pregnancy, furry pets at 3 months, mould in the home at 1 year, gas cooking at 3 months, and average air pollution concentrations for the 7 days preceding the lung function measurement. Exposure increments: 7.8 µg·m−3 for NO2, 0.3×10⁻⁵ m−1 for PM2.5 absorbance, 1.2 µg·m−3 for PM2.5, 0.9 µg·m−3 for PM10 and 0.5 µg·m−3 for PMcoarse. FEV1: forced expiratory volume in 1 s; FVC: forced vital capacity; NO2: nitrogen dioxide; PMx: particles with a 50% cut-off aerodynamic diameter of x µm; PMcoarse: particles with a 50% cut-off aerodynamic diameter of 2.5–10 µm.
Sensitivity analyses
Negative associations of air pollution exposure with FEV1 growth and FEV1 at age 16 were stronger in boys than in girls, whereas associations with FVC were negative in boys and mostly positive in girls (figure 2 and supplementary tables S9 and S10). Associations of air pollution with FEV1 and FVC (growth) were not significantly different between asthmatics and nonasthmatics, but positive estimates for FEV1 in asthmatics at age 16 were observed (figure 2 and supplementary tables S9 and S11). Analyses with mutual adjustment of time windows showed lower FEV1 with higher air pollution exposure, mainly with secondary school time window exposure; however, estimates were attenuated for the preschool time window (supplementary table S12).

Additionally adjusted association of time window average air pollution exposure with forced expiratory volume in 1 s at age 16 years stratified by sex. Adjusted for age, log transformations of weight and height, parental education, maternal atopy, paternal atopy, breastfeeding, respiratory infections in the previous 3 weeks, Dutch nationality, indoor tobacco smoke exposure in the home at 3 months, maternal smoking in pregnancy, furry pets at 3 months, mould in the home at 1 year, gas cooking at 3 months, and average air pollution concentrations for the 7 days preceding the lung function measurement. Exposure increments: 7.8 µg·m−3 for NO2, 0.3×10⁻⁵ m−1 for PM2.5 absorbance, 1.2 µg·m−3 for PM2.5, 0.9 µg·m−3 for PM10 and 0.5 µg·m−3 for PMcoarse. NO2: nitrogen dioxide; PMx: particles with a 50% cut-off aerodynamic diameter of x µm; PMcoarse: particles with a 50% cut-off aerodynamic diameter of 2.5–10 µm.
Discussion
In the PIAMA birth cohort, we found that higher air pollution exposure from birth until age 16 was associated with reduced FEV1 growth from age eight to 16 and lower FEV1 at age 16, but not with reduced FVC and FVC growth.
Our findings concur with longitudinal studies that have reported associations of air pollution exposure with reduced lung function growth. The longitudinal CHS from the USA has demonstrated reduced lung function growth with increasing air pollution exposure in adolescents [2, 5]. Over an 8-year period, exposure to NO2 and PM2.5 was associated with reduced growth in FEV1 and FVC [2]. However, the CHS assessed exposure from study entry (∼10 years) and not exposure from birth. The Swedish BAMSE cohort study [10] addressed this gap and, in contrast to our findings, found that exposure to nitrogen oxides (NOx) and PM10 at the participants' home addresses during the first year of life was not associated with reduced lung function growth.
This study and the BAMSE study are, to our knowledge, the only two studies that have studied the association of air pollution exposure from birth to adolescence with lung function growth into adolescence. More longitudinal studies are warranted to confirm and add to these findings. A better understanding of the effects of air pollution exposure on subsequent lung function growth extending into adolescence and adulthood is imperative for preventive and management strategies in order to reduce the burden of respiratory diseases [24].
Associations of air pollution exposure with lung function have been reported in several studies in preschool and primary school children aged 5–11 years followed from birth [7–9, 11, 25], but analyses linking air pollution exposure to lung function until adolescence are scarce. A recent BAMSE study investigated the association of air pollution exposure from birth into adolescence with lung function in adolescents and reported associations of traffic-related air pollution exposure during the first year of life with lower FEV1 at age 16, but not during later time periods [10]. The German infant study on the influence of nutrition intervention plus environmental and genetic influences on allergy development (GINIplus)/influence of life style factors on the development of the immune system and allergies in East and West Germany plus the influence of traffic emissions and genetics (LISAplus) study [12] performed a similar analysis and reported no association of air pollution exposure at birth, 10 and 15-year addresses with lung function at 15 years, in contrast to our study. We previously reported that higher exposure to air pollution at the current address was associated with lower FEV1 at ages eight [11] and 12 [17], which suggests the importance of mid-childhood exposures in our cohort. Opportunities to compare air pollution concentrations between studies are limited as different methods have been used in different studies. However, comparisons can be made for the Swedish BAMSE and German GINIplus/LISAplus cohorts, because exposures have recently been estimated using a standardised methodology. Compared to The Netherlands, air pollution levels in Sweden are considerably lower; however, the Dutch concentrations are comparable to those measured in Germany [11]. Comparison of pollutant concentrations with other studies such as CHS is not straightforward because different exposure assessment methods were used. The present findings extend into adolescence and add that air pollution exposure has an impact on lung function until adolescence. Together with the findings of the BAMSE study, our results strengthen the conclusions of a recent review that air pollution exposure in early life, later life and exposure over the entire age range could be relevant [26].
We found higher air pollution exposure to be associated with lower FEV1 and reduced growth in FEV1, but found no indication for an adverse effect on FVC. This has also been observed in other studies [7, 27, 28]. Our results suggest that air pollution exposure affects the diameter of the airways and hence increases airway obstruction, but does not affect lung volume. However, current evidence is not sufficient to conclude that the effects of air pollution are limited to specific spirometric measures [29].
We observed associations of air pollution exposure with both reduced FEV1 growth and lower FEV1 in boys but not in girls, which is consistent with both CHS and BAMSE findings [2, 10]. The literature suggests that boys already present with a higher total number of alveoli and greater alveolar surface area at birth than girls and that they may have a pulmonary phenotype more susceptible to the adverse effects of air pollution exposure since they have narrower airways between infancy and adolescence [30]. However, the current literature is inconsistent with regard to a possible air pollution–sex interaction, as a number of studies in children have shown stronger associations between air pollution and lung function in girls [7, 31] and other studies have found no differences [12, 25]. The results of these studies are summarised in supplementary table S13. We observed reduced FEV1 growth in asthmatics and nonasthmatics with increasing air pollution exposure and lower FEV1 in nonasthmatics but not in asthmatics; however, the differences were not statistically significant. Associations with air pollution tended to be negative for FVC and FVC growth in both asthmatics and nonasthmatics. Although stronger negative associations with FEV1 have been reported in nonasthmatics than in asthmatics in the CHS and BAMSE cohorts [5, 10], we need to acknowledge that our study had few asthmatics and therefore was possibly underpowered to identify significant differences by asthma status. Earlier reports on interactions between air pollution and asthma are inconsistent (supplementary table S13). Most studies that investigate effect modification by asthma are likely underpowered to detect a difference and the literature seldom reports consistent stronger or weaker associations in asthmatics [26].
In mutually adjusted time window analyses, associations with exposure during the secondary school time window were more pronounced than associations with preschool exposure, suggesting that later life exposure could play a key role in the level of lung function of adolescents in our study.
An important strength of our study is the availability of repeated objective measurements of lung function and detailed individual exposure data from birth, allowing us to investigate effects of lifetime exposure. We also consider analysis of lung function growth into adolescence with exposure from birth as a major strength as, to the extent of our knowledge, only one other study [10] has done this.
This study also has several important limitations. Two different spirometers were used to measure lung function during the medical examination at 16 years of age. We acknowledge that systematic differences between measurements obtained by the two spirometers may affect the estimated air pollution exposure–lung function relationships. We therefore conducted a separate experiment in healthy volunteers and derived calibration equations to correct for systematic differences. The correlation between the readings from the two instruments was very high (0.98–0.99) and the calibration factor was estimated with great precision so that, after calibration, the impact of the use of different instruments on our findings is likely small.
We used spatial exposure models based on an air pollution measurement campaign performed in 2008–2010 to assess air pollution exposure from 1996/1997 (when children were born) until 2013/2014 (when 16-year lung function measurements were conducted) assuming constant spatial contrasts in air pollution levels since birth. Several studies have demonstrated the validity of LUR models over several years [32–34], supporting our assumption of constant spatial contrasts. In addition, measurement data from the Dutch National Air Quality Monitoring Network also show that annual average concentrations of NO2 and PM10 have not changed substantially between 2000 and 2007 [35]. We did not account for long-term temporal trends in air pollution levels since the beginning of the cohort. Therefore, the stronger associations with more recent exposure than with early life exposure could be partly attributed to measurement error, which may be larger for early life exposures because of the larger time difference with the LUR models measurement campaign.
Another limitation is that we used estimated residential exposure disregarding other sources of exposure (e.g. school address exposures). However, the correlation between home and school address exposures was moderate to high for NO2, PM2.5, PM2.5 absorbance and PM10 in our cohort (r=0.68–0.88 for primary school exposure and r=0.36–0.73 for secondary school exposure, supplementary table S14). Therefore, measurement error resulting from reliance on residential exposure is likely small.
We acknowledge the difficulty in disentangling effects in the different time windows because pollution levels during the different time windows were correlated. Therefore, effects of exposure in later life may reflect effects from earlier life exposures. However, we attempted to disentangle preschool time window exposure from secondary school time window exposure in movers and results suggested a greater importance of later life exposures for lung function in adolescence.
The prevalence of maternal atopy was higher in the longitudinal study population than in the source population due to overrepresentation of children of atopic mothers invited for lung function measurements at age eight. There were also more children from highly educated parents in the study population compared to the baseline PIAMA population, which may limit the generalisability of our findings to the full PIAMA cohort and to the general population.
In conclusion, higher air pollution exposure may lead to increased airway obstruction, but not to reduced lung volume, in adolescence. We have contributed to limited knowledge on the potential impact of air pollution exposure on lung function development throughout childhood and into adolescence.
Supplementary material
Supplementary Material
Please note: supplementary material is not edited by the Editorial Office, and is uploaded as it has been supplied by the author.
Supplementary material ERJ-00218-2018_Supplement
Acknowledgements
The authors thank all the children and their parents for their participation, all the field workers and laboratory personnel involved for their efforts and Marjan Tewis (Institute for Risk Assessment Sciences (IRAS), Utrecht University) for data management.
Footnotes
This article has supplementary material available from erj.ersjournals.com
Conflict of interest: G.H. Koppelman reports grants from the Lung Foundation of the Netherlands, during the conduct of the study; grants from the Lung Foundation of the Netherlands, the Ubbo Emmius Foundation, the TETRI Foundation and TEVA Netherlands, outside the submitted work. All funds were paid to G.H. Koppelman's institution.
Support statement: This study was funded by the Lung Foundation of the Netherlands, project number 4.1.14.001. Funding information for this article has been deposited with the Crossref Funder Registry.
- Received January 31, 2018.
- Accepted July 31, 2018.
- Copyright ©ERS 2018
References


