


Figures
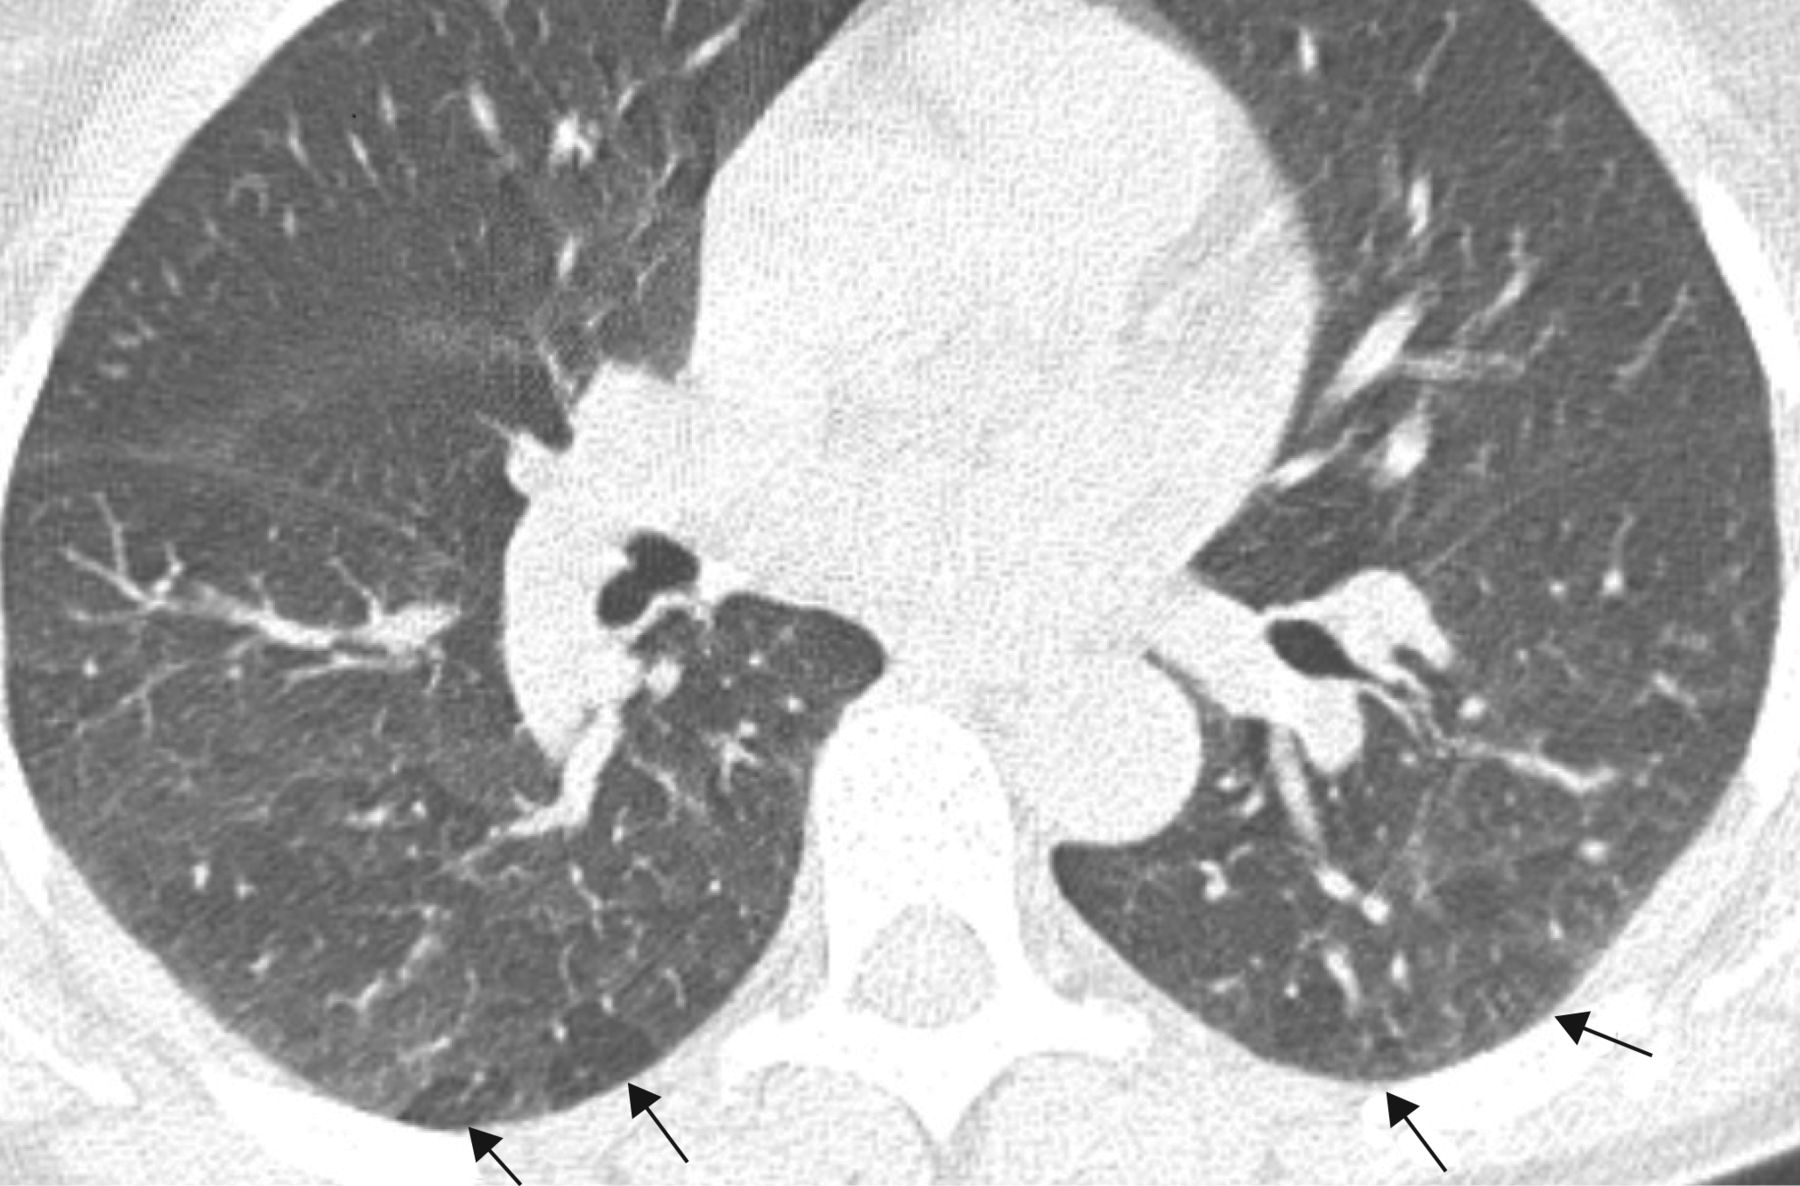
- FIGURE 1
Expiratory thin-section computed tomography in a 50-year-old male smoker with normal lung function, demonstrating regional air trapping as patchy area of low attenuation located mainly at dependent area of the right and left lower lobes (arrows).
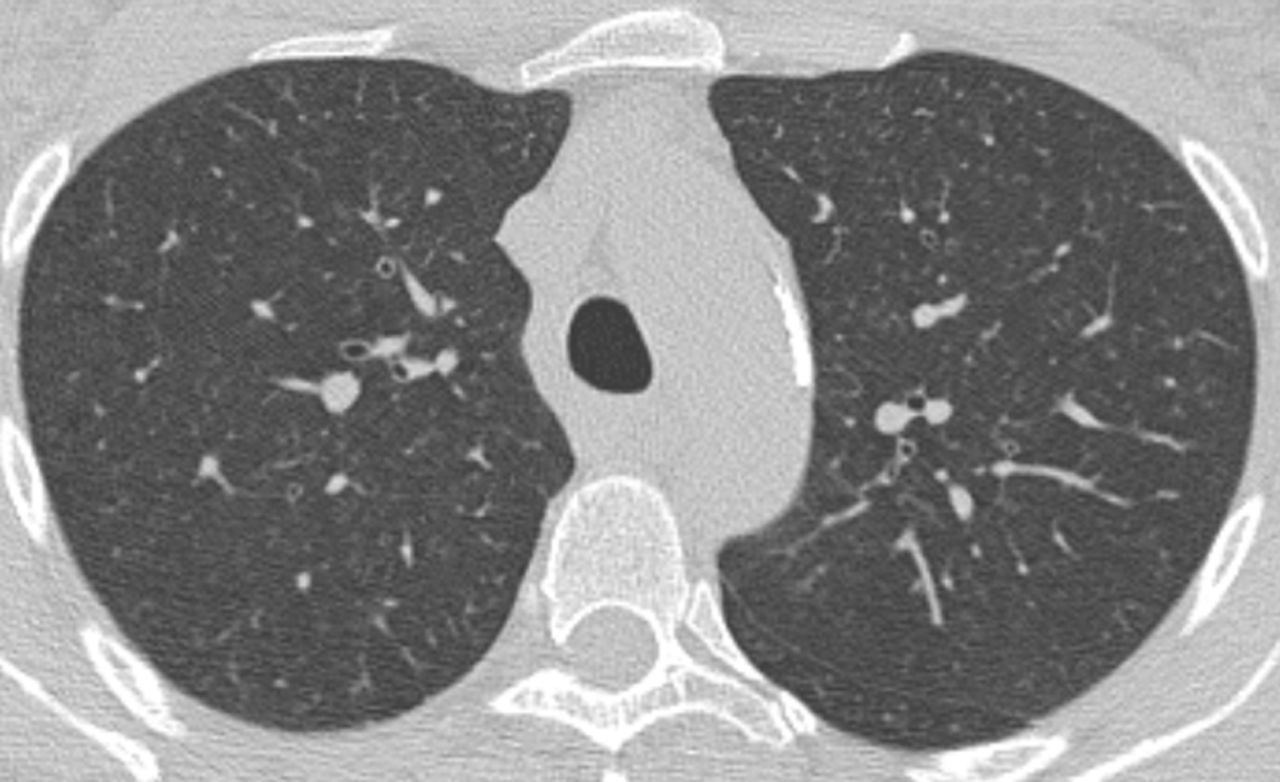
- FIGURE 2
Axial inspiratory thin-section computed tomography of a 48-year-old female smoker with normal spirometry. At the level of the upper lobes micronodules can be visualised as indistinct and ill-defined ground glass attenuation. These are more abundant at the anterior and central part of left upper lobe. Bronchial wall thickening is also present.
- FIGURE 3
Ratio between mean lung attenuation at expiration and inspiration (E/I ratio) in never smokers, smokers and chronic obstructive pulmonary disease (COPD) patients. Half-filled symbols represent individuals with regional air trapping and filled symbols indicate individuals without regional air trapping. Note that smokers seems to be divided in two different subgroups based on the presence of regional air trapping while the never smokers are mixed homogenously.
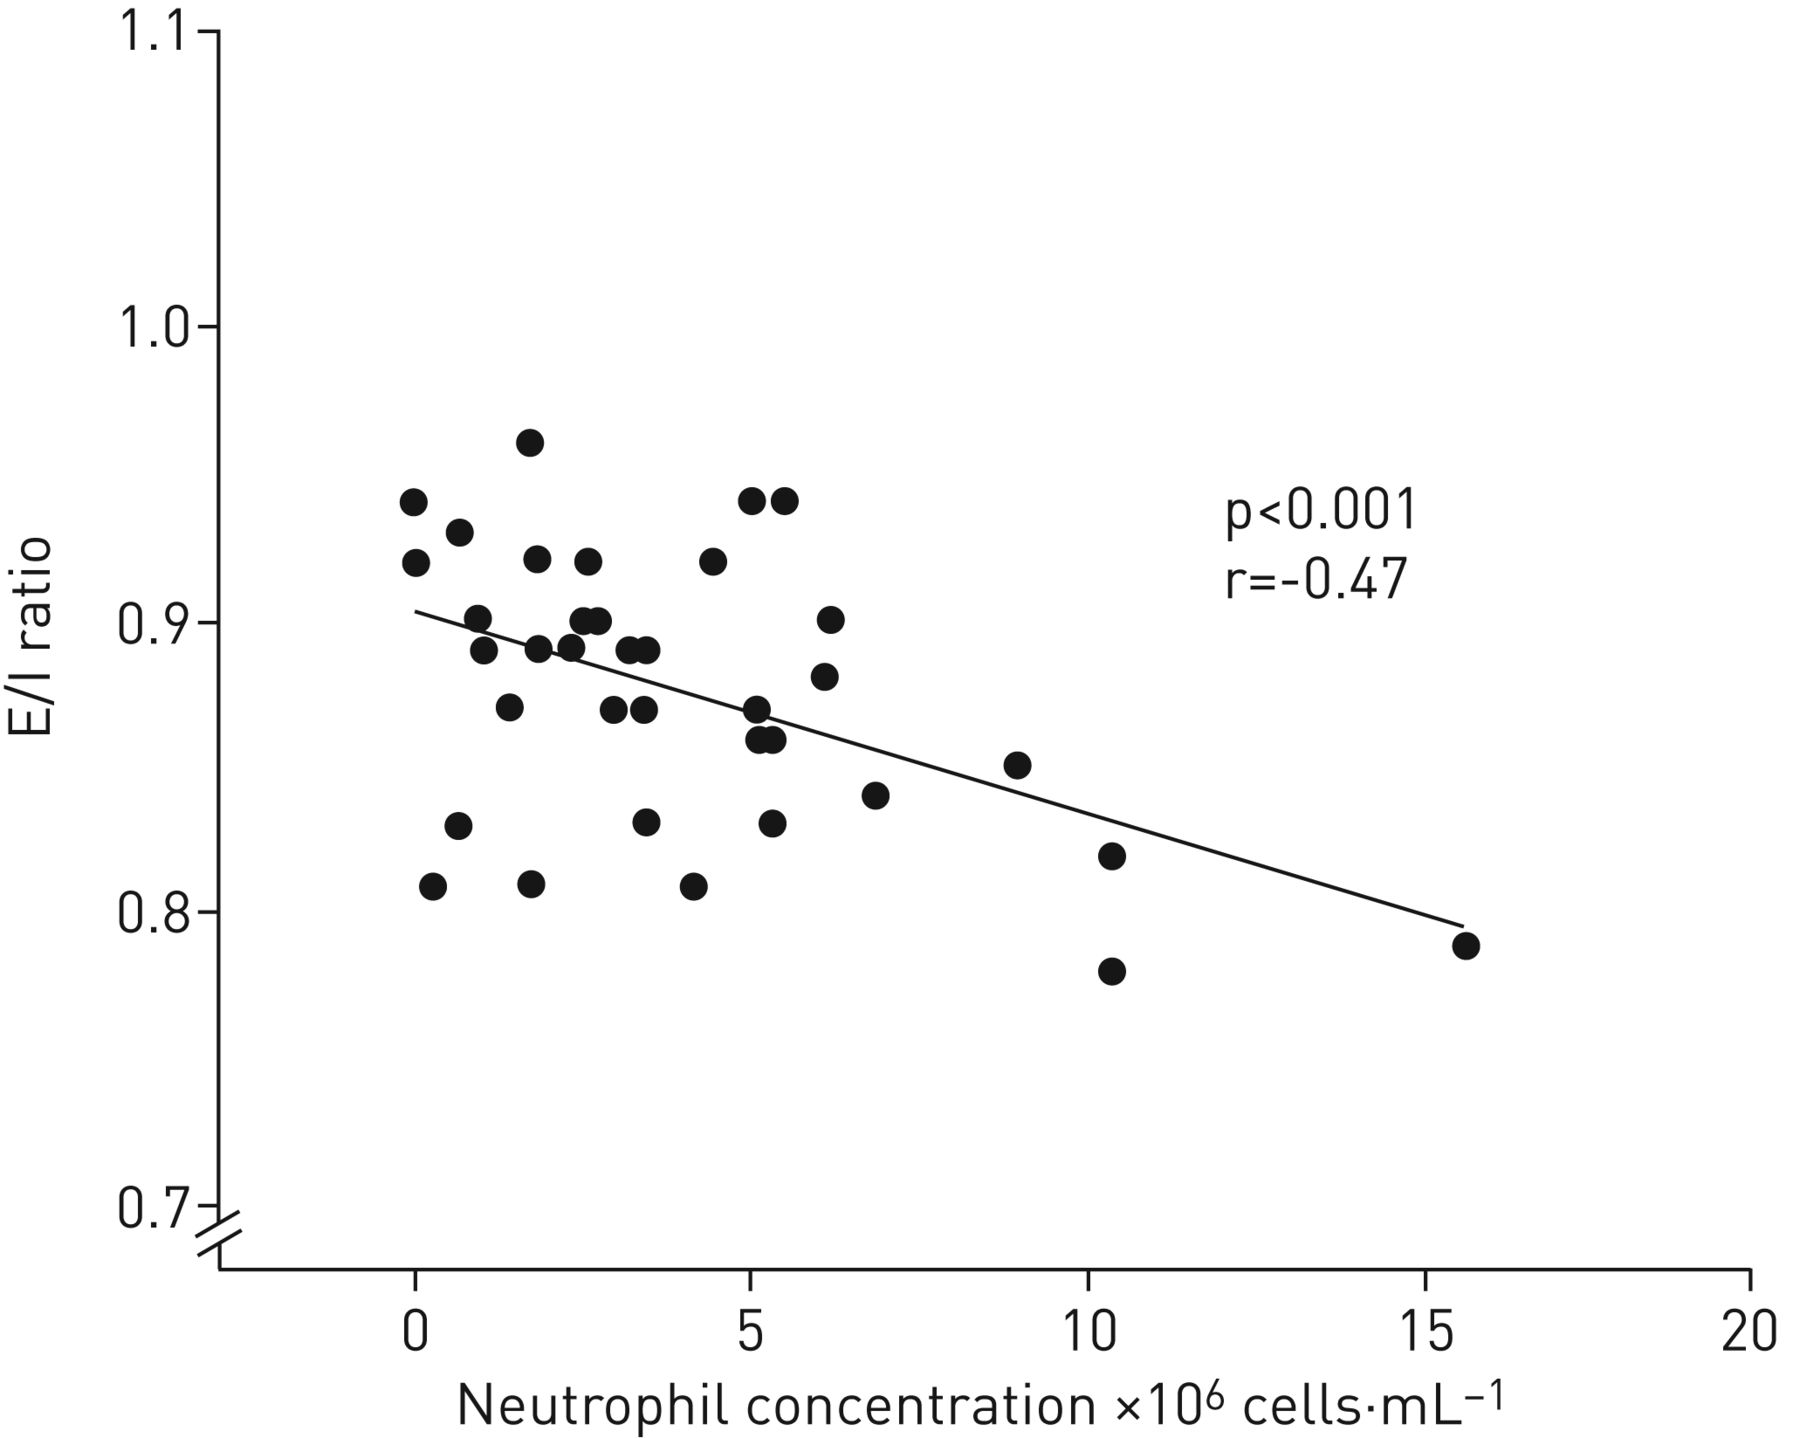
- FIGURE 4
Correlation between neutrophil concentration (cells×106·L−1) in broncho-alveolar lavage, and ratio between mean lung attenuation at expiration and inspiration (E/I-ratio; “static air trapping”), in smokers with normal spirometry.
- FIGURE 5
Correlation between lung volume at end expiration measured with computed tomography (CT) and residual volume measured with plethysmography.


Tables
- TABLE 1
Demographic, lung function, quantitative and morphological computed tomography measurements for never smokers, smokers and COPD patients
Never smokers Smokers COPD patients Subjects n 40 40 40 Demographics and lung function Male/female % 50/50 50/50 50/50 Age years 57.0±7.0 54.0±6.2 59.2±5.3+ Body mass index kg·m−2 25.9±3.7 24.3±3.1 25.3±4.1 Smoking history pack-years NA 35.2±12 38.0±11 Current smoking NA 17.8±7 16.4±6¶ FEV1 % predicted 118±13 109±12## 79±12§§§,+++ FEV1 Z-score 0.9 (−1.3–2.5) 0.2 (−1.1–1.9)### −1.7 (−3.5–−0.5)§§§,+++ FEV1/FVC 0.82 0.78 0.61§§§,+++ FEV1/FVC Z-score 0.3 (−1.5–2.6) −0.1 (−1.3–1.4)## −2.3 (−4,2–−0.8)§§§,+++ TLC % predicted 106±10.7 107±11.1 108±14.6 TLC Z-score 0.4 (−1.0–2.3) 0.4± (−1.5–1.7) 0.5 (−1.4–2.4) RV % predicted 102±25 113±23 138±34+++,§§§ RV Z-score 0.1 (1.0–2.6)+++,§§§ 0.8 (−1.4–2.4) 0.8 (−0.7–2.7) TLCO % predicted 91±11 78±12### 67±13+++,§§§ TLCO Z-score −0.6 (−2.2–1.4)+++,### −1.6 (−4.6–0.37) −2.3 (−4.0–0.7)+++,§§§ Quantitative computed tomography Mean lung attenuation at expiration HU −776±40 −756±45# −809±39+++,§§§ Mean lung attenuation at inspiration HU −874±20 −857±28###,+++ −876±17 E/I ratio 0.89±0.04 0.88±0.05 0.93±0.05+++,§§§ LA-950 at inspiration 27.4±6.2 21.3±6.6###,+++ 27.6±6.8 Morphological (computed tomography) Emphysema 0 (0) 22 (55)### 32 (80)§§§ Regional air-trapping 18 (45) 25 (63) 3 (8)+++,§§§ Bronchial wall thickening 5 (12) 30 (75)### 32 (80)§§§ Nodules larger than 3 mm 15 (38) 21 (52) 23 (58) Micronodules 0 23 (58)### 15 (38)+,§§§ Data are presented as mean±sd, mean (range) or n (%), unless otherwise stated. COPD: chronic obstructive pulmonary disease; FEV1: forced expiratory volume in 1 s; FVC: forced vital capacity; TLC: total lung capacity; RV: residual volume; TLCO: transfer factor of the lung for carbon monoxide; HU: Hounsfield units; LA-950: percentage of lung volume with attenuation <−950 HU. Current smoking is defined as the number of cigarettes per day for the last 6 months and E/I ratio is the ratio between mean lung attenuation at expiration and inspiration. ¶: only current smokers COPD; #: p≤0.05, ##: p≤0.01 and ###: p≤0.001 for comparison between never-smokers and smokers; +: p≤0.05, ++: p≤0.01 and +++: p≤0.001 for comparison between smokers and COPD; and §: p≤0.05, §§: p≤0.01 and §§§: p≤0.001 for comparison between COPD and never smokers.
- TABLE 2
Comparison between two subgroups of smokers with and without regional air trapping on end-expiratory computed tomography
Regional air trapping on end-expiratory scans COPD current smokers Yes No Subjects n 25 15 28 Demographics and lung function Male/female % 44/56 60/40 54/46 Age years 53±7.1 54±4.3 59±5.0+++ Body mass index kg·m−2 25±2.7 24±3.8 24±3.8 Smoking history pack-years 33.2±11 38.5±14 40.9±10+ Current smoking 17.8±7 17.9±7 16.4±6 FEV1 % predicted 113±10 105±14## 78±11+++,§§§ FEV1 Z-score 0.4 (−1.1–1.9) −0.1 (−1.1–1.7)# −1.8 (−3.5–−0.6)+++,§§§ FEV1/FVC 0.80 0.75### 0.61+++,§§§ FEV1/FVC Z-score 0.1 (−1.0–1.4) −0.5 (−1.3–1.1)### −2.3 (−4.2–−0.8)+++,§§§ TLC % predicted 107±11.5 107±10.8 108±15.8 TLC Z-score 0.4 (−0.6–1.7) 0.4 (−1.5–1.5) 0.5 (−1.4–2.4) RV % predicted 108±26 121±13 137±36+++ RV Z-score 0.7 (−0.3–2.9) 1.1 (−0.1–2.1) 0.8 (−0.7–2.7) TLCO % predicted 79±11 76±14 65±12+++,§ TLCO Z-score −1.5 (−2.7–0.4) −1.7 (−4.6–−0.0) −2.4 (−4.0–0.7)+++ Qualitative computed tomography E/I ratio 0.86±0.05 0.90±0.06### 0.93±0.03+++ Mean lung attenuation at expiration HU −736±41 −787±33### −806±34+++ Mean lung attenuation at inspiration HU −852±31 −866±17 −871±16++ LA-950 at inspiration 20.0±7.1 23.6±5.2 25.2±5.2++ Morphological (computed tomography) Emphysema 11 (44) 12 (80)# 23 (82)++ Bronchial wall thickening 17 (68) 13 (86) 22 (79) Micronodules 14 (56) 9 (60) 13 (46) Data are presented as mean±sd, mean (range) or n (%), unless otherwise stated. COPD: chronic obstructive pulmonary disease; FEV1: forced expiratory volume in 1 s; FVC: forced vital capacity; TLC: total lung capacity; RV: residual volume; TLCO: transfer factor of the lung for carbon monoxide; HU: Hounsfield units. Current smoking is defined as the number of cigarettes per day for the last 6 months and E/I ratio is the ratio between mean lung attenuation at expiration and inspiration. #: p≤0.05, ##: p≤0.01 and ###: p≤0.001 for comparison between smokers with regional air trapping and smokers without regional air trapping; +: p≤0.05, ++: p≤0.01 and +++: p≤0.001 for comparison between COPD and smokers with regional air trapping; and §: p≤0.05 and §§§: p≤0.001 for comparison between COPD and smokers without regional air trapping.
- TABLE 3
Measurements of local and systemic inflammation on two subgroups of smokers, with and without regional air trapping, data on COPD current smokers are also presented
Smokers with regional air trapping on expiratory scans COPD current smokers Yes No Subjects n 25 15 28 Male/female % 44/56 60/40 54/46 BAL recovery % 62.0±9.0 53±10# 45±12+++ Total cell yield ×106 89.2±48 66.6±27# 53.5±34++ BAL cell concentration 106·L−1 578±303 519±164 493±255 BAL macrophages 106·L−1 557±291 500±157 471±250 BAL lymphocytes 106·L−1 14.0±11 14.3±13 13.1±9.0 BAL neutrophils 106·L−1 5.3±6.2 3.5±3.1 4.7±4.1 BAL eosinophils 106·L−1 1.5±3.5 1.4±2.4 3.5±9.7 Percentage of CD4+ T-lymphocytes 54±17 44±18 50.0±22 Percentage of CD8+ T-lymphocytes 37±16 48±18 43±23 Ratio of CD4+ and CD8+ 2.2±2.5 1.5±2.1 2.1±2.3 White blood cell counts 109·L−1 7.4±1.6 7.5±1.6 8.0±1.9 Serum high sensitive-CRP g·L−1 2.1±2.1 1.6±1.0 3.1±3.0 Serum orosomucoid g·L−1 0.83±0.20 0.71±0.12 3.8±4.0 Serum haptoglobin g·L−1 1.3±0.53 1.0±0.40 1.5±0.45§§ Serum IgG g·L−1 8.7±1.7 9.9±1.9# 9.4±1.7 Serum IgA g·L−1 2.1±0.89 2.3±0.80 2.4±0.83 Data are presented as mean±sd, unless otherwise stated. COPD: chronic obstructive pulmonary disease; BAL: bronchoalveolar lavage; CRP: C-reactive protein. #: p≤0.05 for comparison between smokers with regional air trapping and smokers without; ++: p≤0.01 and +++: p≤0.001 for comparison between COPD and smokers with regional air trapping; and §§: p≤0.01 for comparison between COPD and smokers without regional air trapping.


