


Figures
- FIGURE 1
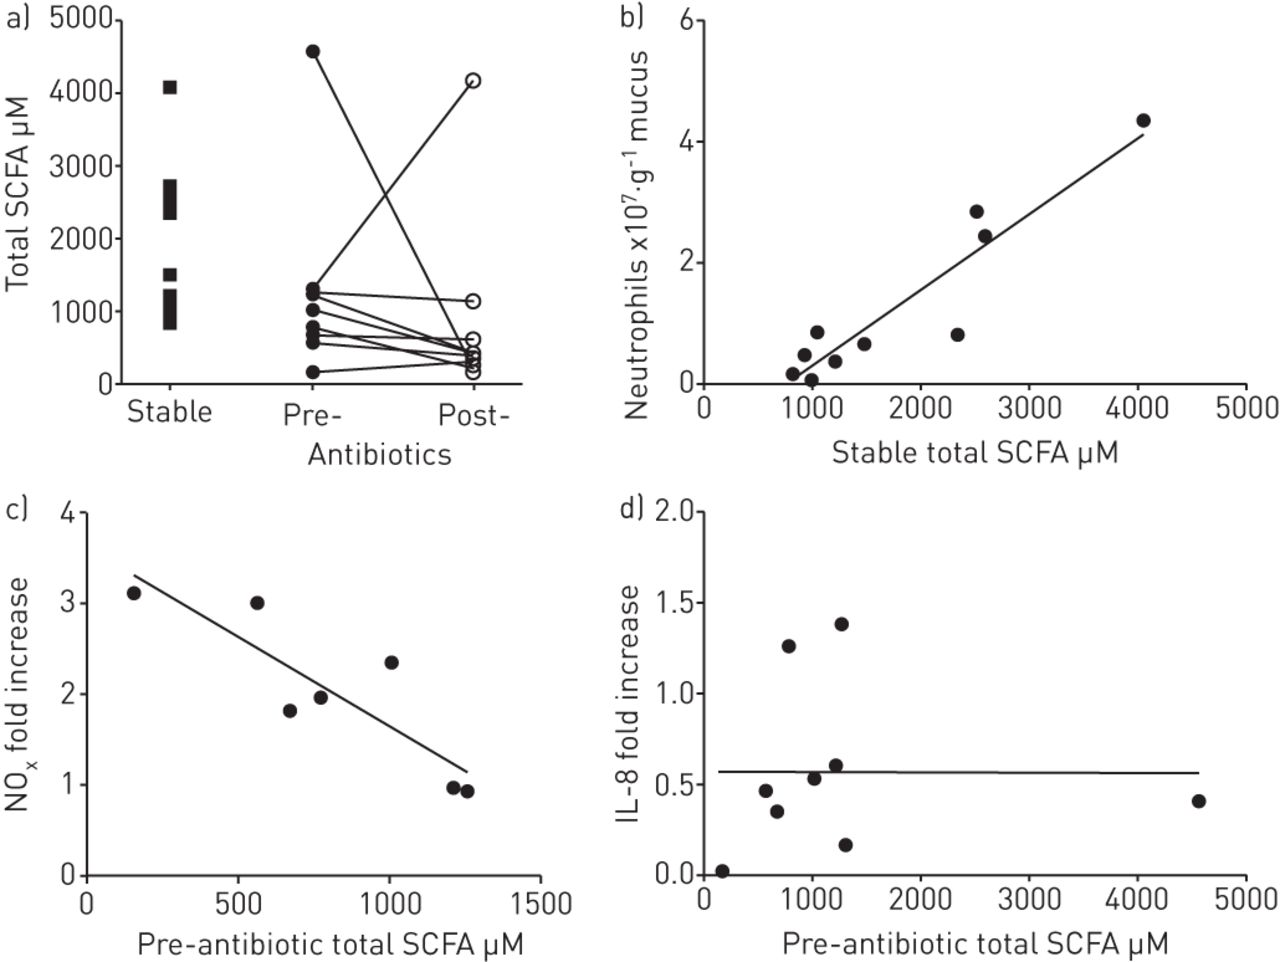
a) Total (sum of acetate, propionate and butyrate) concentrations of short-chain fatty acids (SCFAs) in sputum from patients with stable cystic fibrosis lung disease or with a pulmonary exacerbation before and after 14 days of intravenous antibiotic treatment. b) Correlation of total SCFA concentration to neutrophil numbers in patient sputum. Correlation of total SCFA concentrations in patients before antibiotic treatment to c) the fold change in oxides of nitrogen (NOx) or d) the fold change in interleukin (IL)-8 after antibiotic treatment.
- FIGURE 2
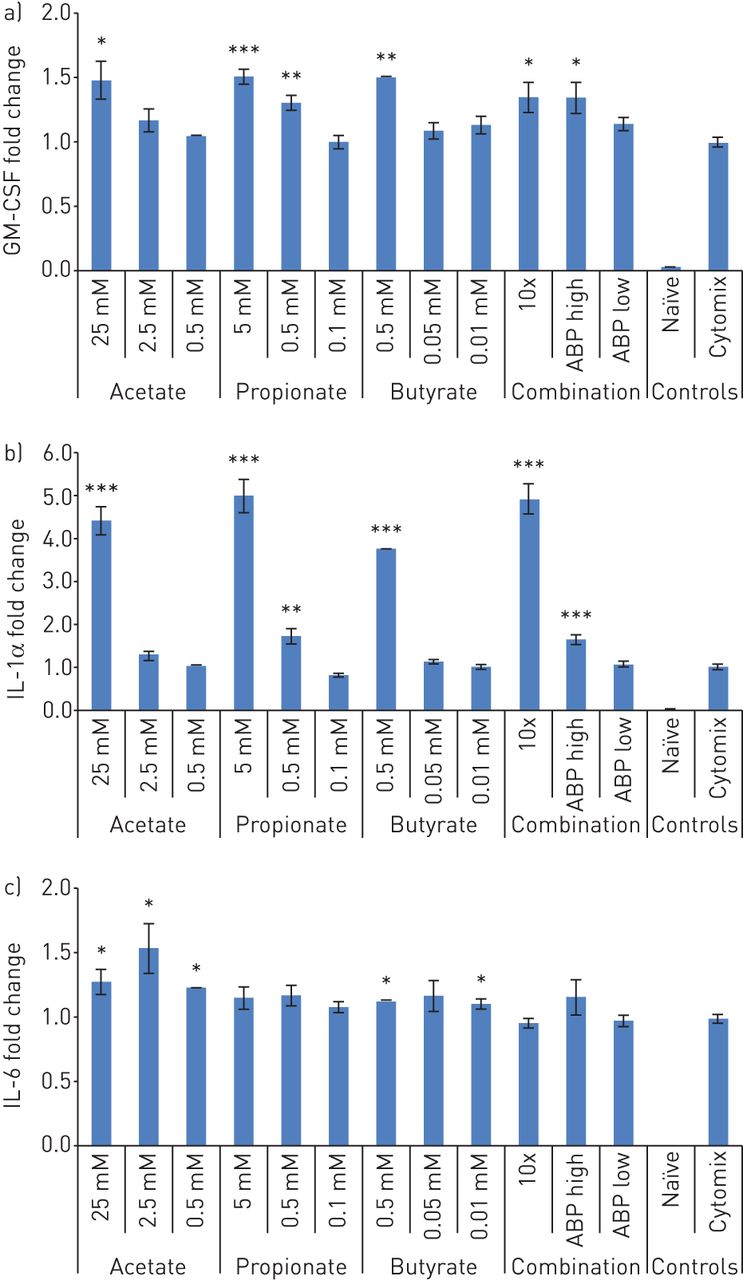
Short-chain fatty acids (SCFAs) modulate cytokine secretion in A549 alveolar epithelial cells in response to SCFA incubation and cytokine stimulation. Secretion of a) granulocyte-macrophage colony-stimulating factor (GM-CSF); b) interleukin (IL)-1α; and c) IL-6 are shown relative to cytokine stimulation alone (cytomix: 10 ng·mL−1 each of IL-1β, tumour necrosis factor-α and interferon-γ). Data are presented as mean±sem. 10x: 25 mM acetate, 5 mM propionate and 0.5 mM butyrate; APB high: 2.5 mM acetate, 0.5 mM propionate and 0.05 mM butyrate; APB low: 0.5 mm acetate, 0.1 mM propionate and 0.005 mM butyrate. *: p<0.05; **: p<0.01; ***: p<0.001 (nonparametric unpaired t-tests).
- FIGURE 3
Short-chain fatty acids (SCFAs) modulate cytokine secretion in cystic fibrosis bronchial epithelial cells. Bronchial epithelial 41o-immortalised cells from a patient with homozygous F508del cystic fibrosis transmembrane conductance regulator (CFTR) alleles transfected with F508del (CFBE41o-/F508del) or wild-type CFTR vector (CFBE41o-/corrCFTR) cell lines in response to SCFA incubation and stimulation with cytomix (10 ng·mL−1 each of interleukin (IL)-1β, tumour necrosis factor-α and interferon-γ) for 24 h. Secretion of a) granulocyte-macrophage colony-stimulating factor (GM-CSF); b) IL-6; c) granulocyte-colony-stimulating factor; and d) IL-8 are shown relative to cytokine stimulation alone (cytomix). Data are presented as mean±sem. Ace: acetate; Prp: propionate; But: butyrate; APB high: 2.5 mM acetate, 0.5 mM propionate and 0.05 mM butyrate; APB low: 0.5 mm acetate, 0.1 mM propionate and 0.005 mM butyrate. *: p<0.05; **: p<0.01; ***: p<0.001; #: p=0.10; ¶: p=0.08 (nonparametric unpaired t-tests).
- FIGURE 4
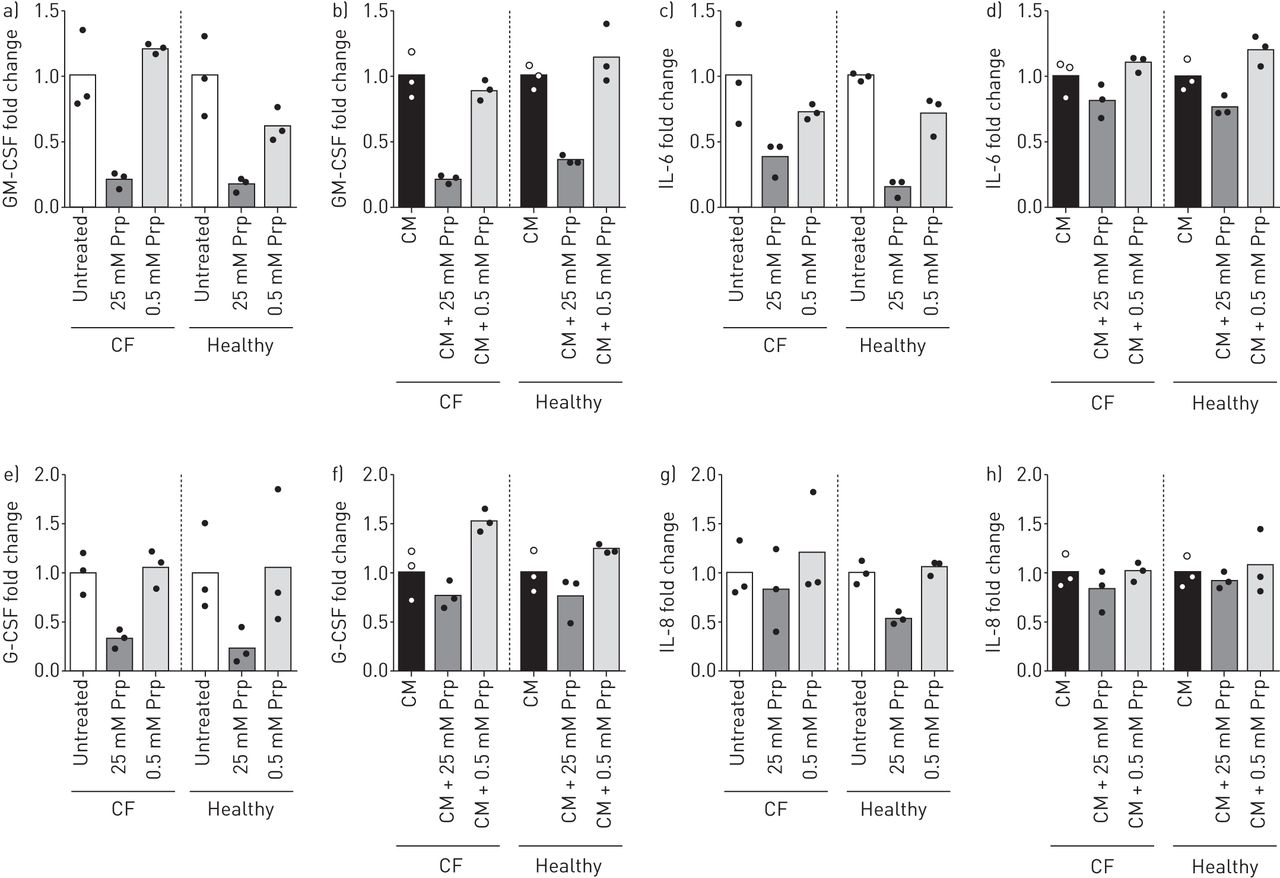
Short-chain fatty acids (SCFAs) alter cytokine release in untreated but not stimulated primary epithelial cultures. a, b) Granulocyte-macrophage colony-stimulating factor (GM-CSF); c, d) interleukin (IL)-6; e, f) granulocyte (G)-CSF; or g, h) IL-8 expression in primary cystic fibrosis (CF) or healthy control epithelial cells pre-incubated for 1 h with different concentrations of propionate ((Prp) 0.5 mM and 25 mM) and a, c, e, g) untreated or b, d, f, h) stimulated with cytomix (CM) (10 ng·mL−1 each of interferon-γ, tumour necrosis factor-α and IL-1β) for 24 h. Data are presented as individual replicates (points) and means (bars). Expression is shown relative to untreated or cytomix controls, respectively.
- FIGURE 5
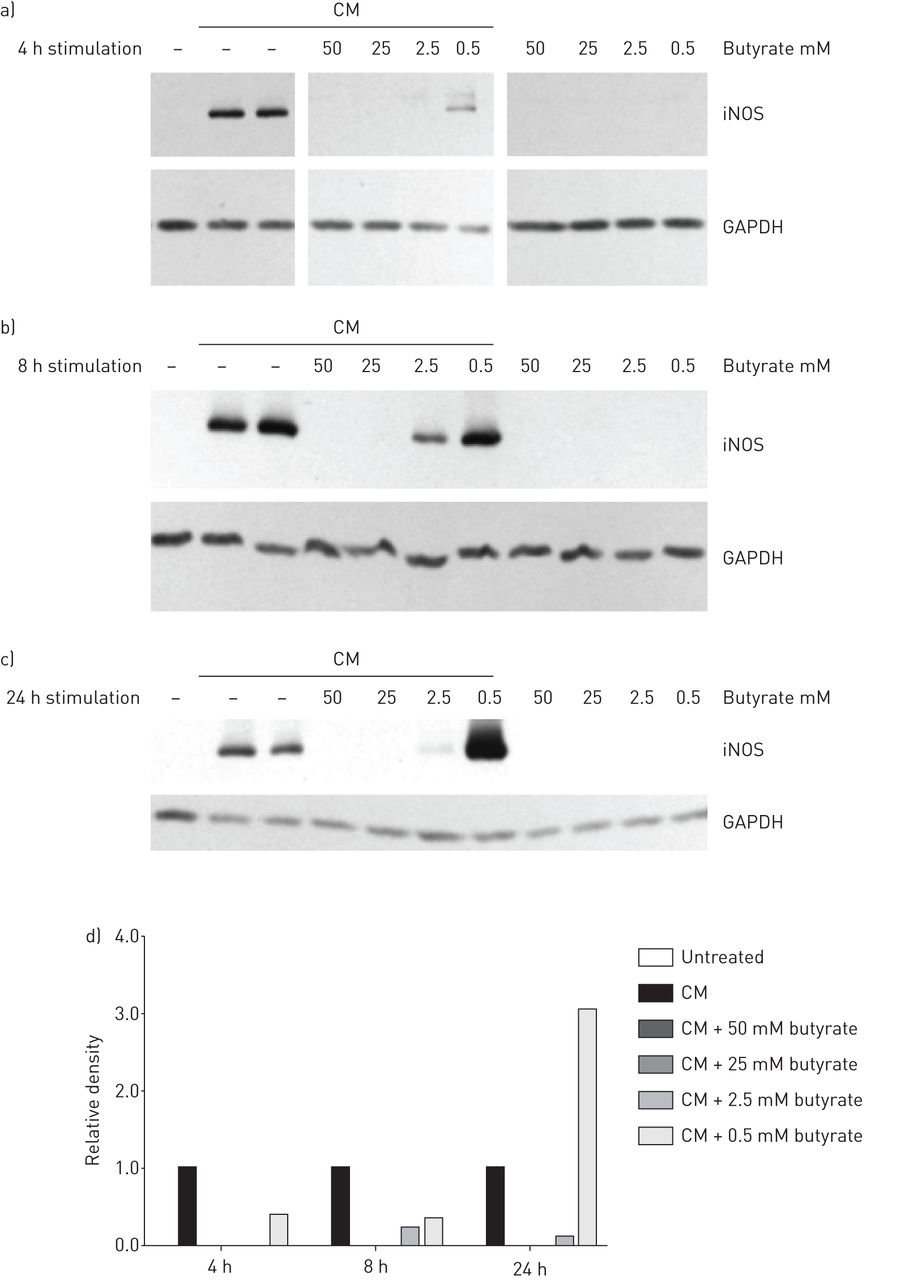
Short-chain fatty acids (SCFAs) modulate inducible nitric oxide synthase (iNOS) expression in A549 cells. iNOS and glyceraldehyde 3-phosphate dehydrogenase (GAPDH) expression in A549 cells pre-incubated for 1 h with different concentrations of butyrate (0.5 mM, 2.5 mM, 25 mM and 50 mM) and stimulated with or without cytomix (CM) (10 ng·mL−1 each of interferon-γ, tumour necrosis factor-α and interleukin-1β) for a) 4 h, b) 8 h and c) 24 h. Data are presented as representative Western blots or d) quantification of at least two independent experiments performed in duplicate. Samples and controls for each time point were run on the same gel. Fold change relative to cytokine stimulation alone (CM) is displayed.
- FIGURE 6
Short-chain fatty acids modulate inducible nitric oxide synthase (iNOS) expression in primary epithelial cultures. a) Representative Western blot of iNOS and glyceraldehyde 3-phosphate dehydrogenase (GAPDH) expression in primary cystic fibrosis or healthy control epithelial cells pre-incubated for 1 h with different concentrations of propionate (0.5 mM and 25 mM) and stimulated with or without cytomix (CM) (10 ng·mL−1 each of interferon-γ, tumour necrosis factor-α and interleukin-1β) for 24 h. b) Quantification of three donors for cystic fibrosis and healthy cultures. Data are presented as mean±sem fold change relative to cytokine stimulation alone (CM). Samples and controls were run on the same gel.
- FIGURE 7
Effect of propionate concentration and pH on the growth of PAO1. Pseudomonas aeruginosa PAO1 was incubated with propionate at concentrations between 3.125 mM and 100 mM in trypticase soy broth (TSB). pH was adjusted using HCl to a) 7.0; b) 6.5; c) 6.0; and d) 5.5. Optical density (OD) readings at 600 nm were normalised to the average OD from TSB alone at each time point. Experiments were performed in duplicate and data are representative of at least two independent experiments.


Tables
- TABLE 1
Patient characteristics
Stable Pulmonary exacerbation Before antibiotic treatment After antibiotic treatment Subjects 11 9 Age years 13.5±2.0 13.3±3.4 Males/females 6/5 5/4 FEV1 % pred 87.3±18.0 52.9±11.9 63.2±14.3 Predominant bacterial species (n) P. aeruginosa (2), S. aureus (3) P. aeruginosa (3), S. aureus (4) P. aeruginosa (1), S. aureus (3) Data are presented as n or mean±sem. FEV1: forced expiratory volume in 1 s; P. aeruginosa: Pseudomonas aeruginosa; S. aureus: Staphylococcus aureus.
Supplementary material
Please note: supplementary material is not edited by the Editorial Office, and is uploaded as it has been supplied by the author.
- Supplementary figure S1 - SCFAs modulate iNOS expression. iNOS and GAPDH expression in A549 cells pre-incubated for 1 hour with different concentrations of SCFAs (acetate; 0.5 mM, 2.5 mM, 25 mM, 50 mM) and stimulated with cytomix (CM: IFN-γ, TNF-α, IL-1β; 10 ng/ml each) for A) 4 hours, B) 8 hours, C) 24 hours. Representative Western blots or D) quantification of at least two independent experiments performed in duplicate. Samples and controls for each timepoint were run on the same gel. Fold change relative to cytokine stimulation alone (CM) is displayed.
- Supplementary figure S2 - SCFAs modulate iNOS expression. iNOS and GAPDH expression in A549 cells pre-incubated for 1 hour with different concentrations of SCFAs (propionate; 0.5 mM, 2.5 mM, 25 mM, 50 mM) and stimulated with cytomix (CM: FN-γ, TNF-α, IL-1β; 10 ng/ml each) for A) 4 hours, B) 8 hours, C) 24 hours. Representative Western blots or D) quantification of at least two independent experiments performed in duplicate. Samples and controls for each timepoint were run on the same gel. Fold change relative to cytokine stimulation alone (CM) is displayed.
- Supplementary figure S3 - Effect of acetate concentration and pH on the growth of PAO1. P. aeruginosa PAO1 was incubated with acetate at concentrations between 3.125 mM and 100 mM in TSB. pH was adjusted with HCl to A) 7.0, B) 6.5, C) 6.0, D) 5.5. OD readings at 600 nm were normalised to the average OD from TSB alone at each timepoint. Experiments were performed in duplicate and are representative of at least two independent experiments.
- Supplementary figure S4 - Effect of butyrate concentration and pH on the growth of PAO1. P. aeruginosa PAO1 was incubated with butyrate at concentrations between 3.125 mM and 100 mM in TSB. pH was adjusted with HCl to A) 7.0, B) 6.5, C) 6.0, D) 5.5. OD readings at 600 nm were normalised to the average OD from TSB alone at each timepoint. Experiments were performed in duplicate and are representative of at least two independent experiments.
- Supplementary figure S5 - Effect of propionate concentration and pH on the growth of PA508. P. aeruginosa PA508 was incubated with propionate at concentrations between 3.125 mM and 100 mM in TSB. pH was adjusted with HCl to A) 7.0, B) 6.5, C) 6.0, D) 5.5. OD readings at 600 nm were normalised to the average OD from TSB alone at each timepoint. Experiments were performed in duplicate and are representative of at least two independent experiments.
- Supplementary figure S6 - Effect of propionate concentration and pH on the growth of PAO1 under microaerobic conditions. P. aeruginosa PAO1 was incubated with propionate at concentrations between 3.125 mM and 100 mM in TSB. pH was adjusted with HCl to A) 7.0, B) 6.5, C) 6.0, D) 5.5. Assay plates were sealed with optically-clear PCR film to simulate reduced oxygen environment. OD readings at 600 nm minus 800 nm were normalised to the average OD from TSB alone at each timepoint. Experiments were performed in duplicate and are representative of at least two independent experiments.
- Supplementary figure S7 - High concentrations of SCFAs inhibit A549 cell proliferation but not viability. A) Sub-confluent A549 cells were incubated with SCFAs for 24 hours and measured for proliferation by Prestoblue reagent. Relative fluorescent signal normalised to untreated control is shown. Representative data from one of two experiments. B) Confluent monolayers of A549 cells were incubated with SCFAs for 24 hours and measured for viability by Prestoblue reagent. Mean and SEM of relative fluorescent signal normalised to untreated control is shown. Results of non-parametric ANOVA with Dunn's post-test: *, p<0.05; **, p<0.01.
Disclosures


