


Figures
- FIGURE 1
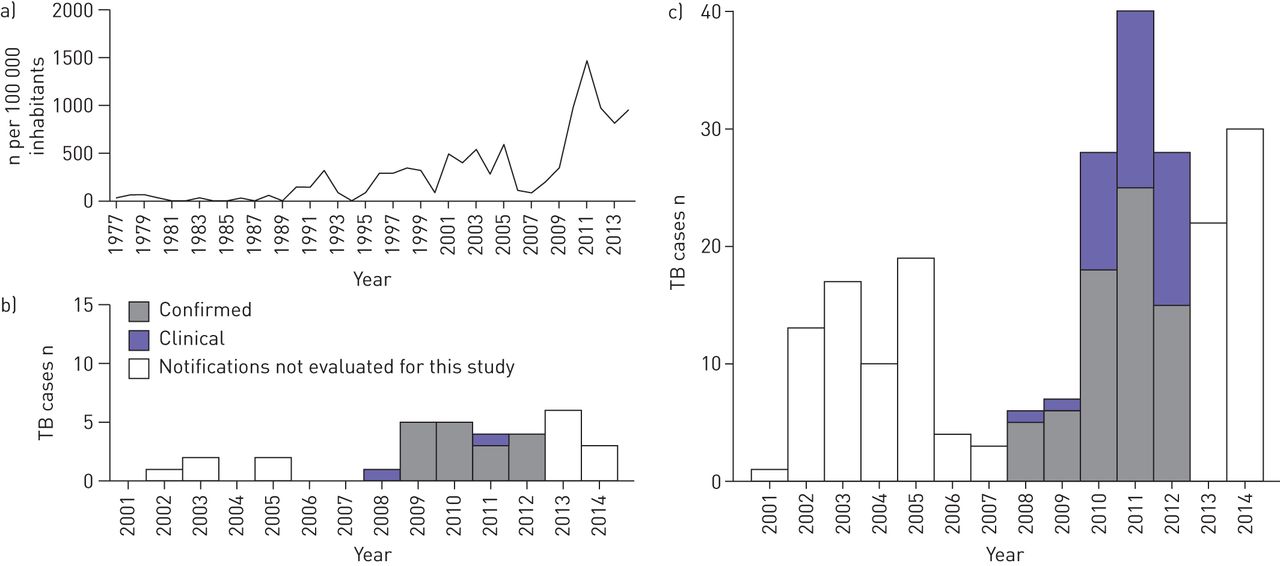
a) Tuberculosis (TB)-notified individuals from 1977 to 2014 in East Greenland per 100 000 inhabitants [2, 3]. All TB cases in East Greenland from 2008 to 2012 stratified by place of residence at time of diagnosis: b) Settlement X; c) rest of East Greenland.
Tables
- TABLE 1
Demographic characteristics of the study cohort, Mycobacterium tuberculosis infection prevalence as of January 1, 2013, and tuberculosis (TB) incidence rates (IRs) per 100 000 person-years, presented by residency
Demographic characteristics Settlement X Rest of East Greenland Total participants 356 (100) 3185 (100) Greenlandic# 345 (96.9) 2838 (89.1) Females 168 (47.2) 1542 (48.4) Year of birth Born after 1996 80 (22.5) 771 (24.2) Born 1991–1996 51 (14.3) 357 (11.2) Born before 1991 225 (63.2) 2057 (64.6) Age at TB diagnosis years median (IQR) 18 (16–30) 22 (18–29) M. tuberculosis infection % (95% CI) All 60.9 (54.8–66.5) 37.5 (35.2–39.7) Born after 1996 48.4 (37.4–59.6) 14.3 (11.5–17.6) Born 1991–1996 79.1 (65.5–88.2) 41.9 (36.4–47.6) Born before 1991 56.1 (48.7–63.2) 48.3 (45.0–51.6) TB incidence Cases n/person-years IR (95% CI) Cases n/person-years IR (95% CI) IRR¶ (95% CI) Total 28/668 1730 (1195–2506) 99/15360 704 (577–859) 2.48 (1.60–3.85) 2008 1/351 286 (40–2029) 6/3168 197 (88–437) 1.20 (0.14–10.00) 2009 5/346 1479 (616–3554) 7/3136 210 (94–468) 7.94 (2.28–27.67) 2010 8/333 2463 (1232–4926) 21/3085 733 (47–1136) 3.71 (1.57–8.79) 2011 6/322 1944 (873–4327) 42/3013 1604 (1185–2170) 1.17 (0.49–2.80) 2012 8/313 2695 (1348–5388) 23/2958 911 (605–1371) 3.17 (1.34–7.52) Sex Females 15/794 1954 (1178–3241) 43/7474 610 (449–828) 2.95 (1.60–5.46) Males 13/873 1528 (887–2632) 56/7885 794 (611–1032) 2.10 (1.12–3.94) Age at diagnosis years 0–12 0/380 3/3631 90 (29–280) 0.00 (0.00) 13–19 18/251 7389 (4656–11729) 39/2056 2210 (1614–3024) 4.08 (2.28–7.31) ≥20 10/1036 1000 (538–1858) 57/9671 633 (486–824) 1.49 (0.74–3.00) Data are presented as n (%) unless otherwise stated. IQR: interquartile range; IRR: incidence rate ratio. #: both parents (or the only know parent) born in Greenland; ¶: Cox proportional hazard model with age as the underlying time axis and baseline hazard rate stratified by sex.
Vol 46 Issue 3
Table of Contents

Tuberculosis outbreak in East Greenland: groups at risk in an isolated arctic setting


