


Figures
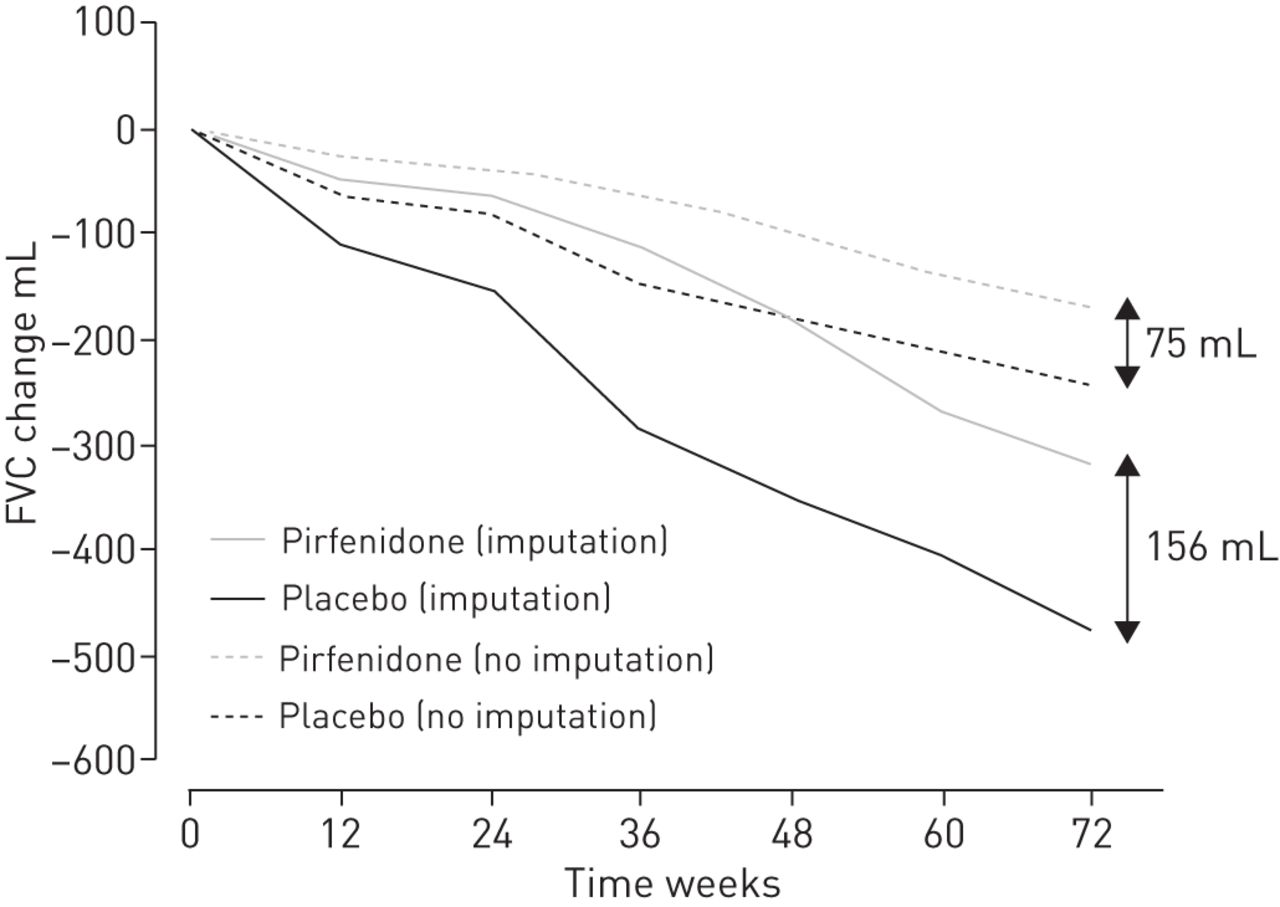
- FIGURE 1
Change from baseline in forced vital capacity (FVC) over time in the CAPACITY-004 trial according to whether an imputation strategy imputing a FVC value of 0 mL for patients who died was applied.
Tables
- TABLE 1
Primary statistical analysis used in trials assessing treatments for idiopathic pulmonary fibrosis (IPF) with forced vital capacity (FVC) decline as the primary end-point
Study/first author [ref.] Drug tested Primary end-point Magnitude of treatment effect Follow-up Estimation of the treatment effect Imputation analysis of the primary end-point# Year INPULSIS/Richeldi [4] Nintedanib Annual rate of decline in FVC (mL·year−1) Difference in FVC change between treatment groups 52 weeks Linear mixed-effect model No imputation 2014 ASCEND/King [2] Pirfenidone Change from baseline to week 52 in FVC % predicted Categorical analysis: FVC decline >10% or death 52 weeks Ranked ANCOVA Missing values owing to death were given the worst ranks in the primary analysis (and imputed to 0 in other analyses) Missing data for other reasons were imputed by the average of the 3 closest patients 2014 PANTHER-IPF/Raghu [21] and Martinez [22] Prednisone, azathioprine and N-acetylcysteine Change from baseline to week 60 in absolute FVC values Difference in FVC change between treatment groups 60 weeks Linear mixed-effect model No imputation 2012 Shulgina [23] Trimethoprim–sulfamethoxazole Change from baseline to month 12 in absolute FVC values Difference in FVC change between treatment groups 12 months Linear mixed-effect model No imputation 2013 MUSIC/Raghu [24] Macitentan Change from baseline to month 12 in absolute FVC values Difference in FVC change between treatment groups 12 months Wilcoxon rank-sum test FVC=0 if death Worst decrease if exacerbation LOCF otherwise 2013 ARTEMIS/Raghu [35] Ambrisentan Time to disease progression defined as “respiratory hospitalisation” or categorical decrease in FVC or DLCO¶ HR from a Cox model Event driven Log-rank test No imputation 2013 FIBROSAND/Crestani [26] Octreotide FVC decline >10% or death Categorical analysis: FVC decline >10% or death 48 weeks Imputation based on linear regression 2012 ACE-IPF/Noth [27] Warfarin Time to: death; nonelective nonbleeding hospitalisation; or drop in FVC ≥10% HR from a Cox model 48 weeks Log-rank test No imputation 2012 CAPACITY/Noble [3] Pirfenidone Change from baseline to week 72 in the FVC % predicted Differences in treatment group means Categorical change in FVC 72 weeks Ranked ANCOVA Missing values owing to death were given the worst ranks in the primary analysis (and imputed to 0 in other analyses) Missing data for other reasons were imputed by the average of the 3 closest patients 2011 BUILD-3/King [28] Bosentan Time to IPF worsening or all-cause death IPF worsening defined as: drop in FVC ≥10%; drop in DLCO ≥15%; or acute exacerbation of IPF HR from a Cox model Event driven Kaplan–Meier and log-rank test No imputation 2011 Imatinib-IPF/Daniels [29] Imatinib Time to disease progression defined as: drop in FVC ≥10%; or death HR from a Cox model 96 weeks Kaplan–Meier and log-rank test No imputation 2010 Taniguchi [30] Pirfenidone Change from baseline to week 52 in FVC % predicted Difference in FVC change between treatment groups 52 weeks ANCOVA LOCF 2010 INSPIRE/King [31] Interferon-γ1b Overall survival time from randomisation HR from a Cox model 77 weeks Log-rank test No imputation 2009 Raghu [32] Etanercept Change from baseline to week 48 in FVC % predicted, DLCO % predicted and P(A–a)O2 at rest Differences in FVC, DLCO and P(A–a)O2 at rest Changes between treatment groups 48 weeks ANCOVA LOCF 2008 IFIGENIA/Demedts [33] Prednisone, azathioprine and N-acetylcysteine Change from baseline to month 12 in absolute values of DLCO and FVC (mL·year−1) Difference in DLCO and FVC changes between treatment groups 12 months ANCOVA LOCF 2005 Raghu [34] Interferon-γ1b PFS measured from randomisation to either disease progression (FVC decrease ≥10% or P(A–a)O2 increase at rest ≥5 mmHg) or death. HR from a Cox model 48 weeks after the 306th patient underwent randomisation Cox proportional-hazards model Log-rank test LOCF 2004 DLCO: diffusing capacity of the lung for carbon monoxide; P(A−a)O2: alveolar–arterial oxygen tension gradient; PFS: progression-free survival; HR: hazard ratio; LOCF: last observation carried forward. #: Some studies report sensitivity analyses for the primary end-point; ¶: either a decrease in FVC ≥10% plus a decrease in DLCO ≥5% or a decrease in DLCO ≥15% plus a decrease in FVC ≥5%.
Disclosures
Files in this Data Supplement:


