


Abstract
Initial results indicate that FRI might better predict post-operative FEV1; confirmation in a larger trial is needed http://ow.ly/E395t
To the Editor:
Surgical resection is a potential curative therapy for patients with early-stage non-small cell lung cancer (NSCLC). Comorbid chronic obstructive pulmonary disease (COPD) is frequently present in these patients [1], stressing the importance of an accurate estimation of post-operative (po) forced expiratory volume in 1 s (FEV1) [2]. A predicted poFEV1 (PpoFEV1) must be calculated whenever the pre-operative FEV1 or diffusing capacity for carbon monoxide is <80% predicted [3]. The anatomic segment method (ASM) and perfusion scintigraphy (QS) are often used for this prediction [4, 5]. Both are known to underestimate the poFEV1 in a substantial fraction of patients, resulting in the possible exclusion from resection of a borderline operable patient [6, 7]. This stresses the need for a more precise tool to estimate poFEV1.
Current imaging techniques (computed tomography (CT), magnetic resonance imaging and four-dimensional CT) allow a patient-specific description of spatial differences in lung mechanics and this information might lead to a better prediction of poFEV1 [8]. Functional respiratory imaging (FRI) has added functionality to CT data by means of computational fluid dynamics (CFD) airflow calculations [9, 10]. FRI has been used in different settings and populations [11–13]. This study investigated whether FRI can be used to predict poFEV1, using data at baseline and after virtual resection, and compared the predictive accuracy of FRI with those of ASM and QS.
This single-centre, prospective pilot study enrolled consecutive patients with early-stage NSCLC that was considered resectable and scheduled for lobectomy/pneumonectomy. Eligible subjects performed spirometric manoeuvres according to the American Thoracic Society/European Respiratory Society standards [14] before and after resection. PpoFEV1 using ASM and QS were calculated according to previous reports [4–7]. Before surgery, all patients also underwent breath-hold spirometry and low-dose chest CT scans at two different lung levels, i.e. total lung capacity (TLC) and residual volume (RV). Institutional review board approval was obtained and a written informed consent was provided by all patients.
From both RV and TLC scans, a reconstruction was made of different lung lobes to assess the changes in lobar volume from RV to TLC (lobar expansion (EXP)). From the TLC scan, the airway tree was segmented up to the point where the CT image quality no longer allowed for distinction of bronchi. CFD calculations provided flow properties within the reconstructed airway trees. Image processing and steady CFD calculations (assuming 25-L·min−1 tracheal flow with flow split ratios according to the relative lobar EXP) on a noncompliant airway model were performed according to the reports by De Backer and co-workers [9, 10] to estimate pre-operative airway resistance. Virtual resection was performed by the removal of the airways leading to the lung/lobes targeted for lung resection. Again, steady CFD calculations (flow split ratios according to the relative lobar EXP of the nonresected parts) were carried out to estimate post-operative airway resistance.
PpoFEV1 using FRI (PpoFEV1FRI) was estimated using the equation:

Where FEV1pre is the pre-operative FEV1, iRawpre is the resistance of the pre-operative airway model, iRawvirtual is the resistance after virtual resection, EXPlungs is the expansion of both lungs and EXPresected is the expansion of the lobe or lung that is planned for resection.
This equation looks very similar to the ASM and QS formulas [4]. It is based on the theory that the total volume of air that can go into the lungs will be reduced by the resected part. However, the airway tree is also affected by the surgery and a compensation factor related to a simulated change in airway resistance is taken into account.
Variables were tested for normality using a Shapiro–Wilk test and homogeneity of variance was determined using a F-test. Differences between the poFEV1 and PpoFEV1 values were assessed using a paired t-test. Furthermore, linear models were created to check whether the observed differences were due to a constant bias or if a slope could be observed. These models were validated with respect to skewness, kurtosis, link function and heteroscedasticity.
Between June 2010 and February 2012, 23 patients underwent measurement of FEV1pre and poFEV1 by spirometry, and PpoFEV1 was calculated by ASM, QS and FRI. Nine participants either dropped out due to sublobar or no resection (n=5) or were lost in follow up (n=4, of whom one died before follow-up). Data from 14 patients were available: eight males and six females with a median age of 63 (51–73) years, of whom six patients had COPD; their median (range) FEV1pre was 2.49 (1.66–4.07) L and median actual poFEV1 was 2.1 (1.21–3.21) L. No patient suffered from an obstructive tumour that produced lung atelectasis.
Significant differences were found between poFEV1 and PpoFEV1 by ASM (mean±sd 345±278 mL, p<0.001) and QS (206±239 mL, p=0.007). No difference was found between poFEV1 and PpoFEV1 by FRI (18±220 mL, p=0.767). The linear fit between poFEV1 and PpoFEV1 showed that both ASM and QS had a slope of 1.06 (R2=0.77, p<0.001) and 1.10 (R2=0.84, p<0.001), respectively, whilst FRI had a slope <1 (0.98; R2=0.86, p<0.001). ASM underestimated poFEV1 in 13 out of 14, QS in 13 out of 14 and FRI in seven out of 14 cases.
In this study, PpoFEV1FRI was compared with two current standard techniques. Holvoet et al. [7] reported that ASM underestimated poFEV1 by 350 mL and QS by 200 mL. Our trial showed very comparable results, with a mean error of 345 mL for ASM, 206 mL for QS and 18 mL for FRI. Although the FRI formula is based on the same principle as ASM and QS, it is thought that the better prediction is due to the fact that patient-specific, regional differences in airway resistance (via iRaw) and tissue compliance (via EXP) are accounted for.
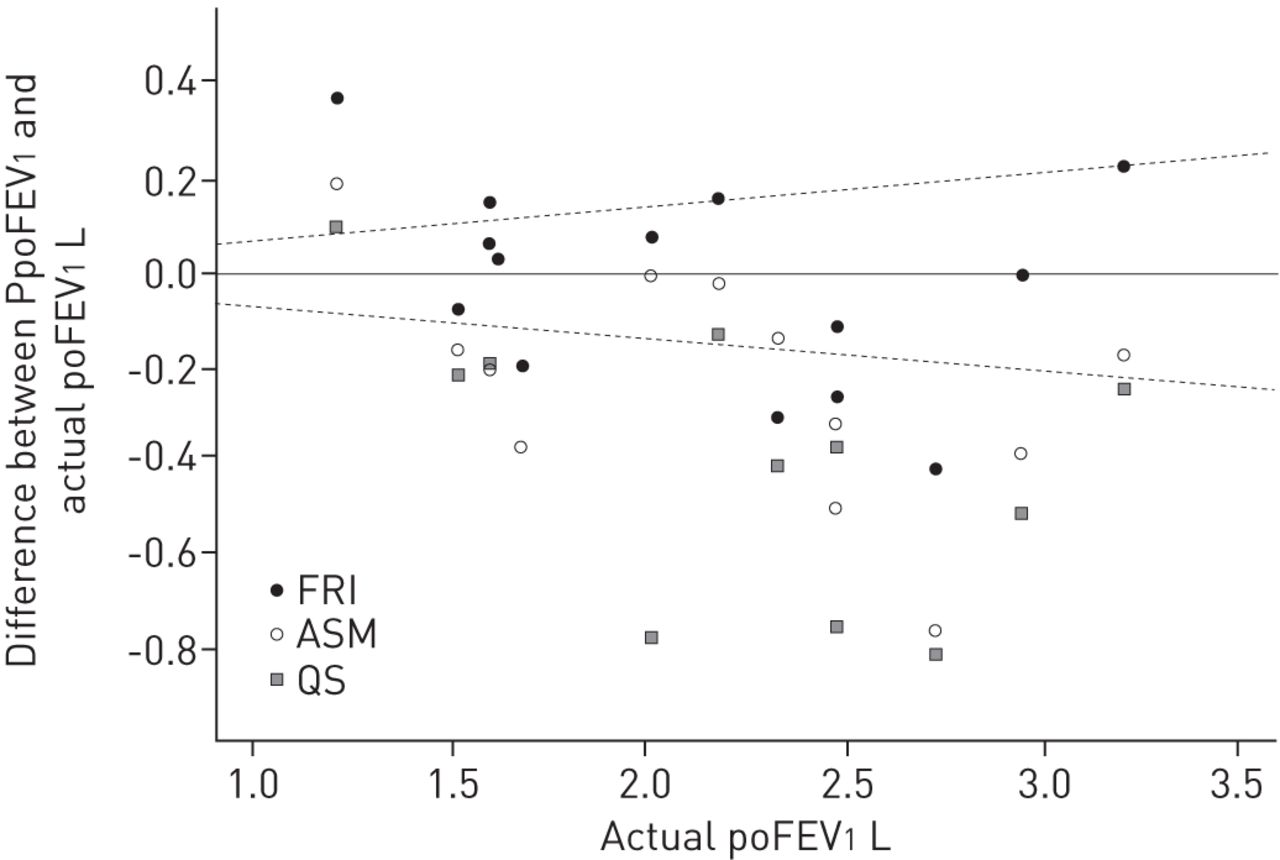
It can be argued that the FRI prediction leads to more overestimation. When taking into account the 6.8% coefficient of repeatability of FEV1 [15], PpoFEV1FRI is indeed overestimating the actual poFEV1 in three out of 14 patients (versus one out of 14 for ASM and QS) (fig. 1). However, a more precise model is advantageous as the main goal is to predict poFEV1 as well as possible. An accurate model (slope close to 1) can be updated with a safety factor (adding a constant to equation) in order to minimise the risk of adverse events in patients.

A plot of the difference between the predicted (P) post-operative (po) forced expiratory volume in 1 s (FEV1) and the actual poFEV1 against the actual poFEV1. Points above the solid line represent over-prediction of poFEV1. The dotted lines represent the 6.8% coefficient of repeatability of FEV1. FRI: functional respiratory imaging; QS: perfusion scintigraphy; ASM: anatomic segment method.
Another possibility is to improve the equation for prediction further by incorporating additional imaging based parameters such as quantitative scores for air trapping and emphysema. To further improve PpoFEV1FRI, we are developing a flow model that accounts for dynamic change in the position of the airways when undertaking the virtual resection; for example, accounting for how the right middle and lower lobes swing up after resecting the right upper lobe.
Weaknesses of this series are its small size and the fact that its patients had a rather high FEV1pre (>1.66 L) and, hence, do not represent the at-risk population. Multicentre confirmation in a larger cohort of patients with more severely impaired FEV1 is needed. Furthermore, comparison to other (image-based) predictive methods could be of interest.
In this series, FRI was a superior predictor of actual poFEV1 in resected lung cancer patients compared with ASM and QS.
Footnotes
Conflict of interest: Disclosures can be found alongside the online version of this article at erj.ersjournals.com
- Received April 4, 2014.
- Accepted November 4, 2014.
- Copyright ©ERS 2015
References


