


Abstract
The aim of this study was to determine the diagnostic and interpretative consequences of adopting the Global Lungs Initiative (GLI) 2012 spirometric prediction equations.
We assessed spirometric records from 17 572 subjects (49.5% females), aged 18–85 years, from hospitals in Australia and Poland.
We calculated predicted forced expiratory volume in 1 s (FEV1), forced expiratory volume (FVC), FEV1/FVC and lower limits of normal (LLN) using European Community for Steel and Coal (ECSC), National Health and Nutrition Examination Survey (NHANES) III and GLI 2012 equations. Obstruction was defined as FEV1/FVC<LLN and a restrictive pattern as FEV1/FVC>LLN and FVC<LLN. Global Initiative for Chronic Obstructive Lung Disease (GOLD) stage 2 and higher was defined as FEV1/FVC <0.70 and FEV1 <80% pred.
GLI 2012 equations produce similar predicted values for FEV1 and FVC compared with NHANES, but produce larger values than ECSC. Differences in the LLN lead to an important increase in the prevalence rate of a low FVC compared to ECSC, and a significant decrease compared to NHANES prediction equations. Adopting GLI 2012 equations has small effects on the prevalence rate of airway obstruction. GOLD stages 2–4 lead to >20% underdiagnosis of airway obstruction up to the age of 55 years and to 16–23% overdiagnosis in older subjects. GLI 2012 equations increase the prevalence of a “restrictive spirometric pattern” compared to ECSC but decrease it compared to NHANES.
Abstract
Adopting the Global Lung Initiative 2012 prediction equations will have small effects on spirometric rates of detection http://ow.ly/nrZxe
Introduction
Spirometry is the mainstay of lung function assessment, particularly in the diagnosis of obstructive lung disease. The diagnostic process entails comparing test results with expected values, which may be either previous measurements made in the same patient, or external reference values obtained from a disease-free dataset. Most physiological markers used for clinical purposes (such as serum concentrations of a substance) vary within narrow limits in healthy individuals because they are the outcome of a controlled system, and are independent of sex and ethnic group. However, spirometric indices and other measures of lung function vary with age, sex, standing height and ethnic group. This has led to a plethora of studies, primarily in Caucasians, documenting normal pulmonary function. Most studies include relatively small groups with limited age ranges leading to appreciable differences in predicted values between them [1–6], and to important disjunctions when individuals move from one age range to the next [7]. Consequently, the interpretation of test results varies with the predicted values used [1–6], and is also complicated by the fact that the coefficient of variation of spirometric indices varies with age, so that the lower limit of normal (LLN) is age dependent [8].
Recently a European Respiratory Society (ERS) Task Force (Global Lung Function Initiative (GLI)) addressed the above problems by producing predicted values for spirometric indices for a variety of ethnic groups, valid across the 3–95 years age range [9]. These GLI data were based on tests in >74 000 healthy nonsmokers from all over the world. As the report has been endorsed by the American Thoracic Society (ATS), the Australian and New Zealand Society of Respiratory Science, the Asian Pacific Society for Respirology, the Thoracic Society of Australia and New Zealand and the American College of Chest Physicians, these equations are likely to be widely adopted and will probably supersede previous prediction equations. Inevitably, this will affect the interpretation of test results [3–6].
The objective of the present study is to evaluate the effect of a transition from two commonly used sets of prediction equations [10, 11] to the GLI 2012 equations on the classification of test results from a clinical population. The classifications are focused on interpretation of “airway obstruction”, “restrictive pattern” and “mixed pattern”. Since the Global Initiative for Chronic Obstructive Lung Disease (GOLD) guidelines [12] for diagnosing airway obstruction are still commonly used, we have also included these in the analysis.
Methods
Consecutive clinical data were available from lung function laboratories in two tertiary hospitals in Australia: the John Hunter Hospital in New South Wales, the Austin Hospital in Victoria; and one in Poland: the National Tuberculosis and Lung Diseases Research Institute in Warsaw. The analysis was limited to Caucasians because there were very few non-Caucasian data. In addition, analysis was restricted to patients aged between 18 years (the lower age limit for one set of prediction equations [10]) and 85 years, because few data were available at higher ages. All spirometry data used were baseline or pre-bronchodilator status, and only test results meeting ATS/ERS criteria for acceptability and reproducibility were included [13]. Data were collected between August 2008 and June 2012 (John Hunter Hospital), January 2011 and May 2012 (Austin Hospital) and April 2009 and June 2012 (National Tuberculosis and Lung Diseases Research Institute). This study is a retrospective analysis of routinely obtained data which had been de-identified, obviating the need for approval from local ethics committees.
Mean predicted values and Z-scores were derived using prediction equations from the European Community for Steel and Coal (ECSC)/ERS [10], National Health and Nutrition Examination Survey (NHANES) III [11] and GLI 2012 [9]. Z-scores according to the ECSC/ERS were calculated by (measured – predicted)/standard deviation of the predicted value. The NHANES III predicted values provide the mean and the LLN. As the LLN is defined as the fifth percentile, i.e. 1.6445 times the standard deviation below the predicted value, the standard deviation of the predicted values was calculated as (predicted – LLN)/1.6445. The GLI 2012 calculations [13] utilise mean predicted value, variation and skewness of the data to provide Z-scores and LLN specifically calculated for each individual. Airway obstruction was diagnosed if forced expiratory volume in 1 s (FEV1)/forced vital capacity (FVC) was <LLN, i.e. the Z-score was <−1.6445 [9–10, 14].
We limited the GOLD guidelines [12] analysis to stage 2 and higher, since GOLD stage 1 has been shown to be unrelated to respiratory disease [15–20]. GOLD-defined airway obstruction was considered to be present if FEV1/FVC <0.70 and FEV1 <80% predicted.
A “restrictive pattern” in spirometry was diagnosed if FEV1/FVC was ≥LLN but the FVC <LLN. A “mixed pattern” was diagnosed if both FEV1/FVC and FVC were <LLN. In keeping with common pulmonary laboratory practice, predicted values and their LLN were calculated for the full age range, even though this requires extrapolation beyond the recommended age range for ECSC/ERS (70 years) and for NHANES III (80 years). Data analysis was performed using the statistical software R (version 2.15.1; R Foundation, www.r-project.org). Differences in prevalence rates according to the three prediction equations were tested using McNemar's Chi-squared test and the test of differences between two dependent proportions. Differences in predicted values were analysed using the paired t-test.
Results
27 patients were unusually short (<140 cm) and their data discarded, leaving 17 572 spirometry results for analysis: 10 783 from the National Tuberculosis and Lung Diseases Research Institute, 4129 from John Hunter Hospital and 2660 from Austin Hospital. The distribution by age is shown in figure 1, with 49.5% being female. Predicted values (table 1) differed significantly (p<0.0001). The overall average predicted values from GLI 2012 and NHANES matched best, but NHANES predicted values and the LLN tended to be highest for FVC, and lowest for FEV1/FVC (table 1 and figs 2 and 3). Mean predicted values for FEV1 and FVC according to the ECSC/ERS were consistently smaller by 220–470 mL (table 1 and fig. 2). The FEV1/FVC ratios predicted by ECSC/ERS and NHANES differed little, but were lower than those predicted by GLI 2012, particularly in those aged >60 years (fig. 3). The latter is mostly accounted for by the fact that the GLI 2012 data incorporates the inverse relationship between FEV1/FVC ratio and height, whereas this covariate is not included in the ECSC/ERS and NHANES prediction equations.
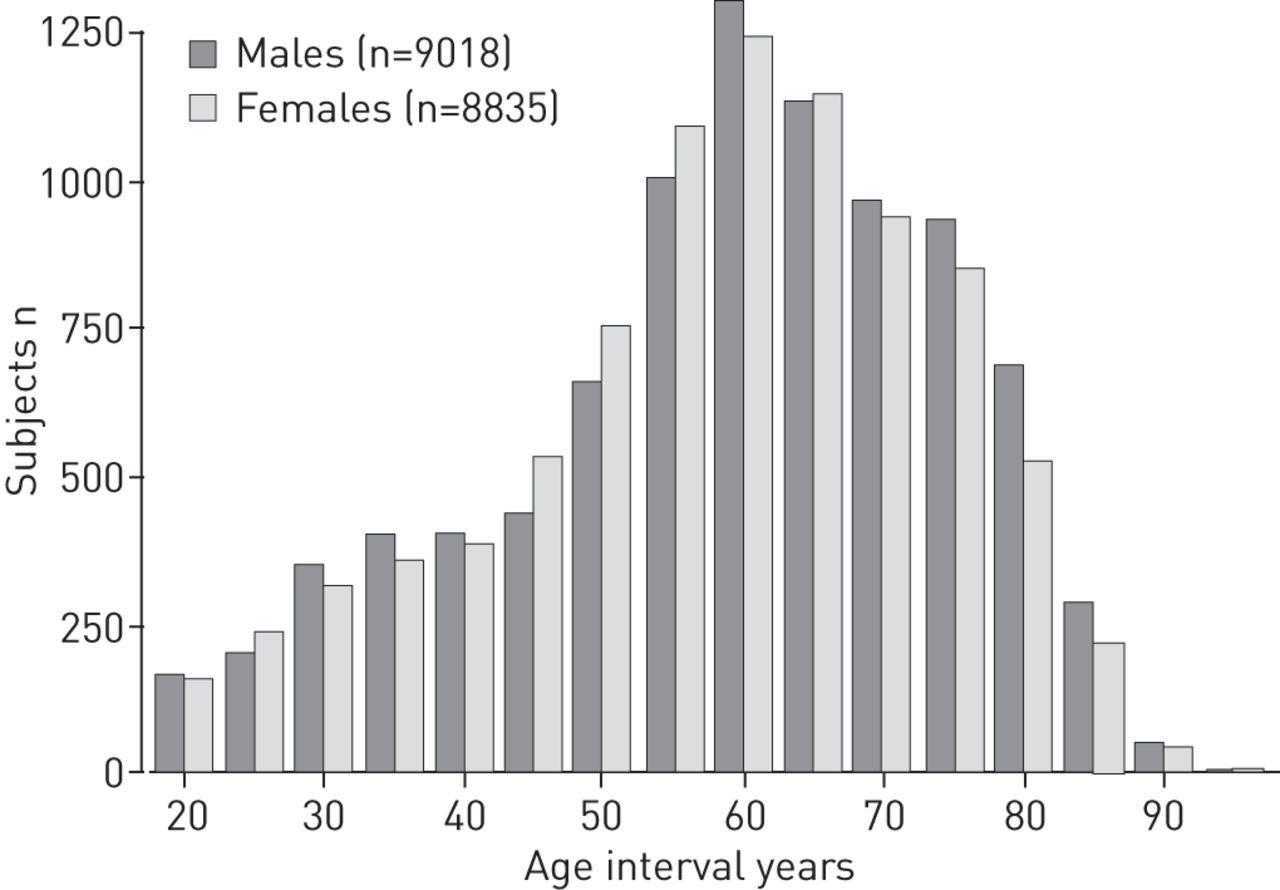
Age distribution of males and females in the clinical dataset. Each age group spans 5 years, thus age group 50 covers 47.51–52.50 years.

a) and b) predicted forced expiratory volume in 1 s (FEV1) and c) and d) forced vital capacity (FVC) and lower limits of normal (LLN) (fifth percentile) in the clinical dataset (n=17 572) by age group using prediction equations from the Global Lung Initiative (GLI) 2012 [9], European Community for Steel and Coal (ECSC)/European Respiratory Society (ERS) [10] and National Health and Nutrition Examination Survey (NHANES) III [11].

Predicted forced expiratory volume in 1 s (FEV1)/forced vital capacity (FVC) ratio and lower limits of normal (LLN) for a) females and b) males in the clinical dataset (n=17 572) by age group using prediction equations from Global Lung Initiative (GLI) 2012 [9], European Community for Steel and Coal (ECSC)/European Respiratory Society (ERS) [10] and National Health and Nutrition Examination Survey (NHANES) III [11].
Figure 4 illustrates the relative rates of airway obstruction (i.e. FEV1/FVC<LLN) for the three normal-value datasets evaluated and for the GOLD guidelines. Overall, the ECSC/ERS normal values generally resulted in the lowest rates of obstruction (31.1% for males and 24.7% for females), and GLI 2012 resulted in the highest rates (34.5% for males and 27.9% for females), with NHANES III generally being between the two (33.3% for males and 25.4% for females). While GOLD stages 2–4 rates of obstruction were similar on average (35.1% and 25.4%), this averaging conceals the significantly lower rates in the young and the much higher rates in the older age group (>55–60 years) evident in figure 4.

Percentage of subjects, arranged by age group, categorised as having airway obstruction defined as forced expiratory volume in 1 s (FEV1)/forced vital capacity (FVC)<lower limits of normal (LLN) (Global Lung Initiative (GLI) 2012, European Community for Steel and Coal (ECSC)/European Respiratory Society (ERS) and National Health and Nutrition Examination Survey (NHANES) III), or FEV1/FVC<0.70 and FEV1 % predicted <80 (Global Initiative for Chronic Obstructive Lung Disease (GOLD) stages 2–4). a) Females; b) males.
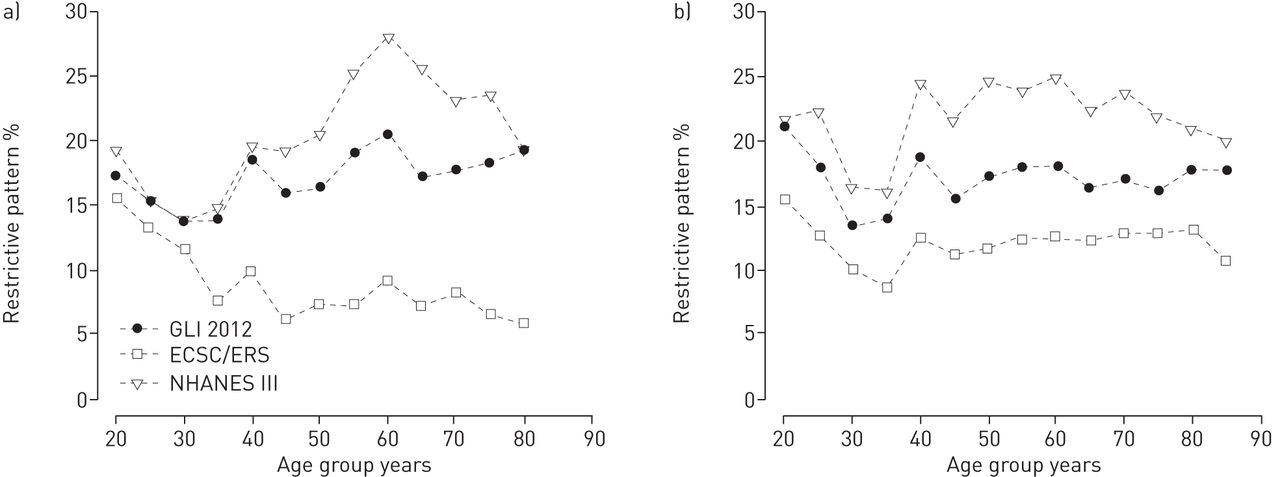
table 2 provides a breakdown of the level of FEV1/FVC and of FVC relative to their LLN. With the exception of airway obstruction in males using NHANES III equations (confidence interval of differences 0.051–0.017), all prevalence rates for ECSC/ERS and NHANES III differed significantly from those for GLI 2012 (maximum McNemar test p<0.019). The overall average rates of a low FVC (i.e. FVC<LLN irrespective of FEV1/FVC) were 20.9% for males and 12.8% for females using ECSC/ERS, 37.9% and 35.5%, respectively, for NHANES, and 29.1% and 27.8%, respectively, using GLI 2012; remarkable differences which reflect different levels of the LLN (fig. 2). Of these, 40.4–41.4% of males and 35.1–37.0% of females would be categorised as having a mixed pattern, i.e. both FEV1/FVC and FVC<LLN. Focusing on those with a purely restrictive-type pattern (i.e. FVC<LLN and FEV1/FVC>LLN), the overall average rates were 12.3% for males and 8.1% for females using ECSC/ERS, 22.6% and 22.8%, respectively, using NHANES III and 17.1% and 18.1%, respectively, using GLI 2012 (fig. 5).
Percentage of subjects, arranged by age group, categorised as having a restrictive pattern, i.e. forced expiratory volume in 1 s /forced vital capacity (FVC)>lower limits of normal (LNN) and FVC<LLN in a) females and b) males. GLI: Global Lung Initiative; ECSC: European Community for Steel and Coal; ERS: European Respiratory Society; NHANES: National Health and Nutrition Examination Survey.
Discussion
This study is based on the premise that measurements that fall below the upper 95% distribution from a large sample of a healthy population of nonsmokers are, in principle, indicative of a disease process. We regarded the GLI 2012 predicted values [9] as the reference standard because they are based on a large population sample from all over the world (25 827 and 31 568 Caucasian males and females, respectively), and because the modelling used in their development led to normally distributed residuals. This allows lung function to be expressed as a Z-score, adjusted for height, age, sex and ethnic group [9]. Z-scores indicate how much a measurement differs from the mean predicted value, with only 5% of healthy subjects having a Z-score ≤ -1.6445 (fifth percentile). As is common in clinical measurement, we adopted the fifth percentile as the LLN, realising that this cutoff value will result in a 1 in 20 false-positive rate. This is unlikely to be problematic given that our analysis was conducted on data from patients referred to pulmonary laboratories of tertiary hospitals, so that there is often associated evidence of respiratory disease. Clinical diagnoses require more than pulmonary function test results and incorporate factors such as patient symptoms, relevant history and clinical signs. As such, we have limited our analysis to the identification of three nonspecific syndromes rather than to detection of specific disease states. These are airway obstruction, a restrictive pattern and a mixed pattern, which commonly form the basis for interpretative strategies in clinical respiratory medicine [14].
Changing predicted values creates a number of potential problems for laboratories and clinicians, and we consider it important to identify how clinical interpretation of test results might alter on adoption of the new GLI 2012 reference data. Issues such as effects on presence and severity of disease, as well as the interpretation of serial observations are raised. Interpretation of lung function is still widely based on results expressed as % pred, despite the fact that this leads to significant age, height, sex and ethnic group-related bias [8–10, 21–25]. In addition, the interpretation of serial measurements may be especially confounded if they are evaluated on the basis of % pred without awareness of the fact that there has been a change in reference equations [26].
We have found that predicted values for FEV1 and FVC from GLI 2012 did not differ grossly (table 1) compared to the NHANES III study, a high quality study [11]. Although NHANES study data do comprise some of the GLI 2012 data and so some congruence may be expected, they contributed <4% of the total dataset, which is insufficient to explain this agreement. Transition from the predicted values of NHANES III [11], which had been recommended for use in USA [27], to GLI 2012 equations will therefore have a limited impact on the predicted FEV1 and FVC, except in more elderly subjects. We suspect that this finding in the elderly may result from extrapolation beyond the valid age range (for both NHANES III and ECSC/ERS), leading to a steeper fall in the LLN in elderly subjects than that of the GLI 2012 data (fig. 2). Differences in the LLN for FVC (fig. 2) led to up to a threefold difference in the prevalence ratio of a low FVC (table 2). Predicted values from the ECSC/ERS [10], which are widely used in Europe and elsewhere, are appreciably lower across all ages; this is not a new finding [6, 28].
There are more pronounced differences in the predicted values for FEV1/FVC (fig. 3); this is because ECSC/ERS and NHANES III, unlike GLI 2012, do not take into account that the FEV1/FVC ratio falls with increasing standing height (which is lower in elderly subjects). The predicted FEV1/FVC ratio tends to be highest for GLI 2012 (fig. 3). The ECSC/ERS equations lead to lower rates of diagnosis of airway obstruction up to ∼60 years of age, much less so in females than in males (fig. 4).
Inevitably there will be overlap in the distribution of spirometric test results between healthy subjects and those with disease. Therefore, adoption of the LLN derived from healthy subjects for clinical purposes is open to criticism. The GOLD group advocates the use of FEV1/FVC <0.70 as indicating pathological airflow limitation, acknowledging that using the LLN would lower the high rate of false-negative and false-positive results [12]. While the LLN methodology is based on an appropriate statistical approach, the clinical validity of either approach hinges on evidence of respiratory disease being present in those subjects who meet the respective inclusion criteria. It has been shown that GOLD stage 1 is not associated with premature death [15, 17, 19, 29], abnormal decline in FEV1, respiratory symptoms, respiratory care nor quality of life [16]. Conversely, GOLD stage 1 with FEV1/FVC<LLN is associated with increased risk of death [16], confirming the finding by Mannino et al. [30] that the adjusted hazard ratio for premature death in subjects with GOLD stage 1 was only significant if FEV1/FVC was <LLN. The use of LLN for FEV1/FVC and FEV1 identifies persons with increased risk of death and prevalence of respiratory symptoms [18]. All the evidence therefore suggests that using the LLN for FEV1/FVC to identify subjects with pathological airflow limitation is clinically valid, unlike the fixed ratio advocated by the GOLD group [12].
The GOLD classification for stage 2 and higher is associated with a pronounced age-related bias. Our data shows that in patients ≤55 years of age there is a systematically low rate of diagnosis, so that 24% of cases of abnormal airflow obstruction are missed. In older subjects there is 23% overdiagnosis in males, and 16% in females. This corroborates an earlier report of a misclassification rate of ∼20% using GOLD criteria [21]. The percentage misclassification would have been much higher had we also included GOLD stage 1 in our analysis [3]. Our findings, and those of Miller et al. [21], underline that even GOLD stage 2 classification has serious shortcomings which invalidate its clinical use.
In 1991 the ATS [22] suggested that a restrictive ventilatory defect, i.e. a condition with a reduced total lung capacity, may be inferred when the vital capacity is reduced and FEV1/FVC is normal or increased. Since then a “spirometric restrictive pattern” is increasingly mentioned in the literature and widely used in clinical practice. Our analysis shows that the rates of detecting this pattern vary substantially with normal dataset used, with the lowest prevalence generally with the ECSC/ERS equations (fig. 5). As such, this restrictive pattern will be detected more frequently when laboratories switch from using ECSC/ERS, as previously described [6]. This may increase the referral rate for assessment of total lung capacity to confirm the restrictive defect, thereby increasing medical expenditure. The reality is that the veracity of the 1991 ATS approach for interpreting a restrictive pattern from spirometry is questionable [31–33] and even worse when there is concomitant airways obstruction [14, 33–35]. The restrictive pattern and mixed pattern are elusive syndromes with a very high negative predictive value but a poor positive predictive value for reduced total lung capacity. In a general population, where a reduced total lung capacity is rare, the positive predictive value of this test result will be very small. There is therefore little to be said for measurement of the total lung capacity if a restrictive pattern or mixed pattern is diagnosed on the basis of spirometry alone, unless there is a priori clinical evidence of a condition that might cause lung restriction, such as interstitial lung disease [36]. The underlying principle should be to treat the patient, not the numbers [37].
A clinical diagnosis is based on clinical signs, symptoms and objective measures, among which pulmonary function test results play a prominent role. Assessing whether there is evidence of airway obstruction, or a restrictive pattern, forms part of the clinical routine, and helps in assessing disease severity, prognosis and interventions of best potential utility. Against that background this study provides useful information to what extent clinical decision making might be affected by the transition to the GLI 2012 prediction equations. This study is based on a hospital population with considerably higher disease prevalence than in general practice or occupational medicine, and so the prevalence of airways obstruction and restrictive spirometric patterns would be expected to be higher.
The strength of the GLI 2012 equations is that they have been derived from a large, representative population sample [38], are valid over a wide age range without any discontinuity between age groups, and apply to different ethnic groups. This study is limited to Caucasians in the 18–95-year age range; hence complementary studies are required to evaluate the consequences of the transition to GLI 2012 equations in paediatrics and in non-Caucasians. A potential limitation of this study is that the analysis uses pre-bronchodilator values, whereas the GOLD classification utilises post-bronchodilator values [12]. The GOLD statement focuses on chronic obstructive pulmonary disease (COPD) which, being defined as irreversible airway obstruction, requires reversibility to be excluded to confirm the diagnosis. This study, however, is not about COPD in isolation and is more wide-ranging across all disease types. Furthermore, the appropriate reference value to use for post-bronchodilator spirometry is one obtained in healthy subjects who were administered the same drug. Bronchodilator use increases the FEV1/FVC ratio on average by 0.013–0.029 in healthy individuals, depending on age and sex [39]. It is therefore likely that using post-bronchodilator data and post-bronchodilator reference values in our analysis would have resulted in similar findings.
In conclusion, the transition from NHANES III to GLI 2012 spirometry reference data will lead to limited changes in the predicted values of FEV1 and FVC for adults. In contrast, users of ECSC/ERS prediction equations should be aware that predicted values for FEV1 and FVC will increase by a few hundred millilitres on transition to GLI 2012 data. This will lead to a substantial increase in the prevalence rate of low FVC when changing from ECSC/ERS, or a moderate decrease if changing from NHANES III. There are substantial differences in the predicted levels of FEV1/FVC ratio but not in their LLN, so that adopting the GLI 2012 prediction equations will have small effects on the rates of detection of obstructive ventilatory defects. Our analysis confirms previous findings in clinical populations that GOLD definitions for stage 2 and higher lead to >20% underdiagnosis of airway obstruction in those aged ≤55 years, and to 16–23% overdiagnosis in older subjects.
Footnotes
For editorial comments see page 901.
Conflict of interest: None declared.
- Received December 3, 2012.
- Accepted March 6, 2013.
- ©ERS 2013
References


