


Abstract
The transpulmonary pressure gradient (TPG), defined by the difference between mean pulmonary arterial pressure (Ppa) and left atrial pressure (Pla; commonly estimated by pulmonary capillary wedge pressure: Ppcw) has been recommended for the detection of intrinsic pulmonary vascular disease in left-heart conditions associated with increased pulmonary venous pressure. In these patients, a TPG of >12 mmHg would result in a diagnosis of “out of proportion” pulmonary hypertension. This value is arbitrary, because the gradient is sensitive to changes in cardiac output and both recruitment and distension of the pulmonary vessels, which decrease the upstream transmission of Pla. Furthermore, pulmonary blood flow is pulsatile, with systolic Ppa and mean Ppa determined by stroke volume and arterial compliance. It may, therefore, be preferable to rely on a gradient between diastolic Ppa and Ppcw. The measurement of a diastolic Ppa/Ppcw gradient (DPG) combined with systemic blood pressure and cardiac output allows for a step-by-step differential diagnosis between pulmonary vascular disease, high output or high left-heart filling pressure state, and sepsis. The DPG is superior to the TPG for the diagnosis of “out of proportion” pulmonary hypertension.
- Heart failure
- pulmonary capillary wedge pressure
- pulmonary circulation
- pulmonary hypertension
- pulmonary vascular compliance
- pulmonary vascular resistance
Pulmonary hypertension is defined by a mean pulmonary arterial pressure (Ppa) ≥25 mmHg at rest [1, 2]. The diagnosis of pulmonary vascular disease relies on: invasive measurements of mean Ppa ≥25 mmHg; a pulmonary capillary wedge pressure (Ppcw); ≤15 mmHg; a pulmonary vascular resistance (PVR) ≥3 Wood units; and a transpulmonary pressure gradient (TPG) ≥12 mmHg [1, 2]. The TPG is the difference between mean Ppa and left atrial pressure (Pla). Pla is usually estimated by Ppcw. The TPG is thought to be particularly useful to diagnose “out of proportion pulmonary hypertension” in patients with left heart failure or mitral stenosis [1]. “Out of proportion” infers that mean Ppa is higher than expected from an upstream transmission of Pla, because of increased tone and/or structural changes. However, a TPG-derived diagnosis of “out of proportion” pulmonary hypertension may not always agree with clinical context.
The degree of pulmonary hypertension that is the passive consequence of increased Pla due to advanced left heart failure can be observed in cardiac transplantation. In patients with purely passive pulmonary hypertension, the mean Ppa would decrease along with decreased Pla, while in those with “out of proportion” pulmonary hypertension the mean Ppa would remain unchanged, or decrease proportionally less than Pla. This was examined in 20 previously reported patients with pre- and post-operative haemodynamic measurements [3]. Before transplantation the mean±se was: 43±2 mmHg for Ppa; 29±2 mmHg for Ppcw, 604±60 dyn·s−1·cm−5·m−2 for PVRi; 14±1 mmHg for TPG. After transplantation: the mean±se was 25±2 mmHg for Ppa; 12±1 mmHg for Ppcw, 452±50 dyn·s−1·cm−5·m−2 for PVRi; and 12±1 mmHg for TPG. In this series of patients, transplantation was followed by a proportional decrease in mean Ppa and Ppcw (by, on average, 18 mmHg and 17 mmHg, respectively) suggestive of purely passive pulmonary hypertension. Yet the initial TPG was, on average, >12 mmHg, with a range of values from 6–20 mmHg. Since transplantation did not always normalise mean Ppa, the data taken from 12 out of the 20 patients in whom mean Ppa decreased to below the value of 25 mmHg were re-examined. The pre-operative TPG was >12 mmHg (range 12–20 mmHg) in six of the patients. Thus, in this limited series of patients, a TPG >12 mmHg did not predict “out of proportion” pulmonary hypertension better than flipping a coin. How is this possible?
HOW LEFT ATRIAL PRESSURE AFFECTS MEAN PULMONARY ARTERIAL PRESSURE
The normal relationship between mean Ppa and Pla is described by the PVR equation rearranged as: mean Ppa=PVR×Q+Pla, where Q is pulmonary blood flow. The inherent assumptions of the PVR equation are that the TPGT–Q relationship is linear, crosses a zero pressure/zero flow value, and is, therefore, independent of the absolute value of Pla. Many studies have shown that the TPG–Q relationship may be reasonably well described by a linear approximation over a limited range of physiological flows, but that its extrapolated pressure intercept is most often positive, and that the slope of the mean Ppa–Pla relationship is less than the unity [4].
It has long been known that PVR decreases with increases in Q or Pla. This has been initially explained by a pulmonary circulation model of parallel collapsible vessels with a distribution of closing pressures (Pc) [5]. In each of these vessels, flow is determined by a pressure gradient between Ppa and Pc whenever there is a Pc >Pla. A Pla lower than Pc is irrelevant to flow; like the height of a waterfall. Pla then becomes an apparent outflow pressure and Pc the effective outflow pressure of the pulmonary circulation, while the PVR equation remains valid provided Pla is replaced by Pc. When Pla is higher than Pc, the vessel opens and the driving pressure for flow becomes Ppa minus Pla, the effective outflow pressure of the pulmonary circulation is Pla and the usual PVR equation can be used.
A Pc higher than Pla is typically observed in West's zones I and II in the upper parts of normal vertical lungs [6]. Diseases associated with increased pulmonary vessel tone and/or alveolar pressure (PA) are associated with an increase in Pc. In these patients, mean Ppa becomes less sensitive or even insensitive to changes in flow or Pla, and calculated PVR rapidly decreases with increased cardiac output [7]. The presence of a closing pressure in the pulmonary circulation can be identified by a gradient between Pla and the extrapolated pressure intercept of the linear adjustment of a multiple mean Ppa–Q coordinates measured at constant Pla. Further proof is brought about by the demonstration of a functional dissociation between Pc and Pla on mean Ppa–Pla relationships in experimental preparations in which flow is kept constant; this is discussed further by Naeije [3]. A typical experiment in an intact animal preparation of oleic acid lung injury, as a model of the acute respiratory distress syndrome, is shown in figure 1 [8]. In this animal, the extrapolated intercept of linear mean Ppa–Q plots revealed a Pc higher than Pla, and Pla had to be increased above that value to be transmitted upstream to mean Ppa.

a) Mean pulmonary arterial pressure (Ppa) as a function of cardiac output (Q) at constant left atrial pressure (Pla) and b) Ppa as a function of Pla at constant Q, in an animal before (base) and after induction of acute lung injury by the injection of oleic acid (OA). Before OA, Ppa–Q plots presented with an extrapolated pressure intercept equal to Pla and any increase in Pla was transmitted upstream to Ppa. After OA, Ppa–Q plots presented with an extrapolated pressure intercept higher than Pla, and Pla was not transmitted upstream to Ppa below a pressure equal to that value. These observations suggest that OA-induced pulmonary hypertension is caused by an increase in the closing pressure of the pulmonary circulation. Data from [8].
The “waterfall model'” of the pulmonary circulation does not take into account the natural distensibility of the pulmonary vessels. A sufficient number of mean Ppa–Q coordinates, >4–5, show a slight curvilinearity, which is ignored by linear adjustment procedures. This curvilinearity is explained by the fact that a high flow distends pulmonary resistive vessels, and is an important cause of decreased slope of mean Ppa–Q relationships, or PVR along with increasing flow. High flow linear adjustments of multipoint mean Ppa–Q relationships are, therefore, associated with spurious increase in Pc estimated from extrapolated pressure intercepts [9].
This difficulty is overcome by a mathematical model of the pulmonary circulation fitting multipoint mean Ppa–Q plots by an equation relating mean Ppa, Pla, Q, total PVR at rest (R0) and a distensibility coefficient (α) [9]:

The normal value for α measured on in vitro mounted pulmonary resistive vessels is 2% change in diameter per mmHg change in pressure, and is remarkably constant in a wide spectrum of animal species [10]. It is interesting that the same distensibility α-value of 2% per mmHg has been recovered by the application of the distensibility model equation to either invasive [10] or noninvasive [11–13] measurements of pulmonary vascular pressures and flows. The distensibility factor α is higher in young healthy females when compared with males [12], and decreases with aging [12] or with chronic hypoxic exposure [13].
The distensibility equation allows for the modelling of the effects of increased Q or Pla on mean Ppa at various levels of vascular distensibility and PVR. The results are shown in figures 2 and 3. It is apparent that an increase in α decreases mean Ppa or TPG at any given level of flow (figs 2 and 3) and also decreases the TPG along with an increase in Ppcw (fig. 3) In other words, an increase in Q and/or Pla may falsely decrease the TPG that would ordinarily be increased because of the pulmonary vasoconstriction or remodelling.

Mean pulmonary arterial pressure (Ppa) as a function of cardiac output (Q) at two different levels of pulmonary vascular resistance (PVR). Increasing distensibility (α) decreases Ppa at any given level of Q. Thus pulmonary vascular distensibility results in a Ppa that is less than the one predicted by a linear model, which is the PVR equation.

In the linear model, the transpulmonary pressure gradient (TPG) is only a function of flow rate (Q) as shown in a), and is not affected by pulmonary capillary wedge pressure (Ppcw), as shown in b), whatever the pulmonary vascular resistance. An increase in pulmonary vascular distensibility decreases the TPG as a function of Q as well as of Ppcw.
Distensible models provide a satisfactory explanation for all possible normal or pathological pulmonary vascular pressure–flow relationships in fully recruited lungs. Pulmonary vascular de-recruitment has to be taken into account in low cardiac output or high alveolar pressure states. The slope of the mean Ppa–Pla relationship decreases with pulmonary vascular distension, but may increase in de-recruited lungs. In that case, an increased TPG may falsely suggest pulmonary vasoconstriction or remodelling.
There is thus no good rationale for a stable cut-off value of 12 mmHg for the TPG as the measurement is sensitive to Pla-dependent changes in pulmonary vascular recruitment and distension
HOW LEFT ATRIAL PRESSURE AFFECTS PULSATILE PULMONARY ARTERIAL PRESSURE
The above considerations do not take into account the natural pulsatility of the pulmonary circulation. Pulmonary flow reaches a maximum during systole, and is inappreciable at the end of diastole. Accordingly, in a normal pulmonary circulation, diastolic Ppa is approximately equal to Pla [14]. It has been assumed, after taking into account errors for measurements of ±1–2 mmHg, 5 mmHg would be a reasonable upper limit for normal diastolic Ppa/Ppcw gradient. This is indeed what was established on the basis of invasive hemodynamic measurements in 44 healthy volunteers aged 17–83 yrs, at rest and at various levels of exercise in either recumbent and sitting positions associated with Ppcw values up to 34 mmHg and cardiac outputs of up to 25–30 L·min−1[14]. Systolic Ppa and mean Ppa, at any given diastolic Ppa, increase in a fixed proportion depending on stroke volume (SV) and pulmonary arterial compliance (Cpa), which decreases along with increased Pla. Therefore systolic Ppa and mean Ppa can be predicted from diastolic Ppa using the following equations [14]:


Predicted mean Ppa and systolic Ppa as a function of Ppcw at various SVs are illustrated in figures 4–6.

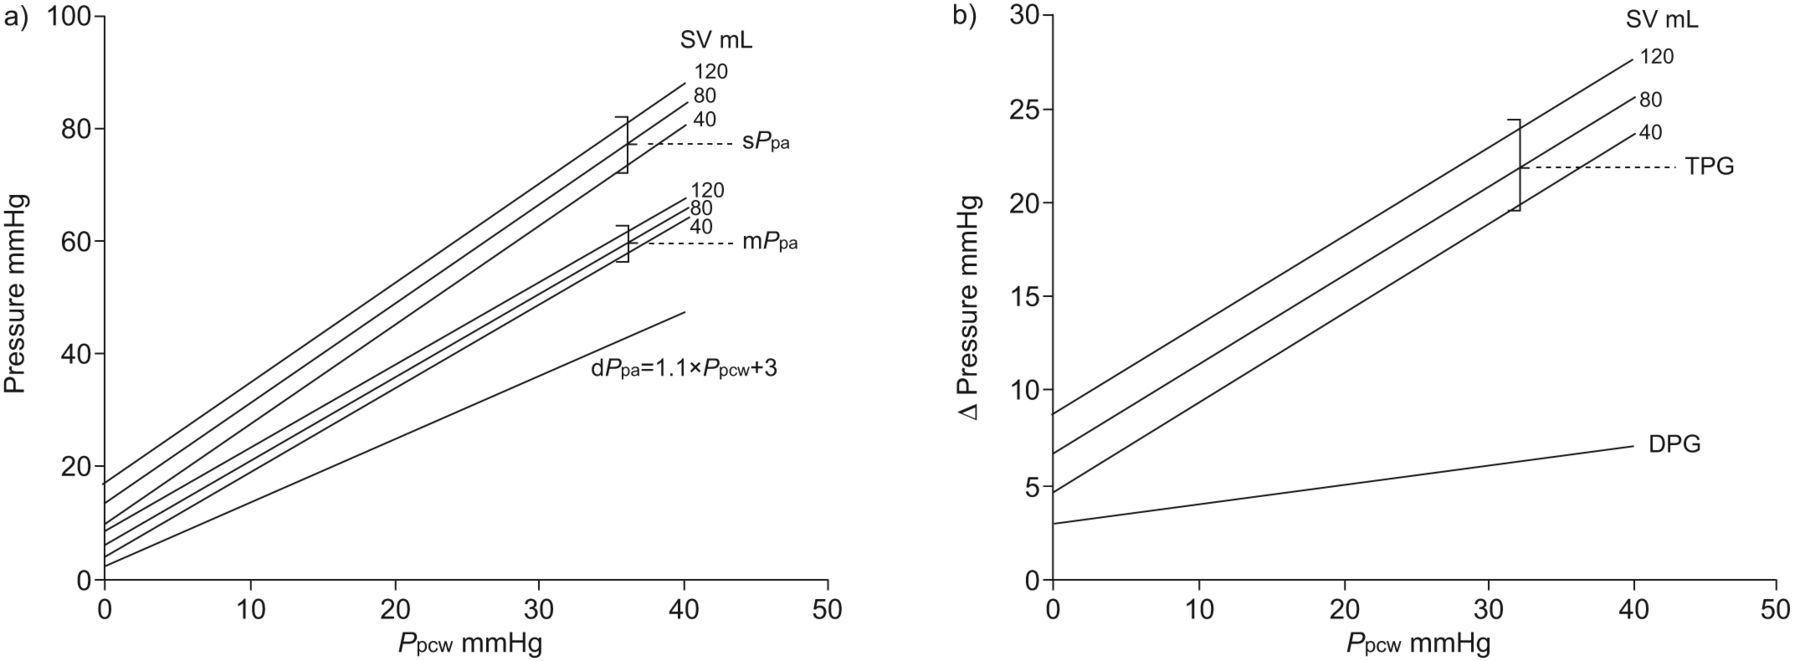
Effects of pulmonary capillary wedge pressure (Ppcw) and stroke volume (SV) on systolic (s), diastolic (d) and mean (m) pulmonary arterial pressures (Ppa). If only a fraction of Ppcw is transmitted to diastolic Ppa, the transpulmonary pressure gradient (TPG) is not a function of Ppcw but increases proportionally with SV. The diastolic Ppa/Ppcw gradient (DPG) decreases with increased Ppcw, independently of SV. The equations from [14] were used to model the response of the vasculature.

Effects of pulmonary capillary wedge pressure (Ppcw) and stroke volume (SV) on systolic (s), diastolic (d) and mean (m) pulmonary arterial pressures (Ppa). If Ppcw is directly transmitted to diastolic Ppa, there is a disproportional increase in systolic Ppa and mean Ppa depending on SV. The transpulmonary pressure gradient (TPG) increases, but the diastolic Ppa/Ppcw gradient (DPG) is independent of both Ppcw and SV. The equations from [14] were used to model the response of the vasculature.
Effects of pulmonary capillary wedge pressure (Ppcw) and stroke volume (SV) on systolic (s), diastolic (d) and mean (m) pulmonary arterial pressures (Ppa). If diastolic Ppa increases more than Ppcw, there is an out of proportion increase in systolic Ppa and mean Ppa that is a function of SV. The transpulmonary pressure gradient (TPG) increases. The diastolic Ppa/Ppcw gradient (DPG) increases linearly, but only slightly, with Ppcw and is independent of SV. The equations from [14] were used to model the response of the vasculature.
It now appears that the TPG may remain unchanged if diastolic Ppa increases less than Ppcw, but increases if diastolic Ppa increases by an equal amount or more than Ppcw. Alternatively, the diastolic Ppa/Ppcw gradient (DPG) decreases or remains unchanged as long as the upstream transmission of Ppcw remains equal or less than the unity, which is expected in the absence of pulmonary vasoconstriction or remodelling.
The tight correlation between systolic, mean, and diastolic Ppa was recently rediscovered, with similar prediction equations that interestingly remained valid in pulmonary hypertension of various severities and aetiologies [15–17]. This is explained by the monotonous response of the pulmonary circulation to insults, leading to proportional inverse changes in Cpa and PVR with an unaltered time constant Cpa × PVR 0.6–0.7 s [18, 19]. There may be one noticeable exception: pulmonary hypertension on passive upstream transmission of increased Pla in left heart conditions. In these patients Cpa decreases proportionally more than the increase in PVR, because increased Pla is a cause of both pulmonary arterial stiffening and decreased PVR. Accordingly, the time constant in pulmonary hypertension on left heart conditions is shorter than in other types of pulmonary hypertension [20]. This spuriously increases the TPG, but does not affect DPG.
It must be reminded that Cpa should not be confused with the distensibility coefficient α. Cpa is a global calculation, influenced by proximal pulmonary arterial elasticity, while distensibility coefficient α strictly corresponds to the distensibility of small peripheral pulmonary resistive vessels.
Thus the disproportionate decrease in Cpa in the presence of increased Pla may be a cause of increased TPG without any coexistent pulmonary vasoconstriction or remodelling. How this may cancel out the decrease in TPG, related to pulmonary vascular recruitment and distension, is unpredictable.
Clinicians, understandably, like to have cut-off values for decision making purposes that are based on haemodynamic measurements. We regret to have to tell them that a TPG of 12 mmHg cannot be used for that purpose. The DPG may be preferable because this gradient is less sensitive to changes in Cpa, SV, and absolute values of Pla.
THE DPG FOR THE DIFFERENTIAL DIAGNOSIS OF PULMONARY HYPERTENSION
The DPG used to be implemented in the assessment of cardiac versus pulmonary causes of acute respiratory failure in critically ill patients [21]. Here we propose an adaptation of this DPG-derived decision tree to make it more generally applicable (fig. 7). The previous decision tree rested on a cut-off value for Ppcw of 10 mmHg. A Ppcw of 12 mmHg, or a direct measure of left ventricular end-diastolic pressure of 15 mmHg, would seem a more reasonable cut-off value as extreme upper limits of normal; as used in diagnostic algorithms of diastolic heart failure [22]. The next step is a DPG below or above 5 mmHg, to discern passive upstream transmission of Pla from increased PVR due to pulmonary vasoconstriction and/or pulmonary vascular structural changes. The last step is cardiac output, being normal or decreased in heart failure, or normal or increased in hypervolaemia and/or increased venous return on low systemic vascular resistance in anaemia, systemic shunts, or sepsis. The arteriovenous oxygen content difference (Dav,O2) can be used as a surrogate of cardiac output, as the Fick equation predicts that both variables are inversely correlated at any given value of oxygen uptake [21]. The Dav,O2 is a useful internal control to integrate in haemodynamic measurements at right heart catheterisation, as errors on a measurement of cardiac output are always possible. Low systemic blood pressure argues in favour of a septic complication. Cut-off values for cardiac output or blood pressure are not proposed because of insufficient evidence and the desire to propose a decision tree with sufficient flexibility to assist, rather than impose, clinical decisions.

Pulmonary capillary wedge (Ppcw)-derived algorithm for the diagnosis of heart failure (low or high output) versus intrinsic pulmonary vascular disease. A cut-off value of 12 mmHg is selected as a true upper limit for normal Ppcw measured at right heart catheterisation. If the cardiac catheterisation is left, Ppcw is replaced by left ventricular (LV) end-diastolic pressure, with a cut-off value of 15 mmHg. Systemic hypotension is considered to make the decision tree applicable to septic shock. DPG: diastolic pulmonary arterial pressure/Ppcw gradient.
CONCLUSION AND PERSPECTIVE
In 1971, Harvey et al. [14] stated: “The pulmonary circulation has been under intensive study by innumerable investigators for almost 30 years. From the vast amounts of carefully accumulated data, certain conclusions can be drawn”. More than 40 yrs later, there has been progress, but also some persisting misconceptions. A typical example is the reliance of the TPG for the differential diagnosis of pulmonary vascular disease. The present discussion shows how the TPG may over-diagnose or under-diagnose pulmonary vascular disease in left heart conditions associated with an increased pulmonary venous pressure, and that this is, to a large extent, avoided by the use of a DPG. The DPG combined with clinical probability assessment, absolute values of Ppcw or Pla, cardiac output or DavO2 and blood pressure measurements appear to be more useful for the diagnosis of “out of proportion” pulmonary hypertension secondary to left heart conditions, and may help in the management of critically ill patients with sepsis or acute lung injury.
It is of course understood that the presently proposed diagnostic tree requires prospective validation. This could be undertaken along with TPG-based algorithms as all these measurements are currently performed during diagnostic catheterisations.
As a final word of caution, one should never forget that decision trees based on single measurement cut-off values are vulnerable. This was recently illustrated by a poor agreement between right and left heart catheterisation measurements of Ppcw and Pla in a large patient population [23], and persistant discussion on how optimally measure Ppcw [24]. The measurement of diastolic Ppa is more exposed than mean Ppa to motion artefacts and inadequate dynamic responses due to over damping or under damping (insufficient or excessive flushing of the manometer fluid-filled catheter system). This may explain why Ppcw higher than diastolic Ppa are sometimes observed [14], although this is physically impossible. Furthermore, diagnostic cut-off values do not necessarily coincide with upper limits of normal [1, 2], and some uncertainty also remains with the limits of normal of pulmonary haemodynamics in respect of aging, as the number of reported studies in old but healthy subjects remains limited [10–12, 14]. Thus the upper limit of normal for the DPG may have to be increased in elderly, healthy subjects. Great care must be applied in the quality control of measurements and they should be cross-checked with clinical probability assessments and alternative imaging techniques should be pursued, whenever possible.
Footnotes
For editorial comments see page 7.
Statement of Interest
A statement of interest for R. Naeije can be found at www.erj.ersjournals.com/site/misc/statements.xhtml
- Received May 10, 2012.
- Accepted July 26, 2012.
- ©ERS 2013
REFERENCES


