


Figures
- Figure 1–
Survival of unresected stage I–II nonsmall cell lung cancer patients treated with combined chemoradiotherapy (CRT) or radiotherapy (RT) alone. Overall survival was significantly better among patients treated with combined CRT (p<0.001).
- Figure 2–
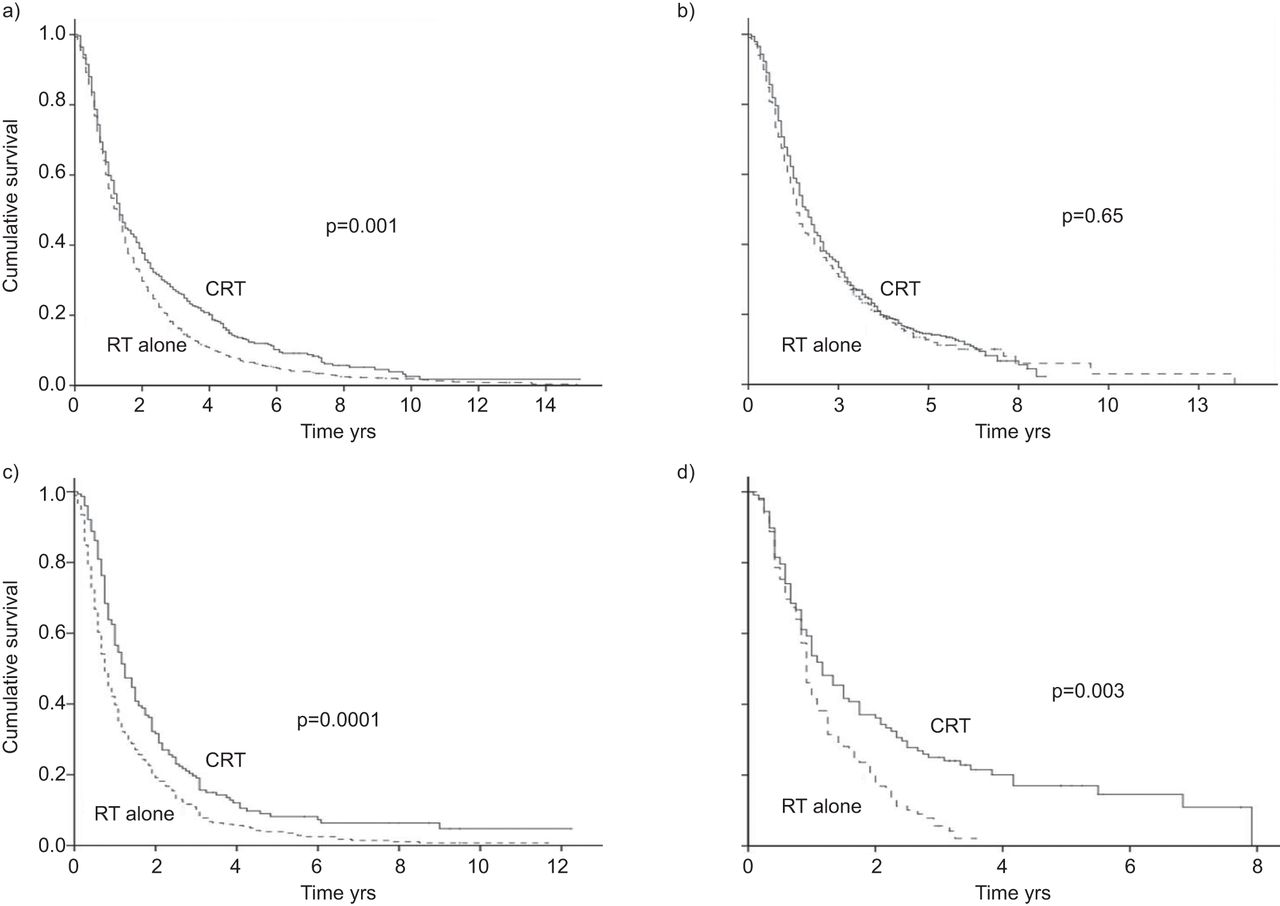
Overall survival of unresected stage I–II nonsmall cell lung cancer patients treated with combined chemoradiotherapy (CRT) or radiotherapy (RT) alone according to stage and RT complexity. a) Stage I patients treated with intermediate complexity radiotherapy: use of combined CRT was associated with improved overall survival (p=0.0001). b) Stage I patients treated with high complexity RT: no significant difference in survival was observed among patients treated with CRT or RT alone (p=0.65). c) Stage II patients treated with intermediate complexity RT: patients treated with combined CRT had improved survival (p=0.0001). d) Stage II patients treated with high complexity RT: CRT was associated with significantly improved survival rates (p=0.003).


Tables
- Table 1– Characteristics of unresected stage I and II nonsmall cell lung cancer treated with radiotherapy (RT) alone or combined chemoradiotherapy (CRT)
Characteristic RT alone CRT p-value Unadjusted Adjusted# Subjects n 2222 784 Age yrs 66–70 363 (17) 248 (29) <0.0001 0.68 71–75 594 (27) 279 (33) >75 1205 (56) 317 (38) Female 1071 (50) 373 (44) 0.008 0.96 Race White 1861 (87) 729 (86) 0.40 0.99 African-American 184 (8) 71 (8) Hispanic 16 (1) 11 (1) Other 101 (5) 33 (4) Marital status Married 1037 (48) 492 (58) <0.0001 0.93 Median income in ZIP code of residence Lowest quartile 634 (29) 252 (30) 0.46 0.99 Second quartile 555 (26) 231 (27) Third quartile 532 (25) 210 (25) Highest quartile 439 (20) 151 (18) Charlson comorbidity score ≤1 599 (28) 290 (34) <0.0001 0.97 1–2 721 (33) 311 (37) >2 842 (39) 243 (29) Histology Adenocarcinoma 682 (32) 266 (32) 0.19 0.99 Squamous cell carcinoma 1015 (47) 413 (49) Large cell carcinoma 188 (9) 80 (9) Other 277 (13) 85 (10) Tumour location Upper lobe 1243 (57) 488 (58) 0.001 0.73 Middle lobe 107 (5) 27 (3) Lower lobe 714 (33) 262 (31) Main bronchus 81 (4) 54 (6) Other 17 (1) 13 (2) Tumour size mm ≤20 329 (20) 73 (12) <0.0001 0.99 20–30 427 (29) 149 (24) 30–50 578 (35) 222 (36) 50–70 201 (12) 122 (20) >70 60 (4) 53 (9) Stage I 1781 (82) 584 (69) <0.0001 0.79 II 381 (18) 260 (31) Data are presented as n (%), unless otherwise stated. #: p-values adjusting for propensity scores.
- Table 2– Propensity score analysis: comparison of survival of unresected stage I and II elderly lung cancer patients treated with combined chemoradiotherapy and radiation therapy (RT) alone
Model HR#(95% CI) Primary analysis Adjusting for propensity scores 0.85 (0.78–0.94) Stratified by propensity score quintiles 0.85 (0.78–0.93) Matched analysis 0.86 (0.79–0.94) Secondary analyses Limited to intermediate complexity radiation therapy planning¶ Adjusting for propensity scores 0.77 (0.69–0.86) Stratified by propensity score quintiles 0.77 (0.69–0.86) Matched analysis 0.78 (0.70–0.87) Limited to complex radiation therapy planning Adjusting for propensity scores 1.03 (0.88–1.12) Stratified by propensity score quintiles 1.00 (0.87–1.14) Matched analysis 1.04 (0.89–1.22) Adjusting for time trends Adjusting for propensity scores 0.88 (0.80–0.96) Stratified by propensity score quintiles 0.87 (0.80–0.95) Matched analysis 0.88 (0.81–0.96) Stage I disease treated with intermediate complexity radiation therapy planning Adjusting for propensity scores 0.80 (0.70–0.90) Stratified by propensity score quintiles 0.80 (0.70–0.91) Matched analysis 0.78 (0.70–0.89) Stage I disease treated with complex radiation therapy planning Adjusting for propensity scores 1.14 (0.95–1.34) Stratified by propensity score quintiles 1.13 (0.94–1.35) Matched analysis 1.08 (0.90–1.29) Stage II disease treated with intermediate complexity radiation therapy planning Adjusting for propensity scores 0.72 (0.58–0.89) Stratified by propensity score quintiles 0.70 (0.57–0.87) Matched analysis 0.66 (0.53–0.82) Stage II disease treated with complex radiation therapy planning Adjusting for propensity scores 0.64 (0.45–0.90) Stratified by propensity score quintiles 0.61 (0.44–0.86) Matched analysis 0.70 (0.48–0.98) #: the hazard ratio (HR) represents the risk of death of a patient treated with combined chemoradiotherapy and radiotherapy compared with a patient treated with RT alone; ¶: the analyses were restricted to patients treated with intermediate complexity (two-dimensional) RT planning.
- Table 3– Hospitalisations for adverse events related to combined chemoradiotherapy (CRT) and radiation therapy (RT) among unresected stage I and II lung cancer patients in the study
Toxicity Patients hospitalised with toxicity-related diagnoses OR (95% CI)# OR (95% CI) adjusted for propensity scores RT alone CRT Infection 104 (4.8) 73 (8.7) 1.9 (1.4–2.6) 2.0 (1.4–2.8) Neutropenia ≤11(<0.5)¶ >50 (>5.5) 24.6 (10.5–57.3) 21.5 (9.0–51.4) Fever 12 (0.6) 12 (1.4) 2.6 (1.2–5.8) 2.1 (0.9–5.2) Dehydration 132 (6.1) 92 (10.9) 1.9 (1.4–2.5) 1.8 (1.4–2.5) Nausea/emesis 19 (0.9) 25 (3.0) 3.4 (1.9–6.3) 3.1 (1.6–5.8) Anaemia 105 (4.8) 108 (12.8) 2.9 (2.2–3.8) 2.8 (2.1–3.9) Thrombocytopenia ≤11 (<0.5) ≤11 (<1.0) 6.9 (1.8–26.0) 11.5 (2.9–45.7) Renal dysfunction 22 (1.0) 13 (1.5) 1.5 (0.7–3.0) 1.6 (0.8–3.4) Unspecified adverse events
of systemic therapy≤11 (<0.5) <15 (<2.0) 36.5 (4.8–277.6) 30.8 (3.9–243.4) Data are presented as n (%), unless otherwise stated. #: odds ratio for toxicity-related hospitalisation among patients treated with CRT compared with those treated with RT alone; ¶: because of Surveillance, Epidemiology and End Results registry linked to Medicare claims privacy rules, exact numbers are not reported for small subgroups, which might risk loss of confidentiality.


