


Abstract
Prediction bias in spirometry reference equations can arise from combining equations for different age groups, rounding age or height to integers or using self-reported height.
To assess the bias arising from these sources, the fit of 13 prediction equations was tested against the Global Lungs Initiative (GLI) dataset using spirometric data from 55,136 healthy Caucasians (54% female). The effects on predicted values of using whole-year age versus decimal age, and of a 1% bias in height, were quantified.
In children, the prediction bias relative to GLI ranged from -22% to +17%. Switching equations at 18 yrs of age led to biases of between -846 (-14%) and +1,309 (+38%) mL. Using age in whole years rather than decimal age introduced biases from -8% to +7%, whereas a 1% overestimation of height introduced bias that ranged from +1% to +40%. Bias was greatest in children and adolescents, and in short elderly subjects.
Using a single spirometry equation applicable across all ages and populations reduces prediction bias. Measuring and recording age and height accurately are also essential if bias is to be minimised.
Height and age are the most important explanatory variables in spirometry reference equations. Guidelines for the measurement of spirometric indices, aiming to maximise accuracy and precision, focus on equipment, measurement procedures and quality control [1]. They do not, however, address the equally important issues of accurate height and age measurement. For example, in the Global Lungs Initiative (GLI) dataset [2], only 45% of the heights were recorded to 1 mm accuracy, 12% of heights were self-reported, and 45% of ages were recorded in whole years, many rounded by software. These all have the potential to bias the prediction of spirometric indices, particularly in children.
Both height and age appear consistently in adult prediction equations, but in children height is commonly used without age. Examples are Polgar et al. [3] and Wang et al. [4] (recommended by the American Thoracic Society and the European Respiratory Society (ERS) [1] in the USA), Rosenthal et al. [5] in the UK (recommended by the British Thoracic Society and the Association of Respiratory Technicians and Physiologists [6]) and Zapletal et al. [7] in Europe. Yet it has been shown that during adolescence the relationship between age, height and spirometry changes [8, 9], and that this can only be accounted for by including age in the equation [9, 10]. Thus the omission of age from the equation will generate bias at certain ages in childhood.
In the past, most prediction equations were developed separately for children and adults, with a disjunction in the prediction at the child–adult age boundary (usually around 18–19 yrs). Recently, spirometry reference equations have become available for Caucasians [10] and other ethnic groups [2] from childhood to old age, complete with accurate lower limits of normal. These all-age equations avoid the child–adult disjunction, and they inevitably highlight bias due the disjunction in other equations.
This study aims to address four questions, focusing on forced expiratory volume in 1 s (FEV1) and forced vital capacity (FVC) in Caucasians relative to the GLI [2], namely: how large is the prediction bias 1) for other commonly used spirometry prediction equations, 2) for paediatric prediction equations that omit age, 3) at the child–adult age boundary and 4) due to biases in age and height measurement?
We used data on 54,866 healthy Caucasian lifelong nonsmokers from the GLI [2]; 24,768 males and 30,098 females aged 6–95 yrs. The paediatric subset comprised of 14,486 boys (height 96.0–198.5 cm) and 14,053 girls (height 100.0–188.0 cm) aged 6–18.99 yrs.
A full account of the GLI dataset is currently in press [2].
METHODS
FEV1 and FVC measurements from the GLI 2012 dataset were expressed as per cent of predicted, based on each of the following prediction equations. Children and adolescents: GLI 2012 [2], Polgar et al. [3], Wang et al. [4], Rosenthal et al. [5], Zapletal et al. [7], Quanjer et al. [9], Stanojevic et al. [10], Hankinson et al. [11] and Knudson et al. [12]; Adults: GLI 2012 [2], Stanojevic et al. [10], Crapo et al. [13], European Community for Steel and Coal/ERS [14], Falaschetti et al. [15] and the SAPALDIA study [16, 17].
Within the dataset, height was recorded to 1 mm accuracy in 57.2% of those <19 yrs and 33.8% of those ≥19 yrs (n=28,539 and 26,327, respectively). Similarly, age was reported to one decimal place accuracy in 89.2% of subjects <19 yrs and in 16.0% of those ≥19 yrs.
The effect of recording age in whole years was explored by comparing predicted values based on decimal age with those based on truncated age. Predicted values were also calculated using a +1% bias in height, to simulate a small measurement error or optimistic self-report. The bias introduced in age was 0.0–0.99 yrs (mean±sd 0.30±0.32 in males and 0.26±0.32 yrs in females), while for height the bias was 0.9–2.0 cm (mean±sd 1.5±0.24 cm) in males, and 0.8–1.9 cm (mean±sd 1.5±0.18 cm) in females. All calculations were performed within the age range specified in published prediction equations, precluding extrapolation beyond valid age ranges.
The “18th birthday effect” is the size of the transition from a paediatric equation that may be applied up to 18 yrs of age to an adult equation in subjects ≥18 yrs. This was estimated by identifying 386 boys and 404 girls in the dataset who were 17 yrs old, and calculating their predicted values for both 17.99 and 18.0 yrs of age, according to the various child and adult prediction equations [2–5, 7, 9–17]. The same height was used at both ages.
RESULTS
Effect of switching to the GLI 2012 equations in children
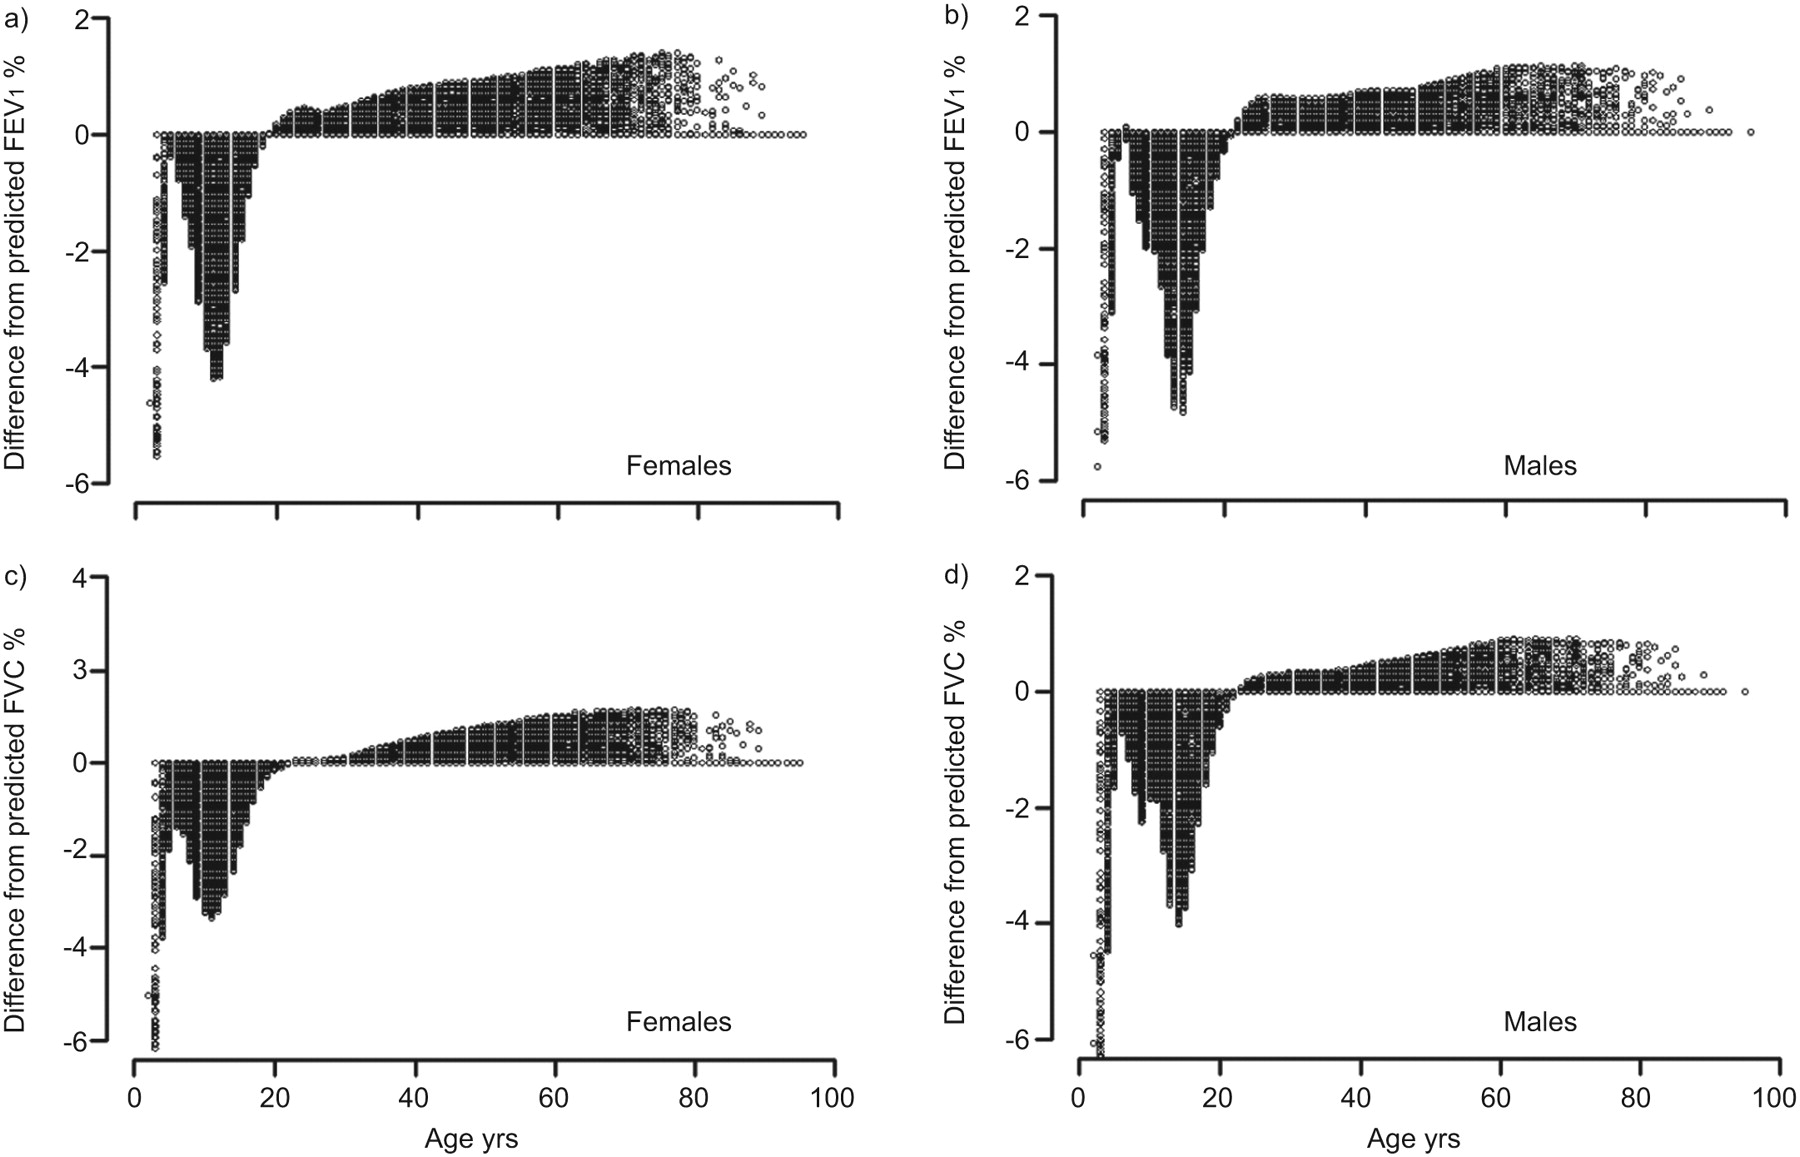
Mean deviations of measured values from 100% predicted were calculated for each regression equation. Predictably, the equations for GLI 2012 [2] and Stanojevic et al. [10] fitted best as they shared methodology and had many data in common, but are still slightly biased during the growth spurt (fig. 1). The reference equations omitting age as an explanatory variable (Polgar et al. [3], Rosenthal et al. [5] and Zapletal et al. [7]) performed particularly poorly (table 1; fig. 1).

Average deviations from predicted values, expressed as per cent of predicted, for forced expiratory volume in 1 s (FEV1) (upper panels) and forced vital capacity (FVC) (lower panels) in girls (left panels) and boys (right panels), when applying prediction equations from various authors to the Global Lungs Initiative (GLI) data. A difference of 0% indicates that the predicted values perfectly match the GLI 2012 data.
Birthday effect in children
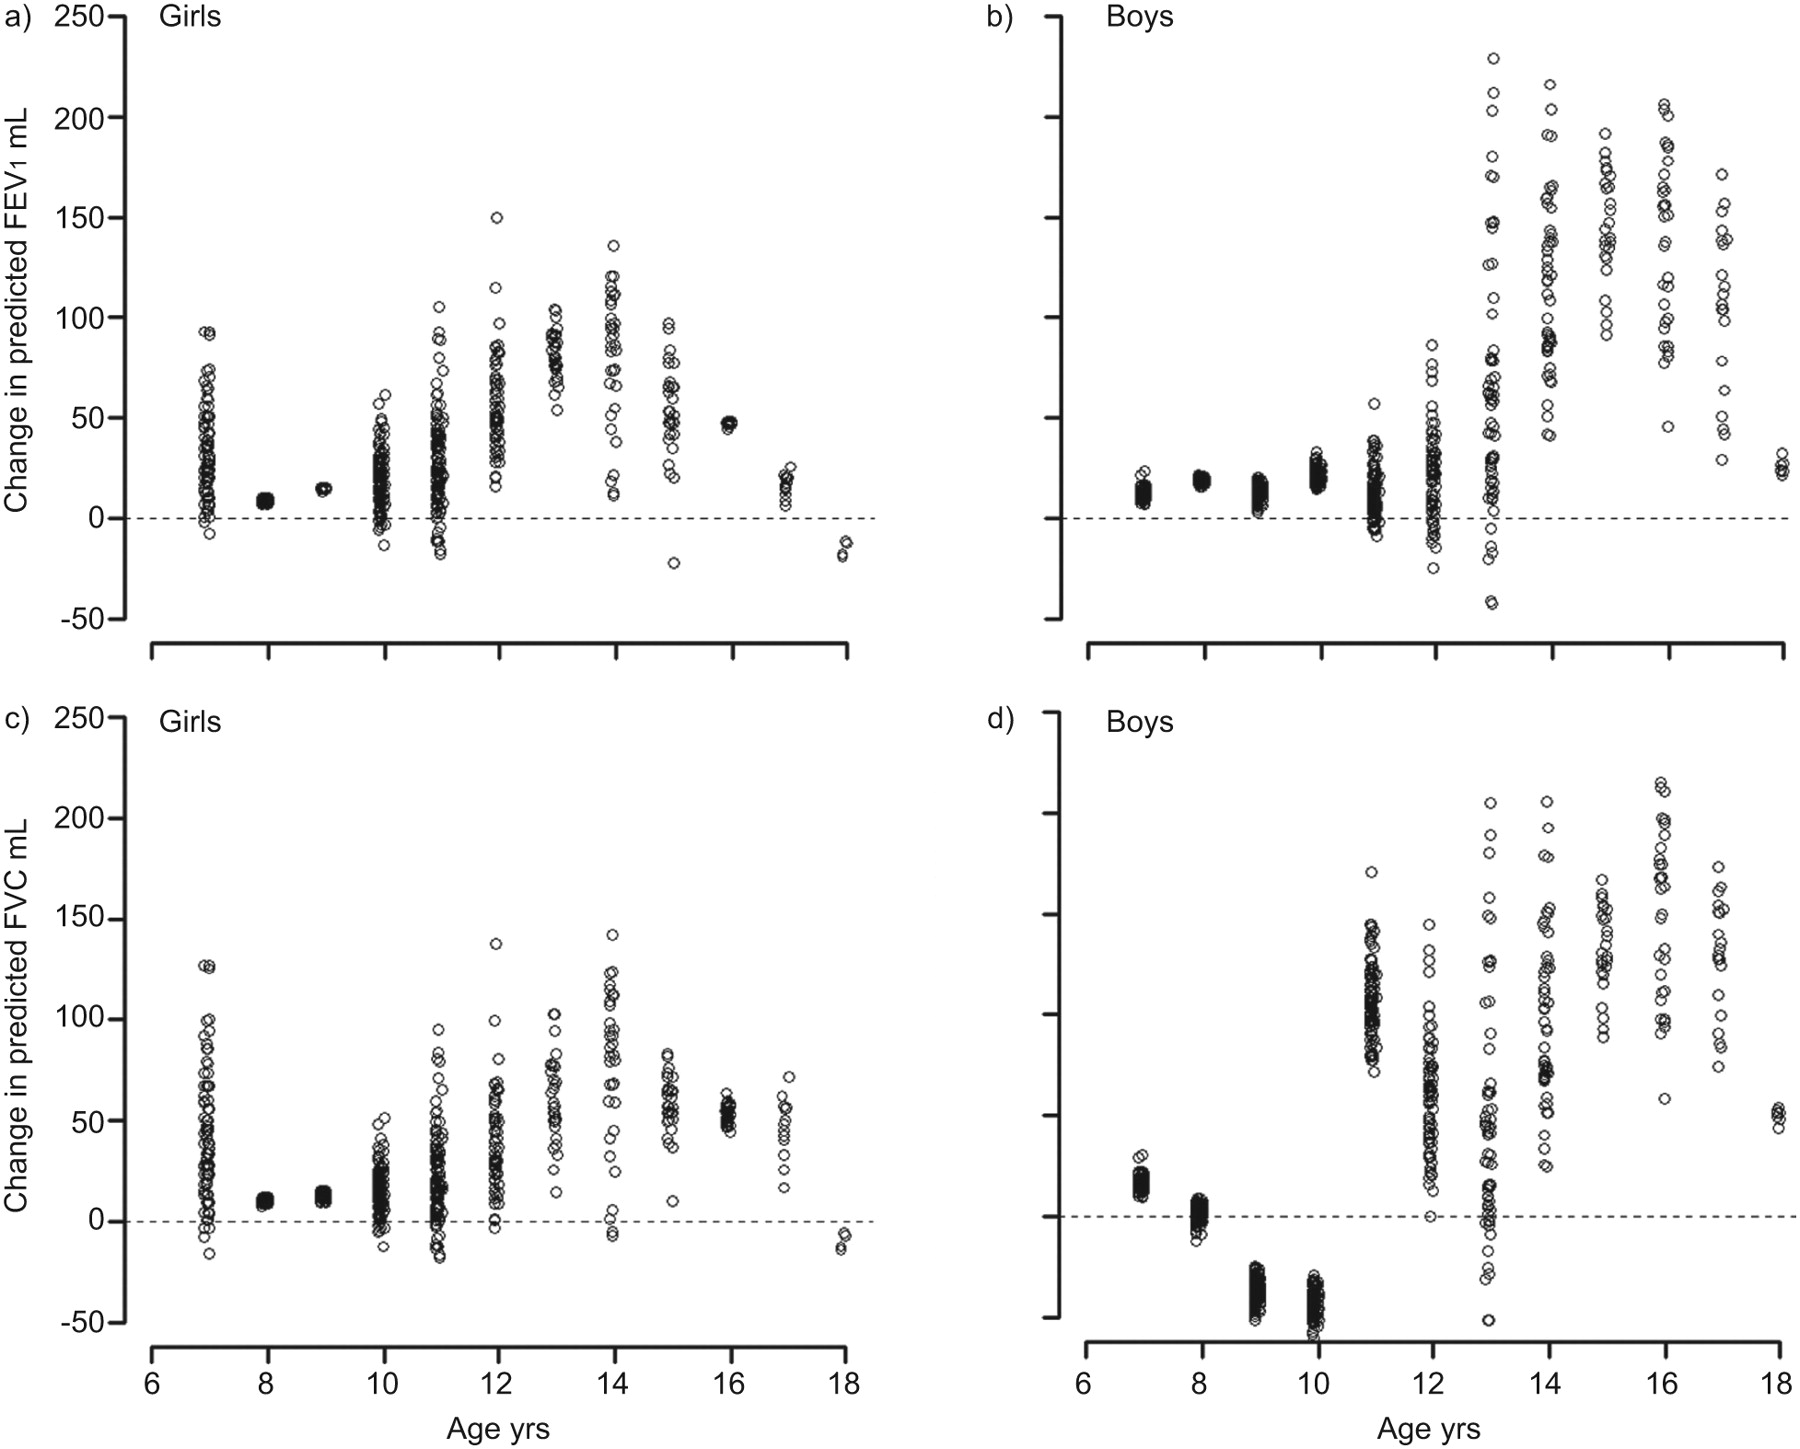
Predicted values from Wang et al. [4] are based on power functions of height which differ for each full year from 6–18 yrs. We identified 1,987 subjects from the GLI dataset (1,019 boys and 968 girls) who were within 1 month of their birthday, and calculated their Wang predicted values for the ages before and after their birthday (fig. 2). The same height was used for both predictions, as height increment over a month is small. In girls and boys the birthday discontinuities varied from -42 to +229 mL in FEV1, and -65 to +215 mL in FVC.

Differences between predicted values for forced expiratory volume in 1 s (FEV1) and forced vital capacity (FVC) by sex just before and after a birthday (i.e. for the same height), based on the age-specific prediction equations of Wang et al. [4].
When switching to other equations at age 18 yrs (18th birthday effect), the FEV1 change in boys ranged between -846 mL (-14%) and +1,309 mL (+38%) (table 2). Findings for FVC and for girls were similar (not shown).
Biased age and height measurements
Based on the GLI 2012 equations [2], the percentage bias in FEV1 and FVC arising from truncating age to whole years was largest in preschool children and adolescents, up to 8.5% (fig. 3; table 3). With the GLI 2012 [2] and Stanojevic equations [10] a 1% bias in height led to biases in FEV1 and FVC of 2.1–2.4% (table 3). Truncating age and exaggerating height reduced the bias in childhood (fig. 3) but increased it in adulthood. The use of other equations led to biases of -9 to +40% across the entire age range (table 3).
Percentage bias in predicted forced expiratory volume in 1 s (FEV1) and forced vital capacity (FVC) by sex due to truncating age to whole years. Predicted values according to Global Lungs Initiative, 2012 [2].
DISCUSSION
There are several practical considerations that affect the interpretation of lung function values. The current practice to combine reference equations from different populations and different age ranges introduces biases ranging from -14% to 38% at the transition from adolescence to adulthood. This range can be converted to the z-score scale by dividing by the coefficient of variation, which at this age is ∼12% [2]. So the bias ranges from -1.2 and +3.2 z-score units, with potentially serious consequences for the clinical interpretation of test results around the lower limit of normal. Truncating age or using self-reported height leads to further biases. The interpretation of spirometry results could be greatly improved by applying a global reference equation spanning all ages, and using measures of height and age accurate to at least one decimal place.
With two exceptions which shared many of the data and used the same statistical approach [2, 10], the fit of the prediction equations to the GLI dataset was poor, and there was considerable disparity between equations. This leads to a number of sobering conclusions. The present situation with respect to prediction equations is highly unsatisfactory, particularly in the paediatric age range. There is a plethora of spirometry equations; a non-exhaustive summary lists over 120 such equations [18]. However, the piecemeal approach of dividing the human lifespan into small sections inevitably leads to disjunctions at the age group boundaries (table 2). These arise mainly from the use of different models, which may fit the data poorly, and from the use of population samples that are often small and only poorly representative of the population [2, 19]. Thus there is an urgent need for a consistent evidence-based approach towards the construction and use of reference values. Until recently no statistical techniques allowed accurate and continuous description of pulmonary function from childhood to old age. However, with the advent of new techniques, notably the GAMLSS technique [10, 20–23] it is now possible to summarise pulmonary function across the whole age range. In addition, it allows the lower limit of normal (usually the fifth percentile), which varies appreciably with age [10, 15, 16, 22], to be modelled properly. It is costly and time-consuming to collect sufficient data covering the entire age range. However, collating good quality data from different studies has been shown to be a valid alternative [9, 10, 22, 24].
With the advent of automated pulmonary function machines, laboratories have to decide which prediction equations to use from the selection provided by the manufacturer. Few laboratories are sufficiently informed about the alternatives, and in practice many use the manufacturer's default choice. Such defaults often include equations that include a transition from adolescence to adulthood. Even in institutions with respiratory disease training programmes, people are often unaware of the reference values used in their institute [25, 26]. Changes in reference standards, particularly when unannounced, can have considerable impact on diagnosis, referrals, treatment, preoperative assessments, disability ratings and even lung transplantation referrals, as well as the interpretation of serial measurements [27–29]. There is an urgent need for the use of prediction equations which span childhood to old age [2, 10]; the GLI 2012 equations achieve this [2], and offer the additional advantage of being valid for four ethnic groups, obviating the need for arbitrary ethnic correction factors.
The second major finding is that biased age and height measurements can lead to considerable bias in predicted values, which naturally propagate into the lower limits of normal. For example, using the GLI 2012 reference [2], a 1-yr age bias due to truncating age to the last birthday, can lead to a bias in predicted values of up to 8.5% (table 3). This may be due simply to the common practice of entering age in whole years, or the failure of software to compute decimal age as the difference between test date and birth date. Truncating age biases the predicted value downwards in children, particularly in puberty, and upwards in adults (fig. 3). A bias of only +1% in height results in an increase in predicted FEV1 and FVC by between 0.9% and 40%. In reality, biases greater than this can easily occur purely due to a poorly calibrated stadiometer, or using self-reported height. Importantly the two biases are cumulative, leading to significant errors in predicted spirometric outcomes.
Errors in height of up to 6.9 cm can arise from the use of self-reported height [30], as has been reported for several different ethnic groups [30–34]. Males tend to overestimate their height more than females [35]. Over-reporting height also increases with age; thus on average males and females aged 65–79 yrs over-reported by 2.3 and 1.6 cm, respectively, and those aged 80 yrs or older by 2.6 and 3.3 cm [35]. In addition errors in height can occur if previously recorded values are used: in children during periods of rapid growth, and in elderly people when height loss has occurred. Note that although the study was limited to Caucasians, the findings also apply to other ethnic groups (results not shown).
For accurate interpretation of lung function it is essential that age and height should be entered into equations accurately. This can be achieved by using software which requires entering the date of birth as well as the date of measurement. Height should be measured with a calibrated stadiometer with the subject standing upright, without shoes, with shoulders, buttocks and heels flat against the wall or stadiometer, and the head tilted so that the lower orbital level and the external auditory meatus (Frankfurt plane) are level; measurements should be recorded to the nearest 0.1 cm. Ideally the mean of two measurements should be used. Inches should not be used, as the conversion to centimetres may generate error. Accurately recorded height and age (to one decimal place accuracy) are also required when deriving new prediction equations.
Conclusion
There are large differences in frequently used predicted values according to different authors. Consequently, a transition from one to another set of reference equations can have profound clinical consequences. Therefore, final reports should always name the set of reference values used, so that this can be taken into account when interpreting test results. Also in any institute the transition to new reference equations should always be properly announced, and the consequences clearly explained to medical practitioners. The use of modern prediction equations valid from childhood to old age, derived from large datasets [2, 10] and applicable to different ethnic groups [2], obviates the need to change from one set of equations to another, and so avoids age-related disjunctions. It also provides a worldwide standard for the interpretation of spirometric test results.
Acknowledgments
Members of the ERS Global Lungs Initiative (www.lungfunction.org) are as follows. Chairs: J. Stocks, X. Baur, G.L. Hall and B. Culver; analytical team: P.H. Quanjer, S. Stanojevic, T.J. Cole and J. Stocks; additional members of the steering committee: J.L. Hankinson, P.L. Enright, J.P. Zheng and M.S.M. Ip. Persons and centres contributing data on Caucasians to the Global Lung Initiative are as follows. H.G.M. Arets, Dept of Pediatric Pulmonology, Wilhelmina Children's Hospital, University Medical Center Utrecht, Utrecht, the Netherlands; C. Bárbara, The Portuguese Society of Pneumology, Lisbon, Portugal; C.S. Beardsmore, Dept of Infection, Immunity and Inflammation (Child Health), University of Leicester, Leicester, UK; H. Ben Saad, Laboratory of Physiology, Faculty of Medicine, Sousse, University of Sousse, Tunisia; B. Brunekreef, Institute for Risk Assessment Sciences, Universiteit Utrecht, Utrecht, the Netherlands; P.G.J. Burney, National Heart and Lung Institute, Imperial College, London, UK; D. Dockery, Dept of Environmental Health, Dept of Epidemiology, Boston, MA, USA; H. Eigen, Section of Pulmonology and Intensive Care, James Whitcomb Riley Hospital for Children, Indiana University School of Medicine, Indianapolis, IN, USA; E. Falaschetti, Health Survey for England 1995–1996 (HSE), International Centre for Circulatory Health, National Heart and Lung Institute, Imperial College, London, UK; B. Fallon, Respiratory Laboratory, Nepean Hospital, Penrith, Australia; M. Gappa, LUNOKID study group, Children's Hospital and Research Institute, Marienhospital Wesel, Wesel, Germany; M.W. Gerbase, Division of Pulmonary Medicine, University Hospitals of Geneva, Geneva, Switzerland, and the SAPALDIA cohort study; T. Gislason, Landspitali University Hospital, Dept of Allergy, Respiratory Medicine and Sleep, Reykjavik, Iceland; C.J. Gore, Physiology Department, Australian Institute of Sport, Belconnen, Australia; A. Gulsvik, Dept of Thoracic Medicine, Institute of Medicine, University of Bergen, Bergen, Norway; G.L. Hall, Respiratory Medicine, Princess Margaret Hospital for Children, Perth, Australia; J.L. Hankinson, NHANES, NHANES III Special data sets, Hankinson Consulting, Valdosta, GA, USA; A.J. Henderson, ALSPAC (www.bris.ac.uk/alspac), University of Bristol, Bristol, UK; C. Janson, Dept of Medical Sciences, Respiratory Medicine and Allergology, Uppsala University, Uppsala, Sweden; C. Jenkins, Woolcock Institute of Medical Research, Sydney, Australia; A. Jithoo, University of Cape Town Lung Institute, Cape Town, South Africa; S. Karrasch, Institute and Outpatient Clinic for Occupational, Social and Environmental Medicine, Hospital of the Ludwig-Maximilians-University, Munich, Germany (KORA study); G.S. Kerby, Lung Function Measures in Preschool Children with Cystic Fibrosis study group, University of Colorado Denver School of Medicine Pulmonary Medicine, The Children's Hospital, Aurora, CO, USA; J. Kühr, Klinik für Kinder- und Jugendmedizin, Städtisches Klinikum Karlsruhe, Karlsruhe, Germany; S. Kuster, Lungenliga Zürich, Zürich, Switzerland (LuftiBus study); A. Langhammer, The HUNT Study, HUNT Research Centre, NTNU, Verdal, Norway; S. Lum, Portex Respiratory Unit, UCL, Institute of Child Health, London, UK; D.M. Mannino, University of Kentucky, Lexington, KY, USA; G. Marks, Woolcock Institute of Medical Research, Sydney, Australia; A. Miller, Beth Israel Medical Center, New York, NY, USA; E. Nizankowska-Mogilnicka, Division of Pulmonary Diseases, Dept of Medicine, Jagiellonian University School of Medicine, Cracow, Poland; W. Nystad, Division of Epidemiology, Norwegian Institute of Public Health, Oslo, Norway; R. Pérez-Padilla, Instituto Nacional de Enfermedades Respiratorias, Mexico DF, Mexico (PLATINO study); P. Piccioni, SC Pneumologia CPA ASL Torino 2, Torino, Italy; F. Pistelli, Pulmonary and Respiratory Pathophysiology Unit, Cardiothoracic Department, University Hospital of Pisa and Pulmonary Environmental Epidemiology Unit, CNR Institute of Clinical Physiology, Pisa, Italy; P.H. Quanjer, Dept of Pulmonary Diseases, and Dept of Pediatrics, Erasmus Medical Centre, Erasmus University, Rotterdam, the Netherlands; M. Rosenthal, Royal Brompton Hospital, London, UK; H. Schulz, Institute of Epidemiology I, Helmholtz Zentrum München, German Research Center for Environmental Health, Neuherberg, Germany (KORA study); S. Stanojevic, Portex Respiratory Unit, UCL Institute of Child Health, London, UK (Asthma UK Growing Lungs Initiative, www.growinglungs.org.uk), and Child Health Evaluative Sciences and Respiratory Medicine, The Hospital for Sick Children, Toronto, ON, Canada; J.B. Soriano, Program of Epidemiology and Clinical Research, CIMERA, Recinte Hospital Joan March, Illes Balears, Spain (Framingham study); W.C. Tan, iCapture Center for Cardiovascular and Pulmonary Research, University of British Columbia, Vancouver, BC, Canada; W. Tomalak, Dept Physiopathology of Respiratory System, National Institute for TBC and Lung Disease, Rabka Branch, Poland; S.W. Turner, The SEATON study group, Dept of Child Health, University of Aberdeen, Aberdeen, UK; D. Vilozni, Pediatric Pulmonary Units of The Edmond and Lili Safra Children's Hospital, Sheba Medical Center Ramat-Gan, affiliated with the Sackler Medical School, Tel-Aviv University, Tel-Aviv, Israel; H. Vlachos, Dept of Pediatrics, Division of Respiratory Medicine, University of Sherbrooke, Quebec, QC, Canada; S. West, Respiratory Function Laboratory, Westmead Hospital, Sydney, Australia; E.F.M. Wouters, Maastricht University Medical Center, Maastricht, the Netherlands; D. Zagami, Lung Function Laboratory, Gold Coast Hospital, Southport, Australia.
Footnotes
Statement of Interest
None declared.
- Received September 16, 2011.
- Accepted December 4, 2011.
- ©ERS 2012
REFERENCES


